| Param | Original file | Final file |
|---|---|---|
| Filename | modeM0/AS1A11_106T03_9000004826_33820cztM0_level2.evt | modeM0/AS1A11_106T03_9000004826_33820cztM0_level2_quad_clean.evt |
| Size (bytes) | 516,349,440 | 79,136,640 |
| Size | 492.4 MB | 75.5 MB |
| Events in quadrant A | 2,719,809 | 502,316 |
| Events in quadrant B | 3,394,044 | 503,672 |
| Events in quadrant C | 3,471,457 | 502,963 |
| Events in quadrant D | 5,645,418 | 467,956 |
| Mode M9 | |||
|---|---|---|---|
| Quadrant | BADHDUFLAG | Total packets | Discarded packets |
| A | 0 | 22 | 0 |
| B | 0 | 22 | 0 |
| C | 0 | 22 | 0 |
| D | 0 | 23 | 0 |
| Mode SS | |||
|---|---|---|---|
| Quadrant | BADHDUFLAG | Total packets | Discarded packets |
| A | 0 | 122 | 0 |
| B | 0 | 122 | 0 |
| C | 0 | 122 | 0 |
| D | 0 | 122 | 0 |
| Mode M0 | |||
|---|---|---|---|
| Quadrant | BADHDUFLAG | Total packets | Discarded packets |
| A | 0 | 12308 | 3 |
| B | 0 | 14190 | 2 |
| C | 0 | 14167 | 2 |
| D | 0 | 20991 | 2 |
| Quadrant | Total seconds | Saturated seconds | Saturation percentage |
|---|---|---|---|
| A | 6004 | 39 | 0.649567% |
| B | 6004 | 112 | 1.865423% |
| C | 6004 | 60 | 0.999334% |
| D | 6004 | 314 | 5.229847% |
Noise dominated data is calculated using 1-second bins in cleaned event files. If a bin has >2000 counts, and if more than 50% of those come from <1% of pixels, then it is considered to be noise-dominated and hence unusable.
| Quadrant | # 1 sec bins | Bins with >0 counts | Bins with >2000 counts | High rate bins dominated by noise | Noise dominated (total time) | Noise dominated (detector-on time) | Marked lightcurve |
|---|---|---|---|---|---|---|---|
| A | 7316 | 6005 | 30 | 30 | 0.41% | 0.50% | 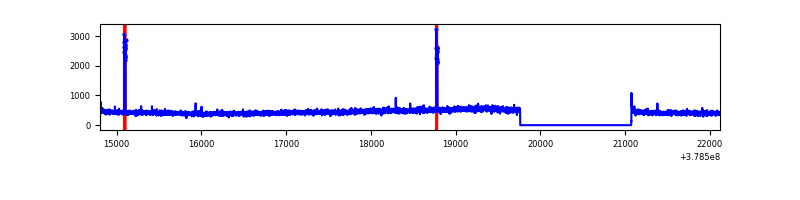 |
| B | 7316 | 6005 | 61 | 61 | 0.83% | 1.02% | 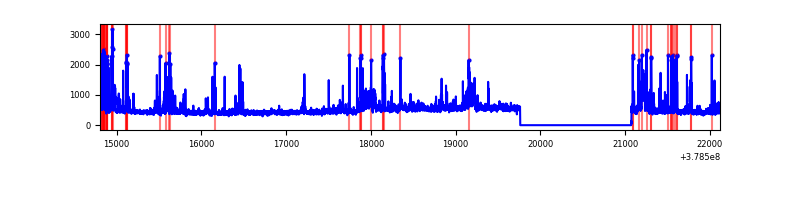 |
| C | 7316 | 6005 | 63 | 63 | 0.86% | 1.05% | 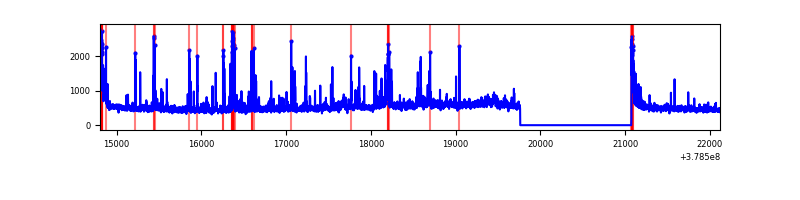 |
| D | 7316 | 6005 | 267 | 267 | 3.65% | 4.45% | 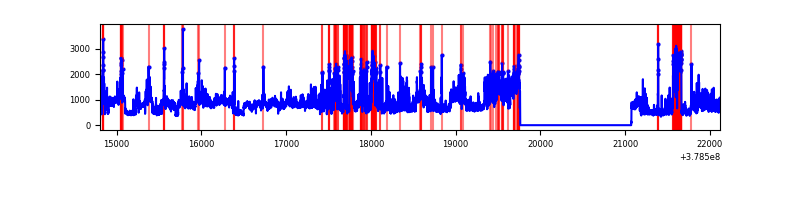 |
Top three noisy pixels from each quadrant. If the there are fewer than three noisy pixels in the level2.evt file, extra rows are filled as -1
| Pixel properties | Quadrant properties | ||||||
|---|---|---|---|---|---|---|---|
| Quadrant | DetID | PixID | Counts | Sigma | Mean | Median | Sigma |
| A | 15 | 169 | 81235 | 586.9 | 677 | 662 | 137.3 |
| A | 13 | 6 | 11508 | 79.0 | 677 | 662 | 137.3 |
| A | 13 | 254 | 10951 | 74.95 | 677 | 662 | 137.3 |
| B | 5 | 172 | 486364 | 3738.36 | 676 | 658 | 129.9 |
| B | 0 | 219 | 67298 | 512.91 | 676 | 658 | 129.9 |
| B | 0 | 190 | 43789 | 331.97 | 676 | 658 | 129.9 |
| C | 15 | 214 | 262024 | 1714.76 | 660 | 664 | 152.4 |
| C | 3 | 233 | 210433 | 1376.27 | 660 | 664 | 152.4 |
| C | 14 | 254 | 196549 | 1285.18 | 660 | 664 | 152.4 |
| D | 8 | 195 | 1340554 | 8359.94 | 650 | 632 | 160.3 |
| D | 12 | 235 | 879439 | 5482.98 | 650 | 632 | 160.3 |
| D | 2 | 250 | 285521 | 1777.46 | 650 | 632 | 160.3 |
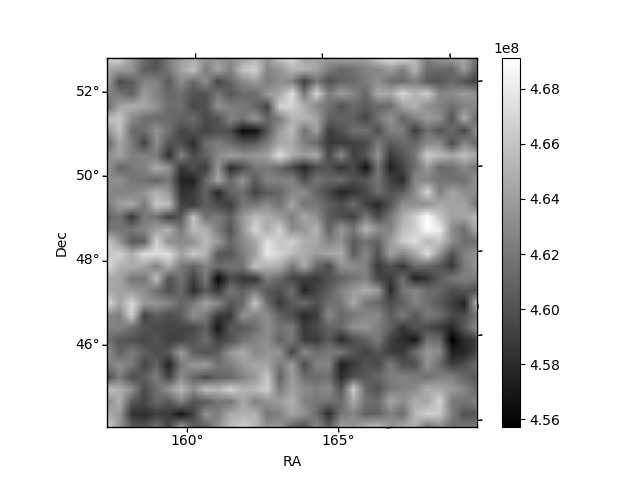
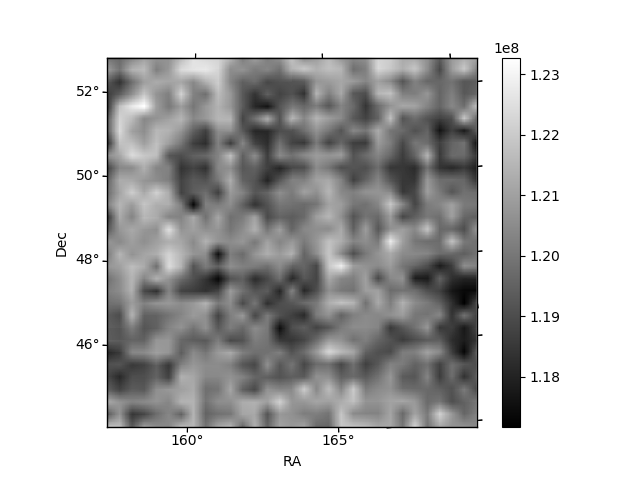
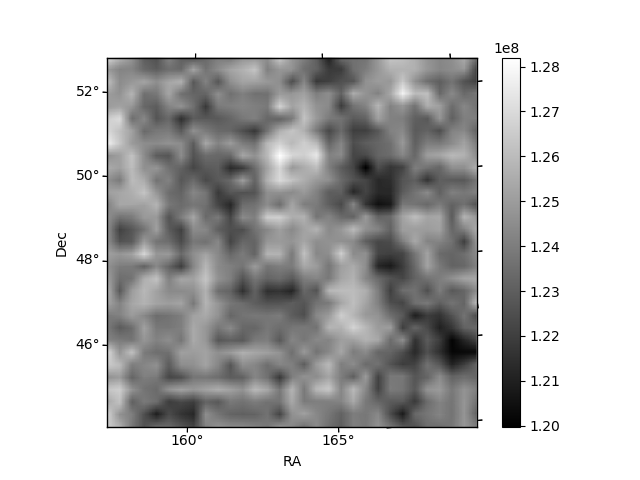
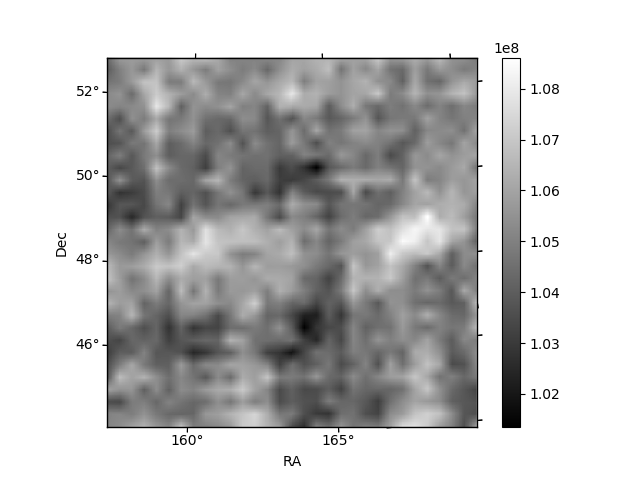
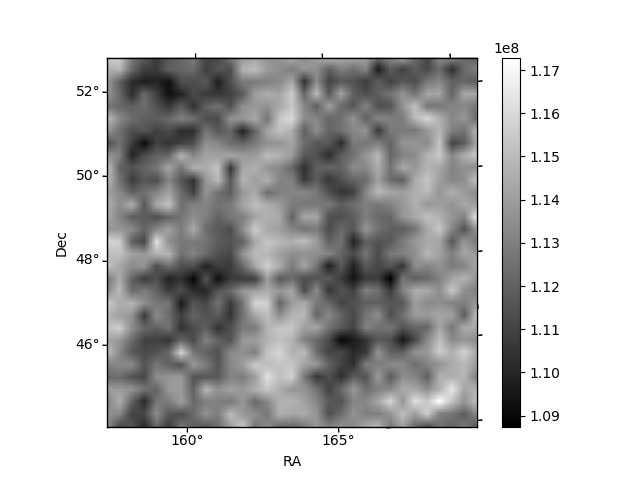
Histogram calculated using DETX and DETY for each event in the final _common_clean file
| Quadrant A | 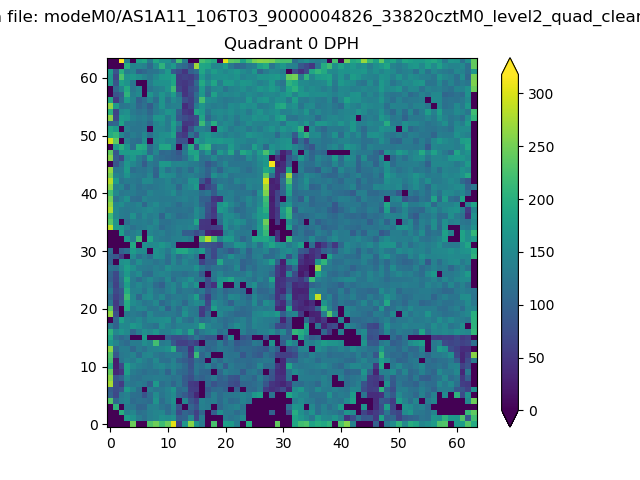 |
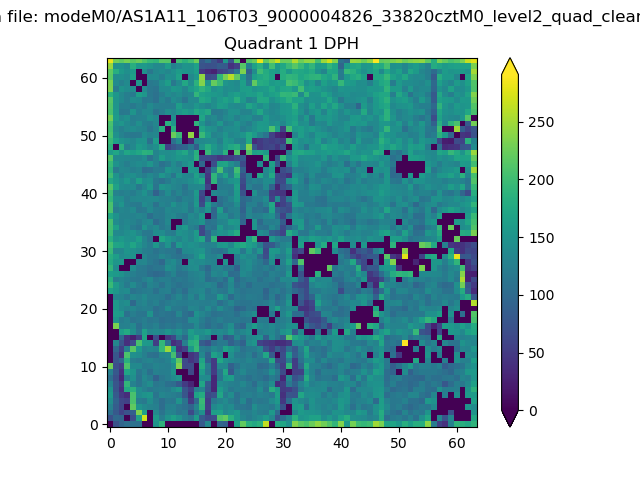 |
Quadrant B |
|---|---|---|---|
| Quadrant D | 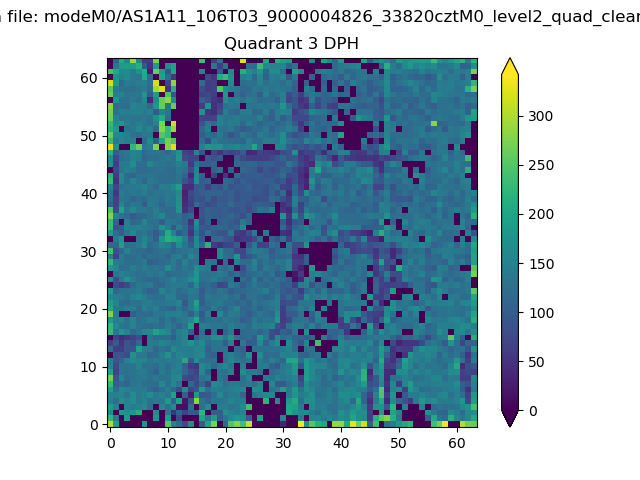 |
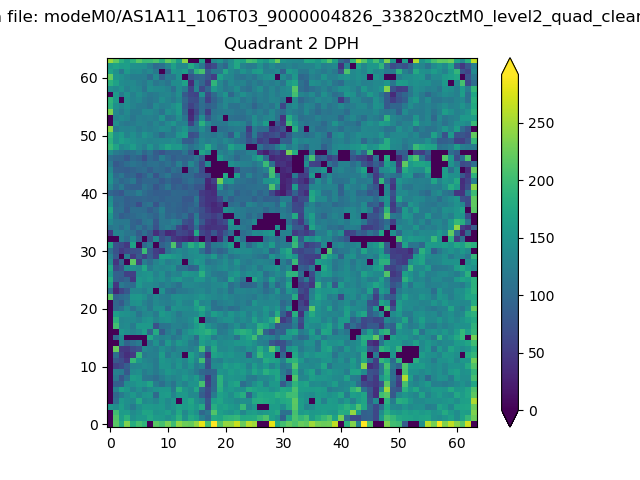 |
Quadrant C |
| Plot type | Count rate plots | Images |
|---|---|---|
| Comparison with Poisson distribution Blue bars denote a histogram of data divided into 1 sec bins. Red curve is a Poisson curve with rate = median count rate of data. |
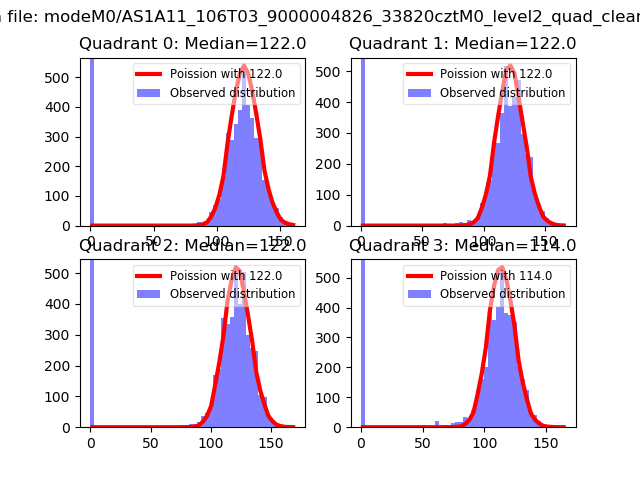 |
 |
| Quadrant-wise count rates Data is divided into 100 sec bins |
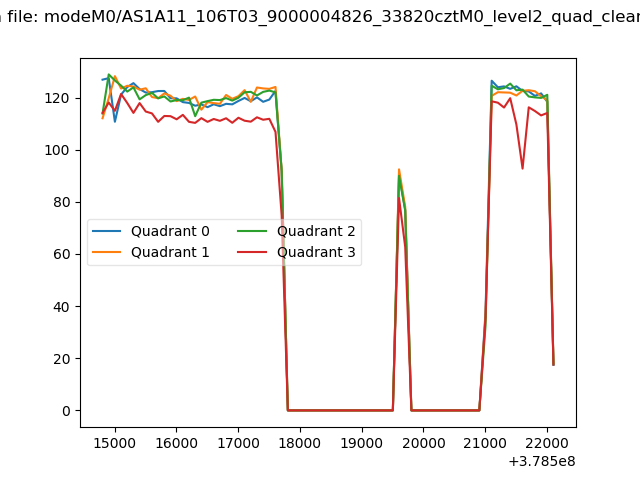 |
|
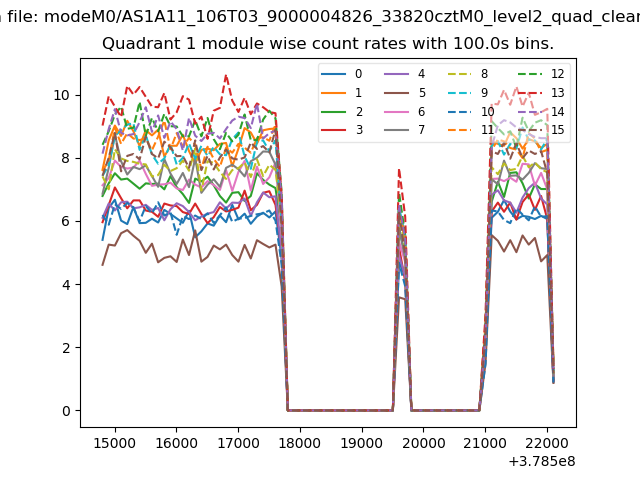
| Module-wise count rates for Quadrant A Data is divided into 100 sec bins |
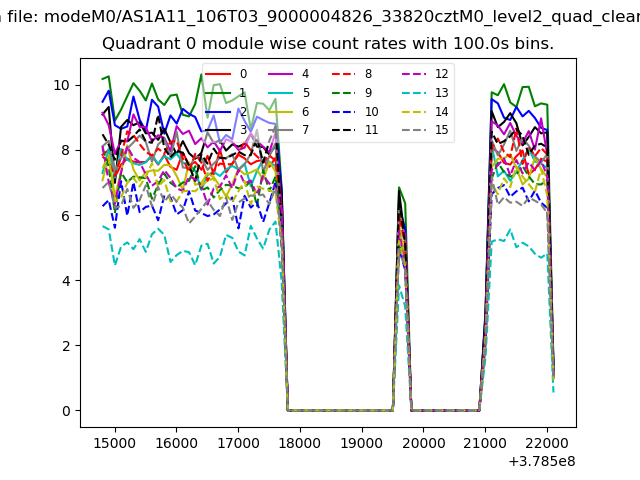 |
 |
| Module-wise count rates for Quadrant B Data is divided into 100 sec bins |
 |
 |
| Module-wise count rates for Quadrant C Data is divided into 100 sec bins |
 |
 |
| Module-wise count rates for Quadrant D Data is divided into 100 sec bins |
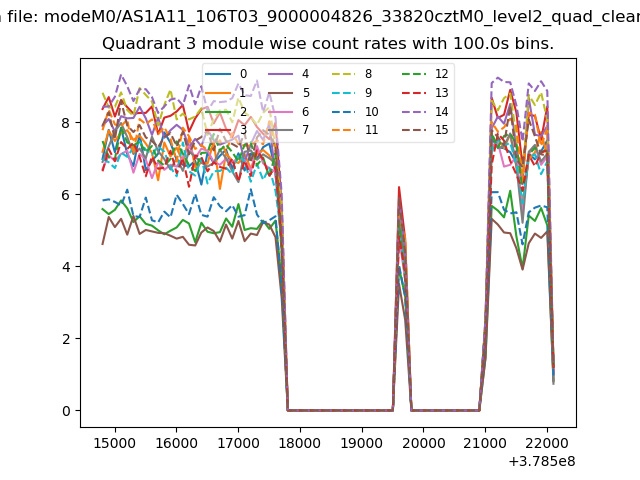 |
 |
| Parameter | Plot |
|---|---|
| CZT HV Monitor |  |
| D_VDD | 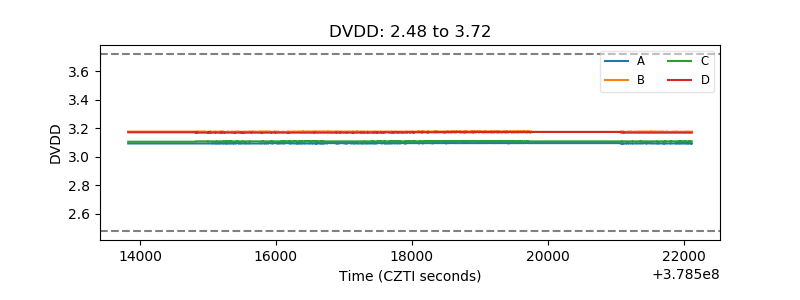 |
| Temperature 1 | 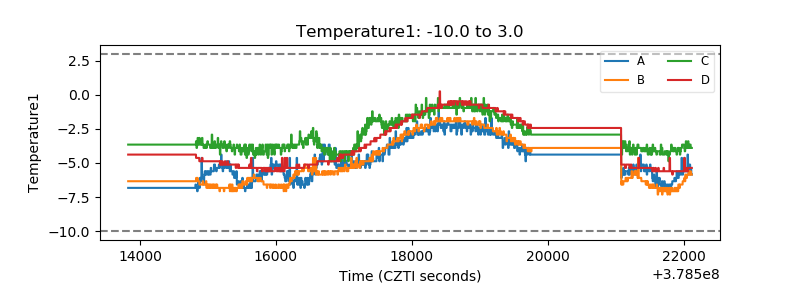 |
| Veto HV Monitor | 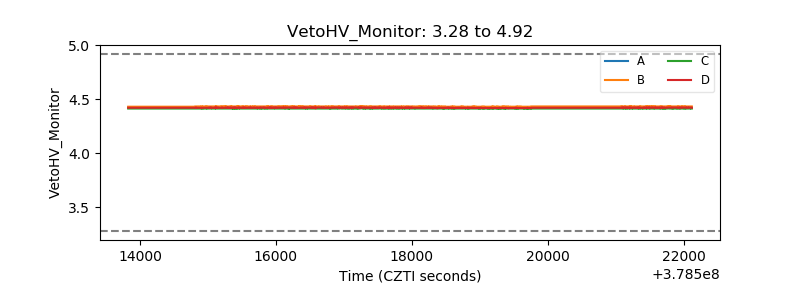 |
| Veto LLD | 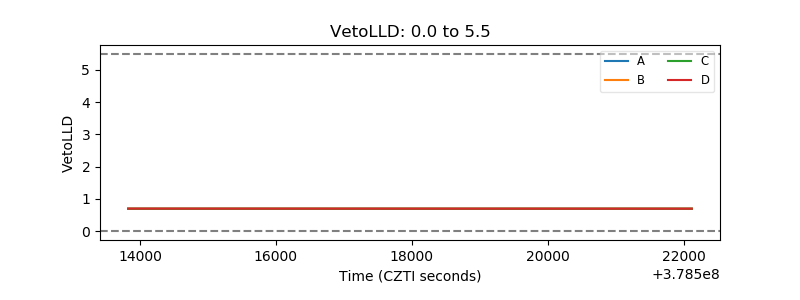 |
| Alpha Counter | 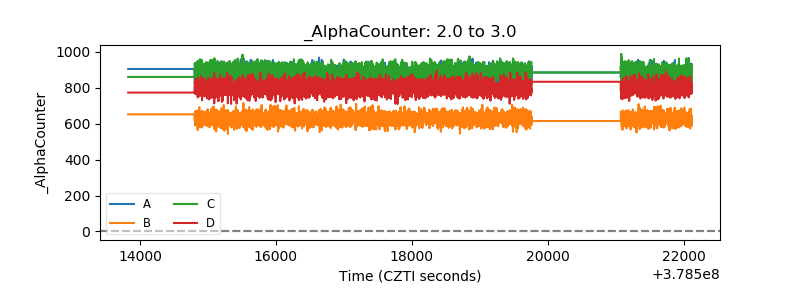 |
| _CPM_Rate | 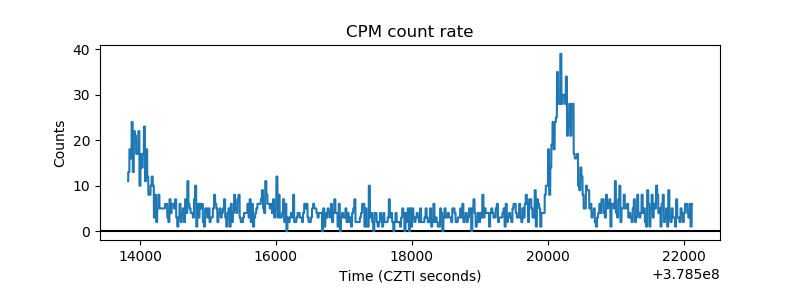 |
| CZT Counter | 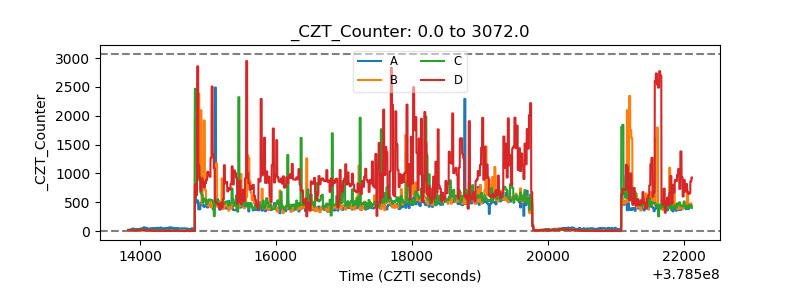 |
| +2.5 Volts monitor |  |
| +5 Volts monitor |  |
| _ROLL_ROT | 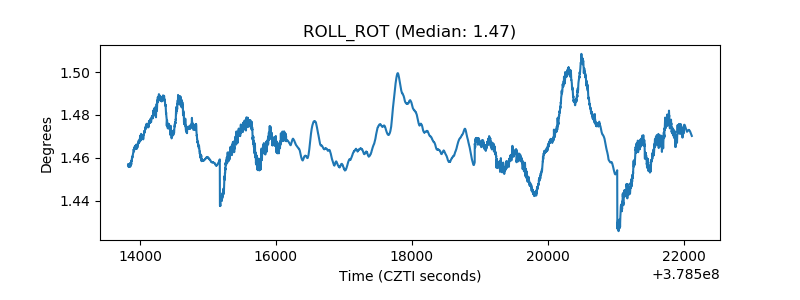 |
| _Roll_DEC | 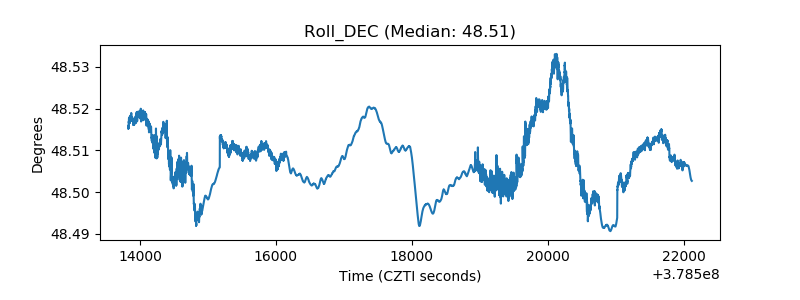 |
| _Roll_RA | 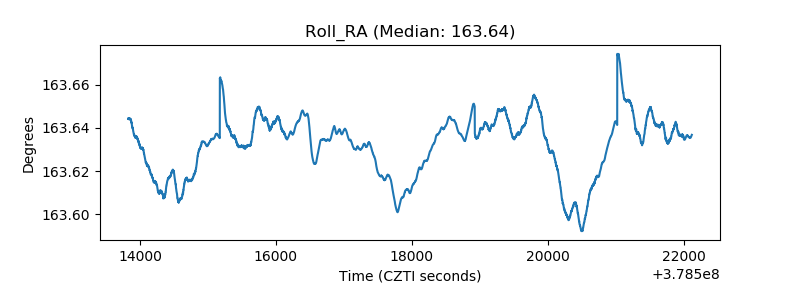 |
| Veto Counter | 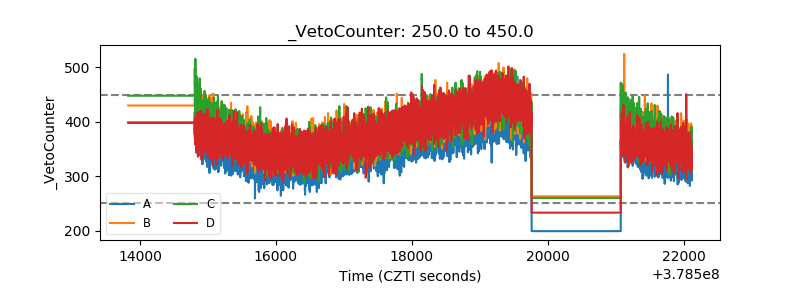 |