| Param | Original file | Final file |
|---|---|---|
| Filename | modeM0/AS1A11_106T03_9000004826_33823cztM0_level2.evt | modeM0/AS1A11_106T03_9000004826_33823cztM0_level2_quad_clean.evt |
| Size (bytes) | 1,349,233,920 | 179,680,320 |
| Size | 1.3 GB | 171.4 MB |
| Events in quadrant A | 8,261,744 | 1,112,795 |
| Events in quadrant B | 8,653,186 | 1,142,281 |
| Events in quadrant C | 8,762,889 | 1,134,569 |
| Events in quadrant D | 14,190,420 | 1,033,801 |
| Mode M9 | |||
|---|---|---|---|
| Quadrant | BADHDUFLAG | Total packets | Discarded packets |
| A | 0 | 44 | 0 |
| B | 0 | 44 | 0 |
| C | 0 | 44 | 0 |
| D | 0 | 44 | 0 |
| Mode SS | |||
|---|---|---|---|
| Quadrant | BADHDUFLAG | Total packets | Discarded packets |
| A | 0 | 302 | 0 |
| B | 0 | 302 | 0 |
| C | 0 | 302 | 0 |
| D | 0 | 302 | 0 |
| Mode M0 | |||
|---|---|---|---|
| Quadrant | BADHDUFLAG | Total packets | Discarded packets |
| A | 0 | 34342 | 4 |
| B | 0 | 35533 | 3 |
| C | 0 | 35328 | 3 |
| D | 0 | 52532 | 3 |
| Quadrant | Total seconds | Saturated seconds | Saturation percentage |
|---|---|---|---|
| A | 14743 | 686 | 4.653056% |
| B | 14743 | 483 | 3.276131% |
| C | 14743 | 139 | 0.942820% |
| D | 14743 | 1026 | 6.959235% |
Noise dominated data is calculated using 1-second bins in cleaned event files. If a bin has >2000 counts, and if more than 50% of those come from <1% of pixels, then it is considered to be noise-dominated and hence unusable.
| Quadrant | # 1 sec bins | Bins with >0 counts | Bins with >2000 counts | High rate bins dominated by noise | Noise dominated (total time) | Noise dominated (detector-on time) | Marked lightcurve |
|---|---|---|---|---|---|---|---|
| A | 19161 | 14746 | 646 | 646 | 3.37% | 4.38% | 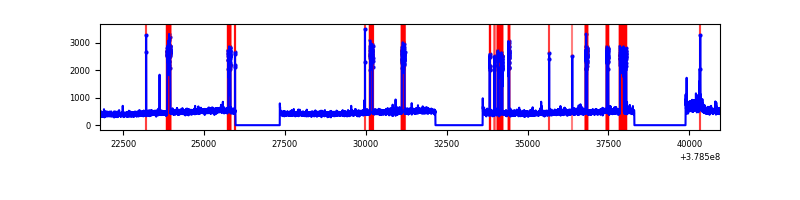 |
| B | 19161 | 14746 | 302 | 302 | 1.58% | 2.05% | 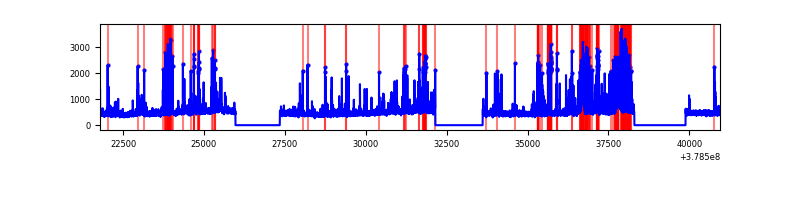 |
| C | 19161 | 14746 | 118 | 118 | 0.62% | 0.80% | 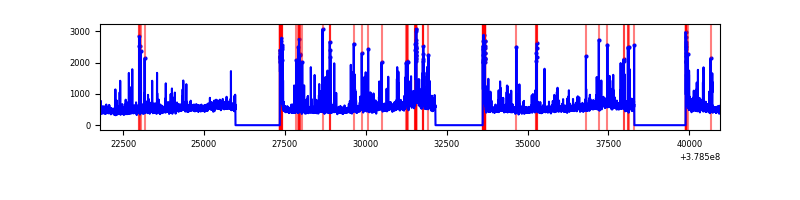 |
| D | 19161 | 14746 | 860 | 860 | 4.49% | 5.83% | 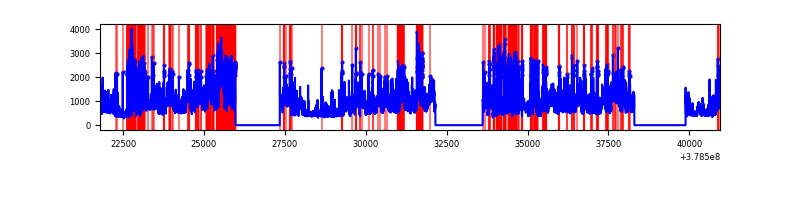 |
Top three noisy pixels from each quadrant. If the there are fewer than three noisy pixels in the level2.evt file, extra rows are filled as -1
| Pixel properties | Quadrant properties | ||||||
|---|---|---|---|---|---|---|---|
| Quadrant | DetID | PixID | Counts | Sigma | Mean | Median | Sigma |
| A | 15 | 169 | 1755170 | 5281.59 | 1670 | 1637 | 332.0 |
| A | 13 | 6 | 42182 | 122.12 | 1670 | 1637 | 332.0 |
| A | 13 | 254 | 25158 | 70.84 | 1670 | 1637 | 332.0 |
| B | 5 | 172 | 1243303 | 3875.01 | 1681 | 1633 | 320.4 |
| B | 5 | 255 | 349799 | 1086.56 | 1681 | 1633 | 320.4 |
| B | 0 | 190 | 83088 | 254.21 | 1681 | 1633 | 320.4 |
| C | 3 | 233 | 856820 | 2256.16 | 1650 | 1661 | 379.0 |
| C | 15 | 214 | 633455 | 1666.85 | 1650 | 1661 | 379.0 |
| C | 14 | 254 | 407176 | 1069.87 | 1650 | 1661 | 379.0 |
| D | 8 | 195 | 3175276 | 7963.6 | 1624 | 1579 | 398.5 |
| D | 12 | 235 | 1656045 | 4151.47 | 1624 | 1579 | 398.5 |
| D | 2 | 250 | 1049065 | 2628.41 | 1624 | 1579 | 398.5 |
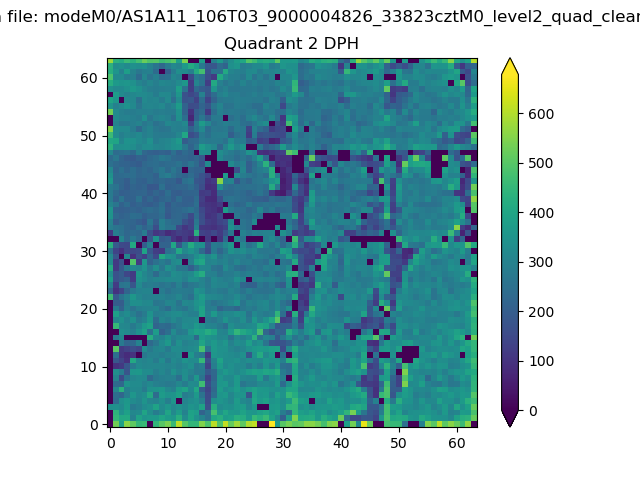
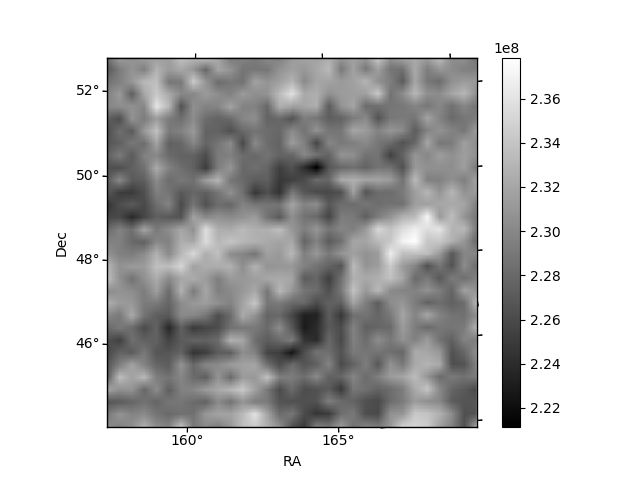
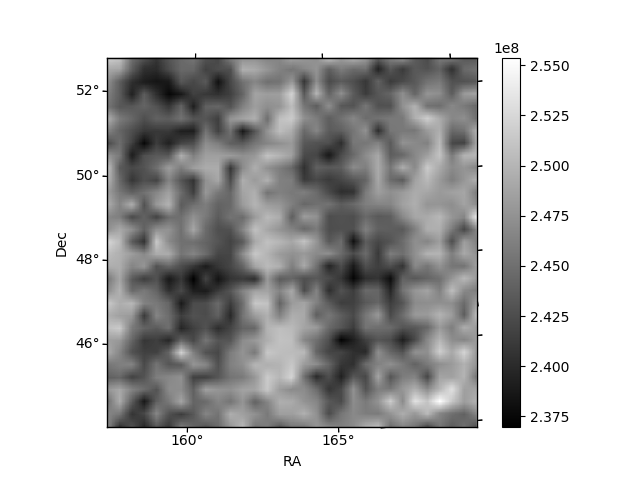
Histogram calculated using DETX and DETY for each event in the final _common_clean file
| Quadrant A | 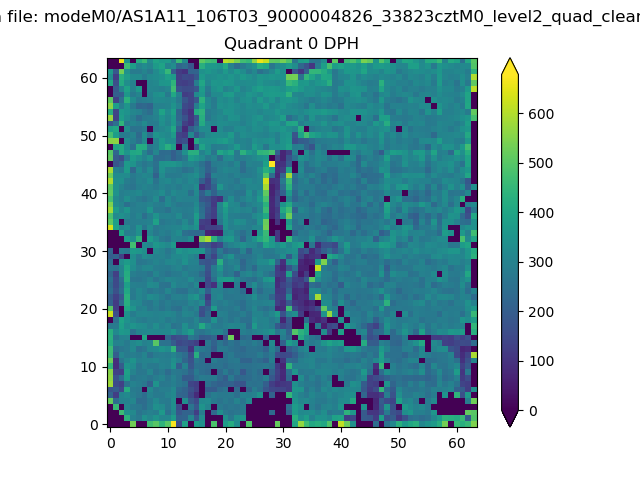 |
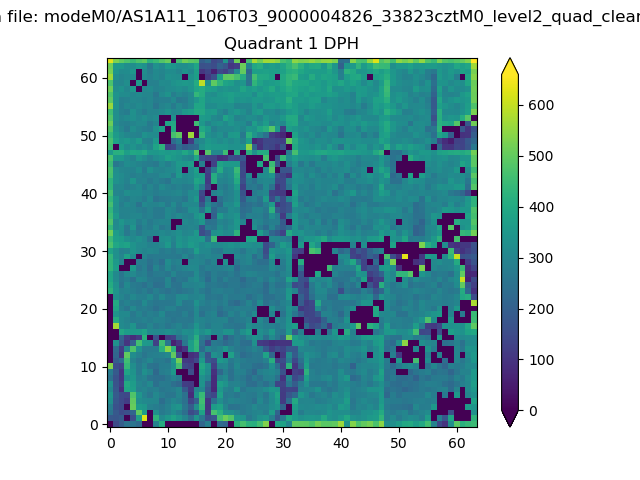 |
Quadrant B |
|---|---|---|---|
| Quadrant D | 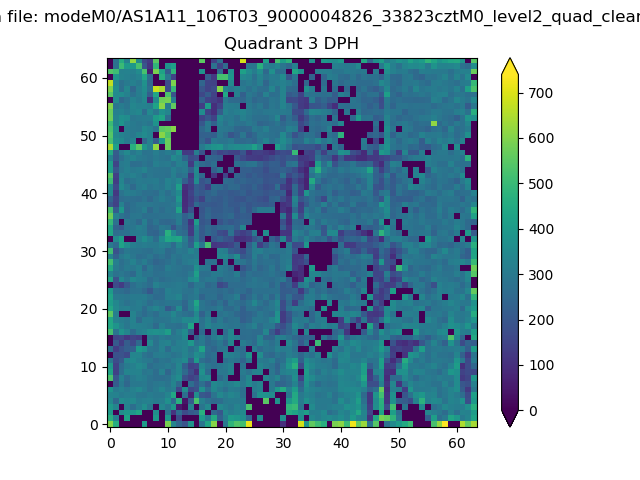 |
 |
Quadrant C |
| Plot type | Count rate plots | Images |
|---|---|---|
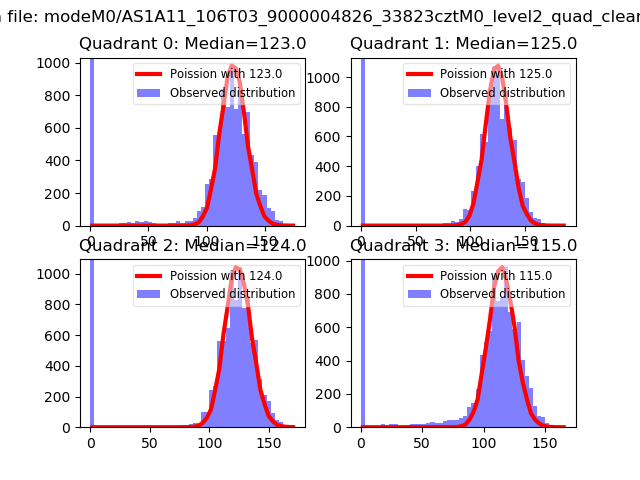
| Comparison with Poisson distribution Blue bars denote a histogram of data divided into 1 sec bins. Red curve is a Poisson curve with rate = median count rate of data. |
 |
 |
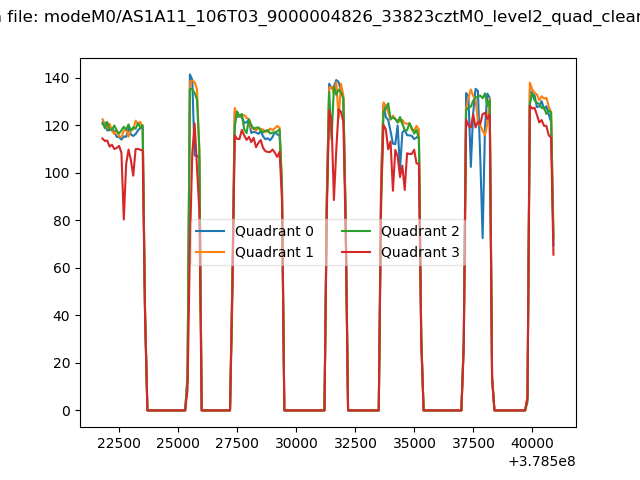
| Quadrant-wise count rates Data is divided into 100 sec bins |
 |
|
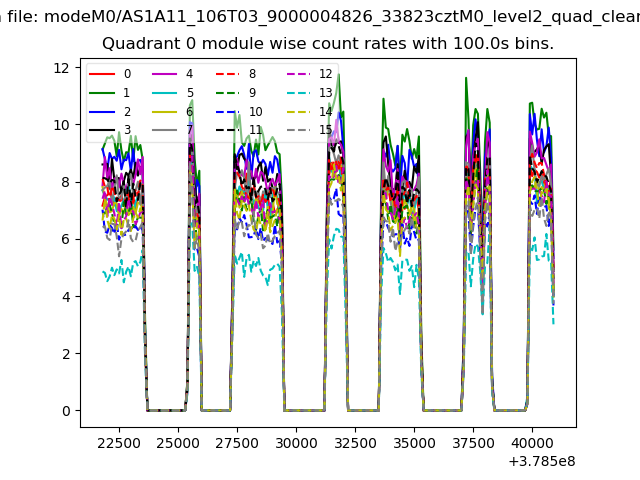
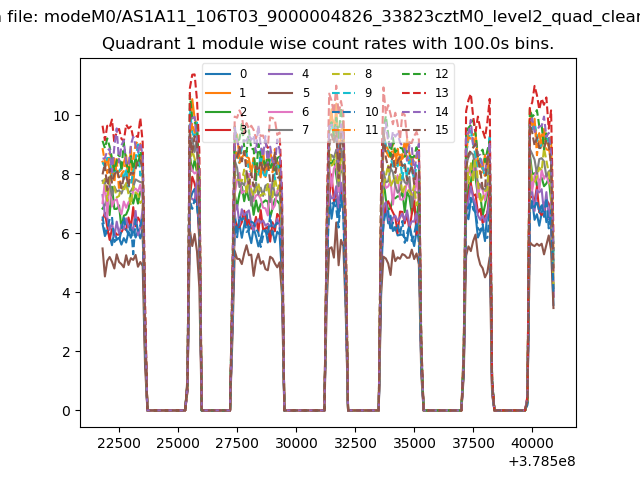
| Module-wise count rates for Quadrant A Data is divided into 100 sec bins |
 |
 |
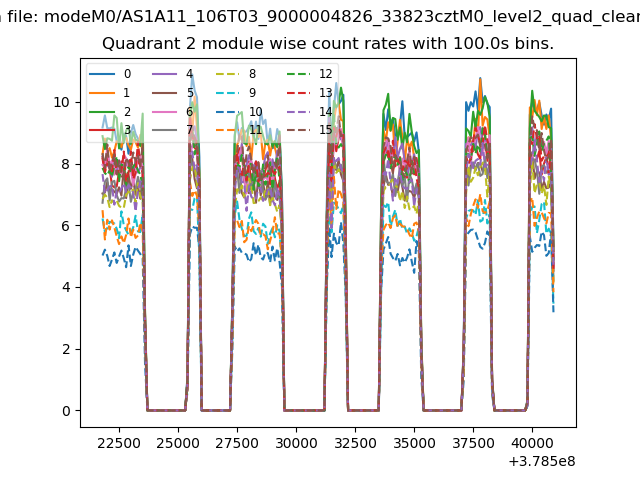
| Module-wise count rates for Quadrant B Data is divided into 100 sec bins |
 |
 |
| Module-wise count rates for Quadrant C Data is divided into 100 sec bins |
 |
 |
| Module-wise count rates for Quadrant D Data is divided into 100 sec bins |
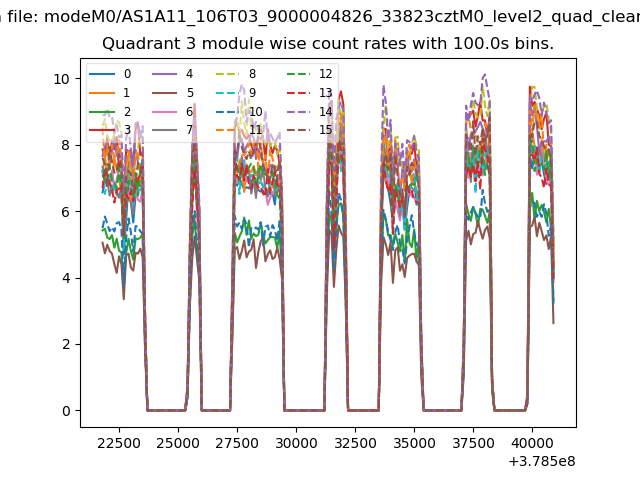 |
 |
| Parameter | Plot |
|---|---|
| CZT HV Monitor | 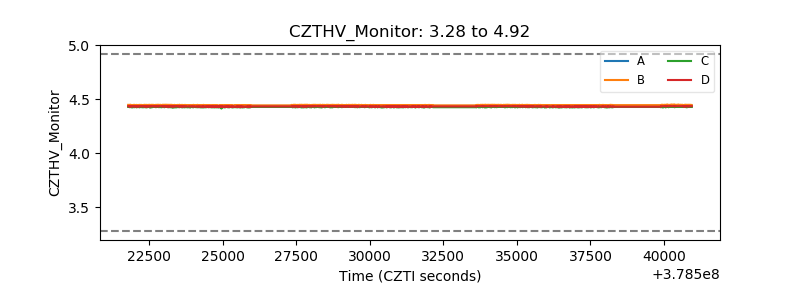 |
| D_VDD | 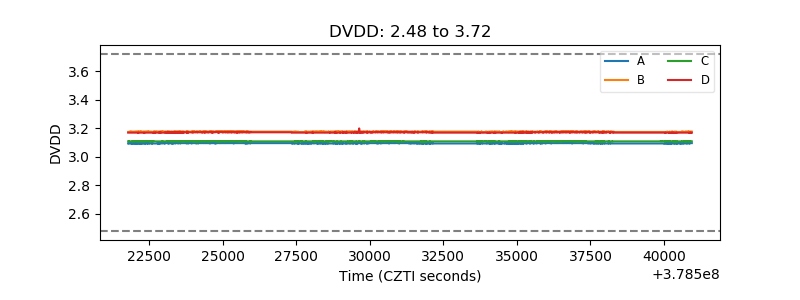 |
| Temperature 1 |  |
| Veto HV Monitor | 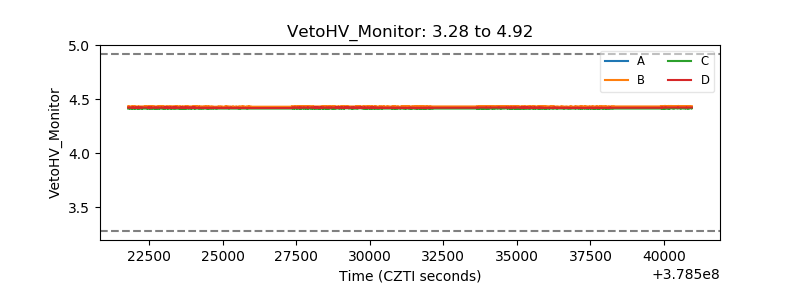 |
| Veto LLD | 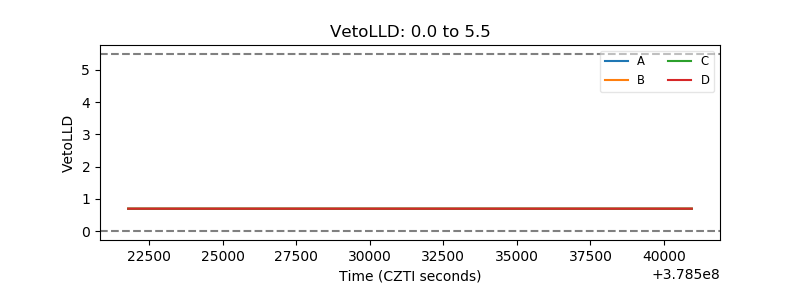 |
| Alpha Counter | 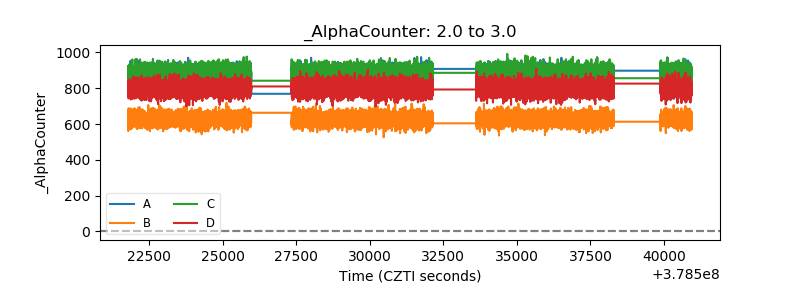 |
| _CPM_Rate | 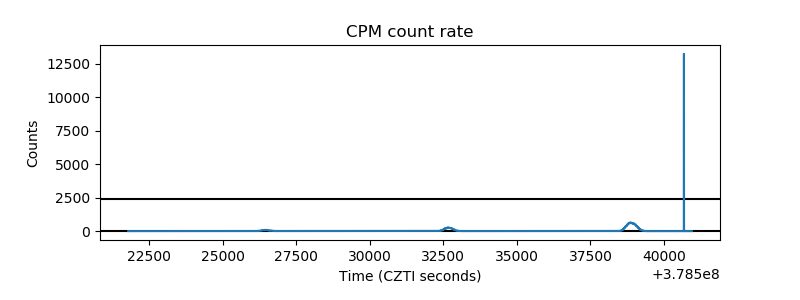 |
| CZT Counter | 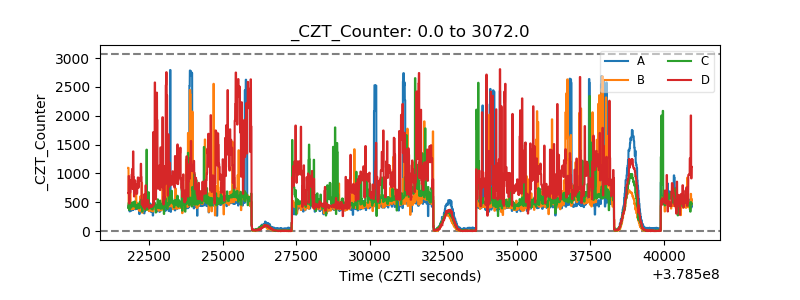 |
| +2.5 Volts monitor |  |
| +5 Volts monitor | 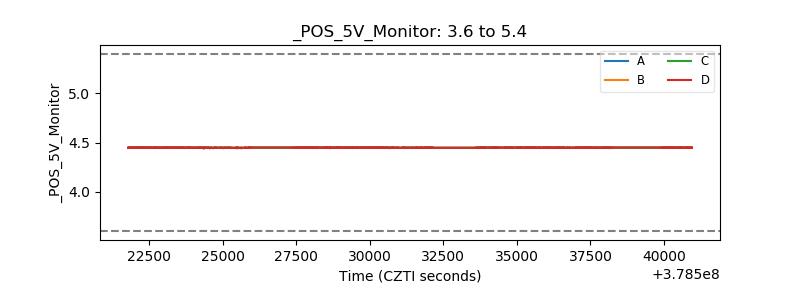 |
| _ROLL_ROT | 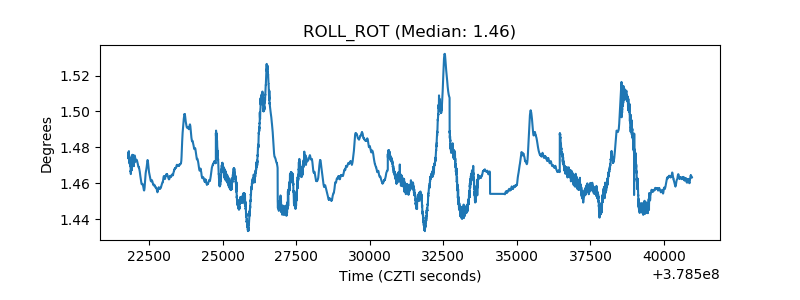 |
| _Roll_DEC | 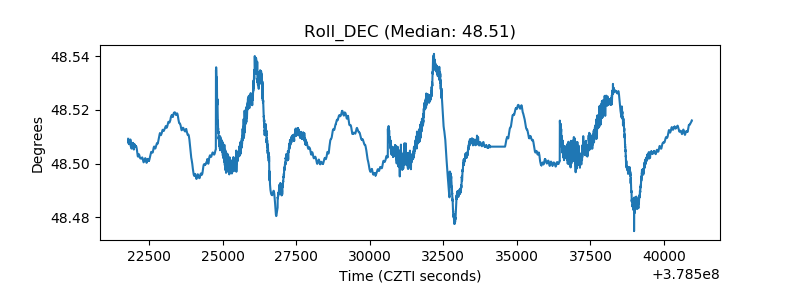 |
| _Roll_RA | 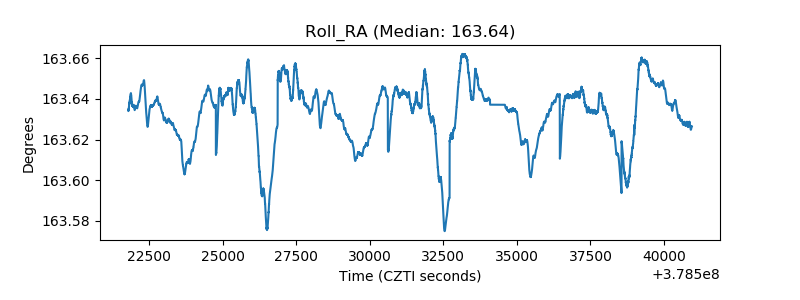 |
| Veto Counter | 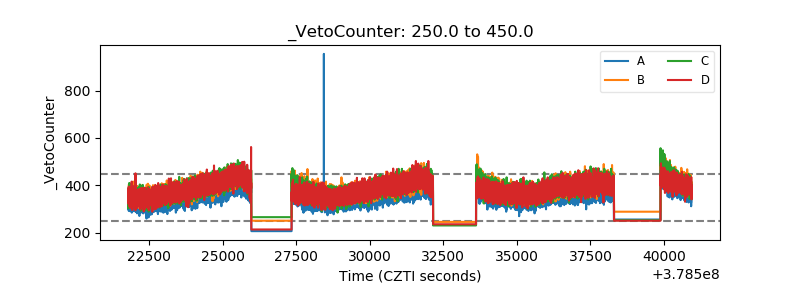 |