| Param | Original file | Final file |
|---|---|---|
| Filename | modeM0/AS1A11_106T03_9000004826_33824cztM0_level2.evt | modeM0/AS1A11_106T03_9000004826_33824cztM0_level2_quad_clean.evt |
| Size (bytes) | 503,694,720 | 73,529,280 |
| Size | 480.4 MB | 70.1 MB |
| Events in quadrant A | 3,136,500 | 473,061 |
| Events in quadrant B | 3,048,128 | 474,124 |
| Events in quadrant C | 3,486,045 | 467,626 |
| Events in quadrant D | 5,214,177 | 429,565 |
| Mode M9 | |||
|---|---|---|---|
| Quadrant | BADHDUFLAG | Total packets | Discarded packets |
| A | 0 | 24 | 0 |
| B | 0 | 24 | 0 |
| C | 0 | 24 | 0 |
| D | 0 | 25 | 0 |
| Mode SS | |||
|---|---|---|---|
| Quadrant | BADHDUFLAG | Total packets | Discarded packets |
| A | 0 | 112 | 0 |
| B | 0 | 112 | 0 |
| C | 0 | 112 | 0 |
| D | 0 | 112 | 0 |
| Mode M0 | |||
|---|---|---|---|
| Quadrant | BADHDUFLAG | Total packets | Discarded packets |
| A | 0 | 12585 | 3 |
| B | 0 | 12445 | 2 |
| C | 0 | 13946 | 2 |
| D | 0 | 19287 | 2 |
| Quadrant | Total seconds | Saturated seconds | Saturation percentage |
|---|---|---|---|
| A | 5454 | 116 | 2.126879% |
| B | 5454 | 122 | 2.236890% |
| C | 5454 | 57 | 1.045105% |
| D | 5454 | 278 | 5.097176% |
Noise dominated data is calculated using 1-second bins in cleaned event files. If a bin has >2000 counts, and if more than 50% of those come from <1% of pixels, then it is considered to be noise-dominated and hence unusable.
| Quadrant | # 1 sec bins | Bins with >0 counts | Bins with >2000 counts | High rate bins dominated by noise | Noise dominated (total time) | Noise dominated (detector-on time) | Marked lightcurve |
|---|---|---|---|---|---|---|---|
| A | 7158 | 5455 | 97 | 97 | 1.36% | 1.78% | 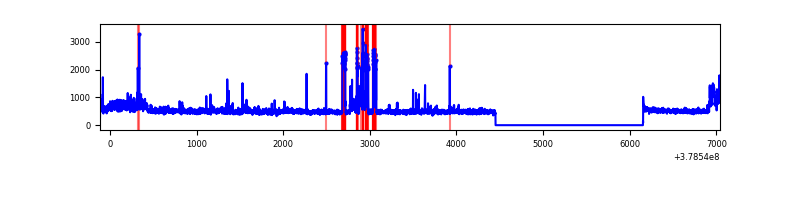 |
| B | 7158 | 5455 | 72 | 72 | 1.01% | 1.32% | 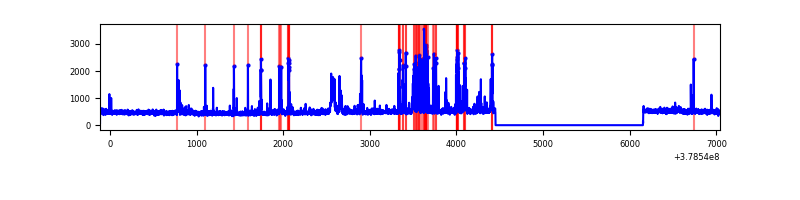 |
| C | 7158 | 5455 | 51 | 51 | 0.71% | 0.93% | 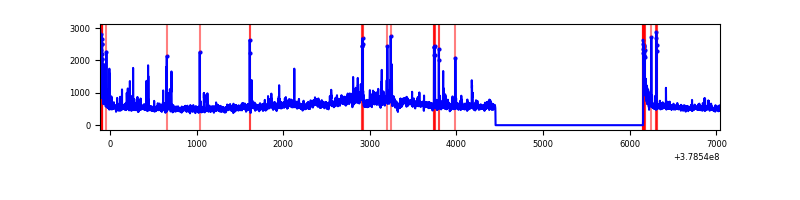 |
| D | 7158 | 5455 | 263 | 263 | 3.67% | 4.82% |  |
Top three noisy pixels from each quadrant. If the there are fewer than three noisy pixels in the level2.evt file, extra rows are filled as -1
| Pixel properties | Quadrant properties | ||||||
|---|---|---|---|---|---|---|---|
| Quadrant | DetID | PixID | Counts | Sigma | Mean | Median | Sigma |
| A | 15 | 169 | 620817 | 4784.27 | 643 | 631 | 129.6 |
| A | 13 | 6 | 14696 | 108.5 | 643 | 631 | 129.6 |
| A | 10 | 83 | 10473 | 75.92 | 643 | 631 | 129.6 |
| B | 5 | 172 | 375391 | 3032.48 | 637 | 620 | 123.6 |
| B | 0 | 213 | 54652 | 437.2 | 637 | 620 | 123.6 |
| B | 5 | 255 | 29336 | 232.36 | 637 | 620 | 123.6 |
| C | 3 | 233 | 504428 | 3520.75 | 623 | 627 | 143.1 |
| C | 15 | 214 | 240568 | 1676.8 | 623 | 627 | 143.1 |
| C | 0 | 10 | 113558 | 789.2 | 623 | 627 | 143.1 |
| D | 8 | 195 | 1310180 | 8602.69 | 618 | 600 | 152.2 |
| D | 1 | 47 | 404359 | 2652.31 | 618 | 600 | 152.2 |
| D | 12 | 235 | 283578 | 1858.89 | 618 | 600 | 152.2 |
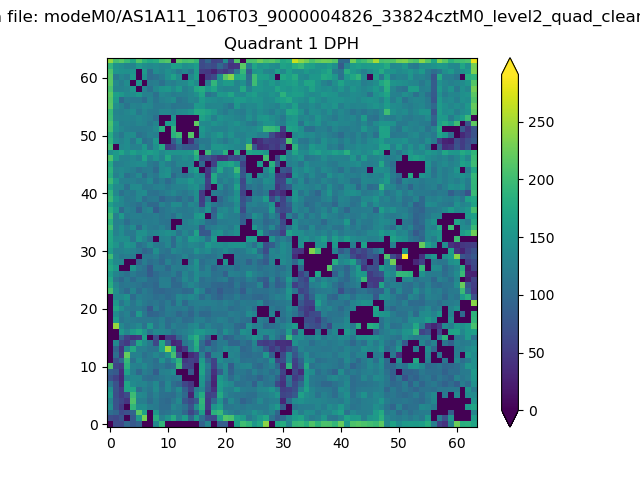
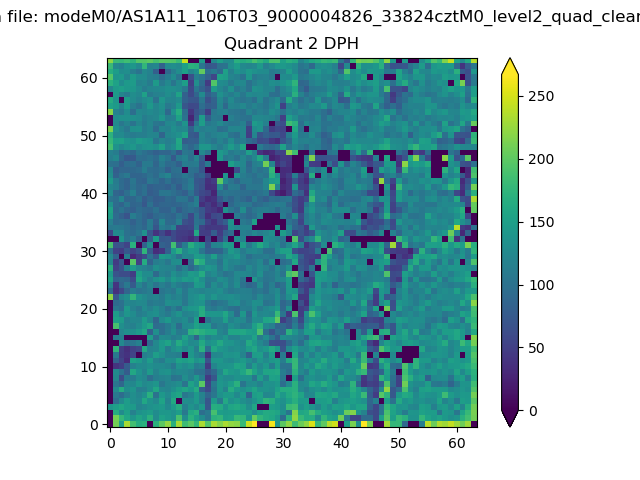
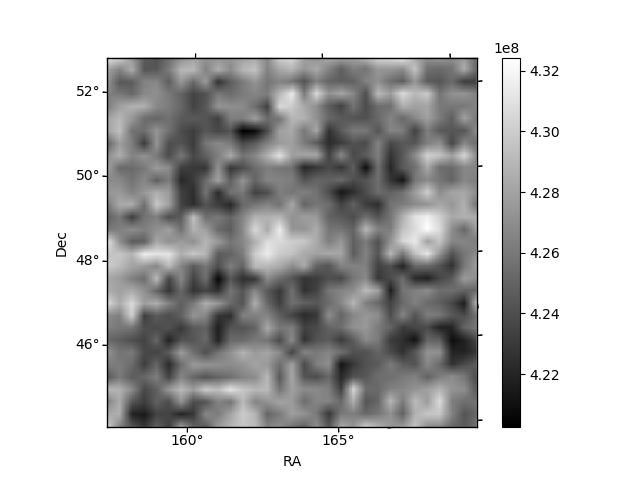
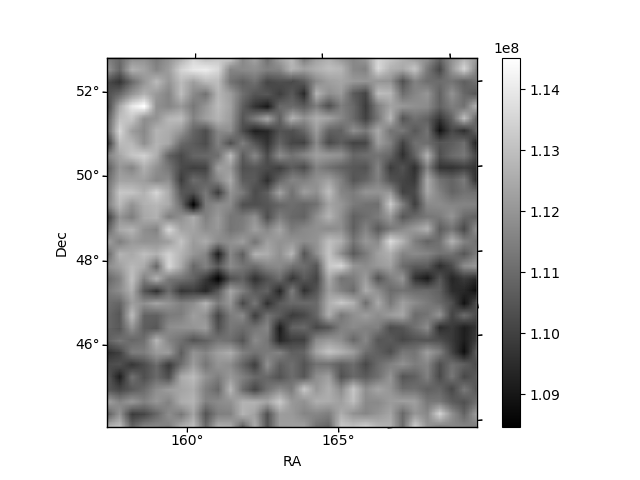
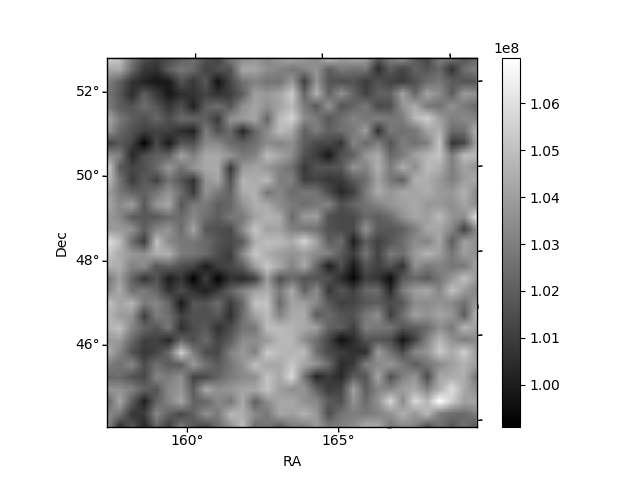
Histogram calculated using DETX and DETY for each event in the final _common_clean file
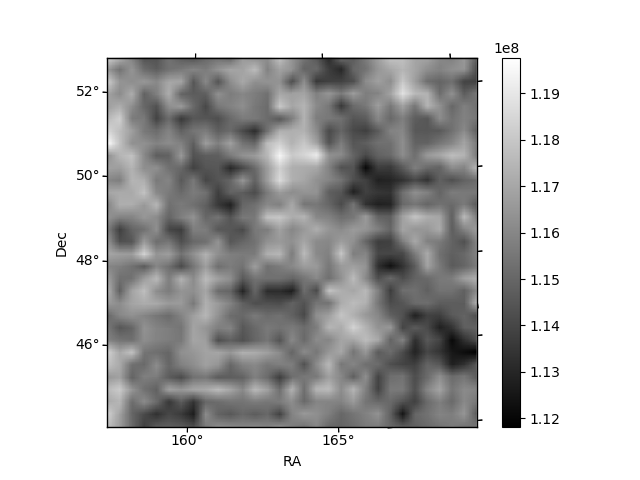
| Quadrant A | 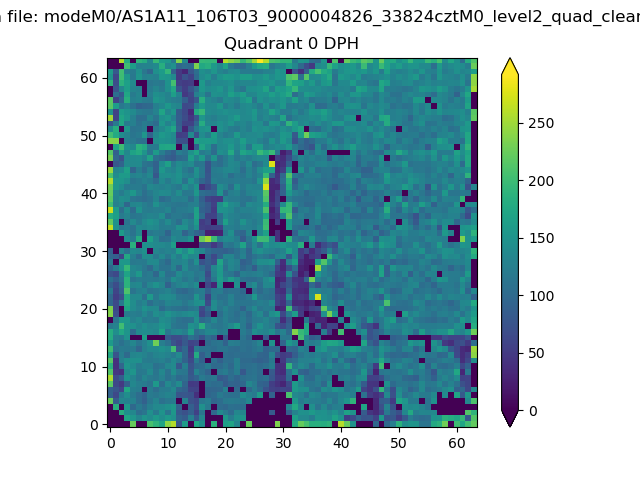 |
 |
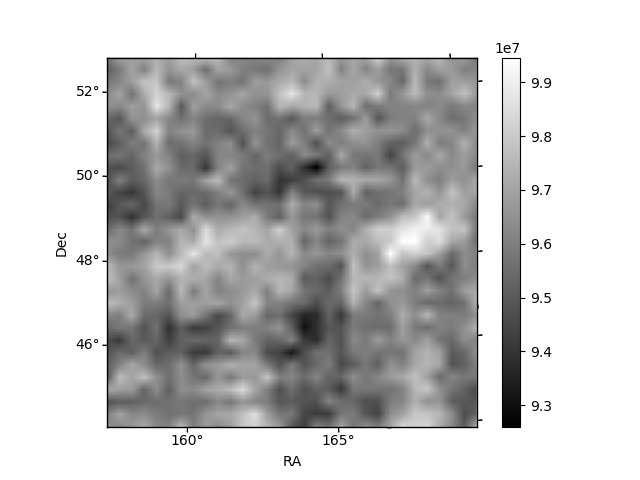
Quadrant B |
|---|---|---|---|
| Quadrant D | 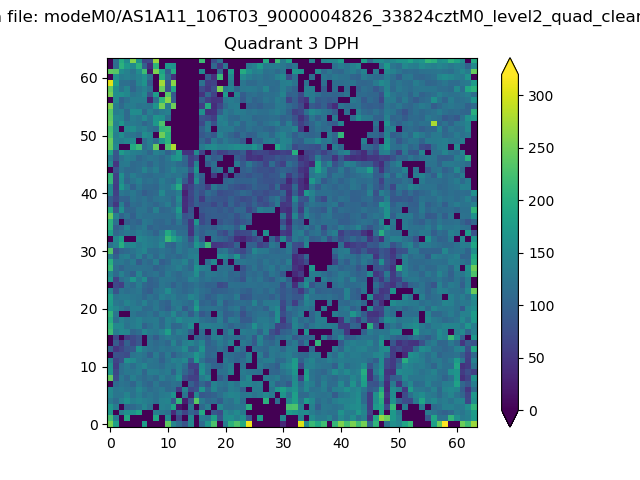 |
 |
Quadrant C |
| Plot type | Count rate plots | Images |
|---|---|---|
| Comparison with Poisson distribution Blue bars denote a histogram of data divided into 1 sec bins. Red curve is a Poisson curve with rate = median count rate of data. |
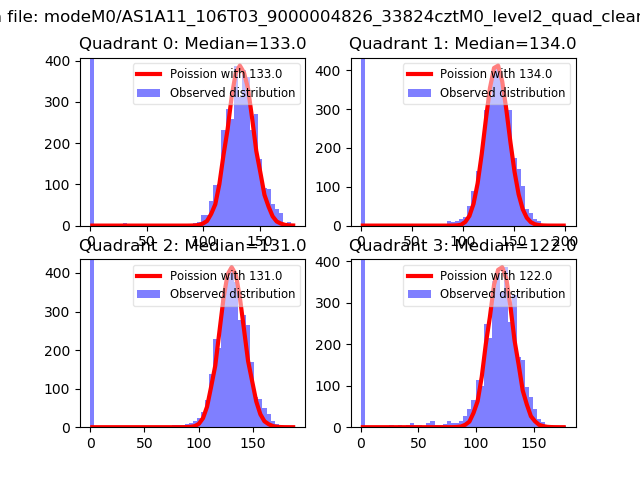 |
 |
| Quadrant-wise count rates Data is divided into 100 sec bins |
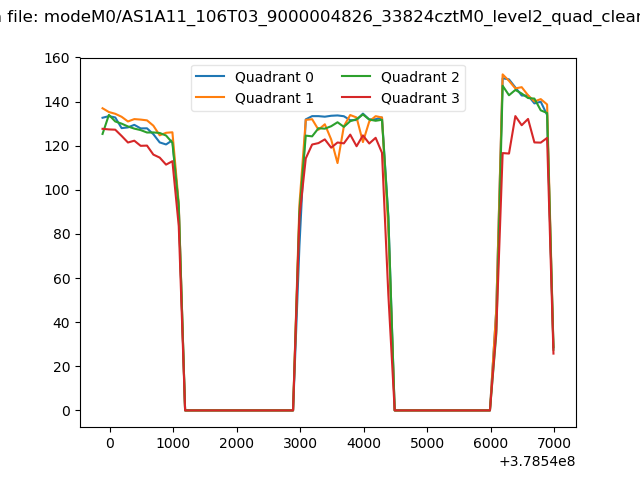 |
|
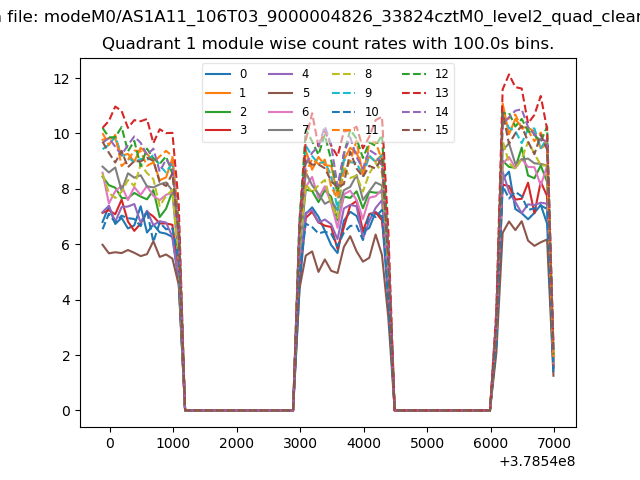
| Module-wise count rates for Quadrant A Data is divided into 100 sec bins |
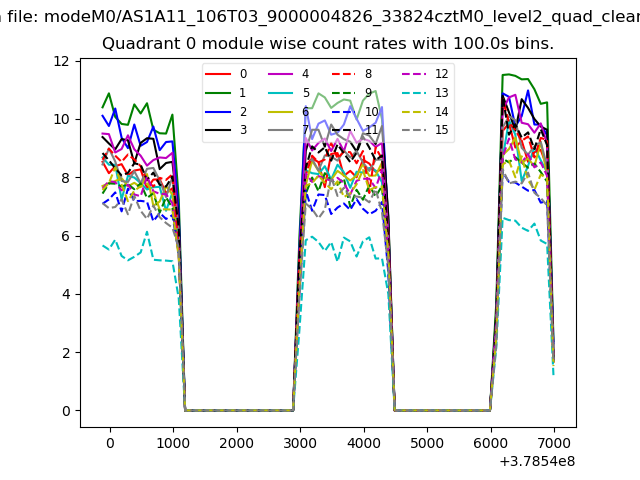 |
 |
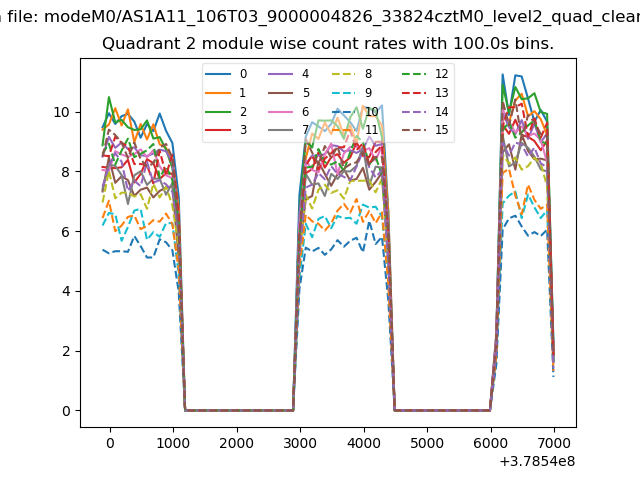
| Module-wise count rates for Quadrant B Data is divided into 100 sec bins |
 |
 |
| Module-wise count rates for Quadrant C Data is divided into 100 sec bins |
 |
 |
| Module-wise count rates for Quadrant D Data is divided into 100 sec bins |
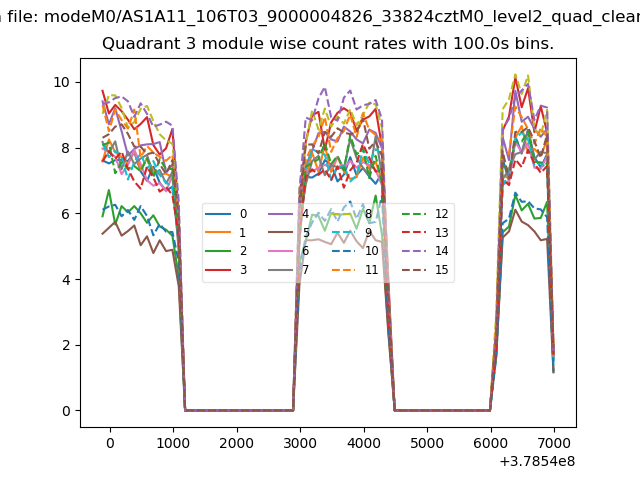 |
 |
| Parameter | Plot |
|---|---|
| CZT HV Monitor | 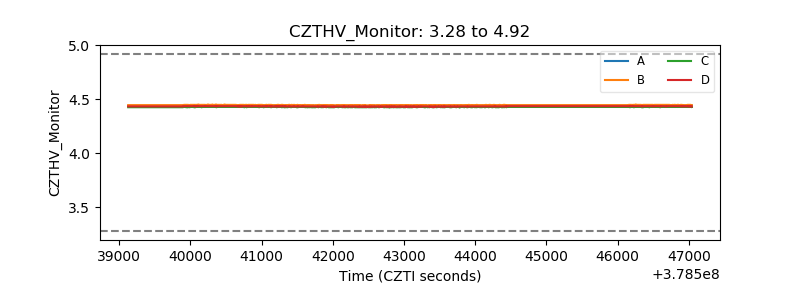 |
| D_VDD | 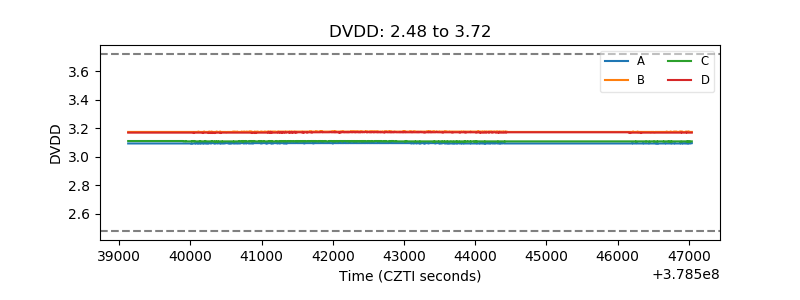 |
| Temperature 1 | 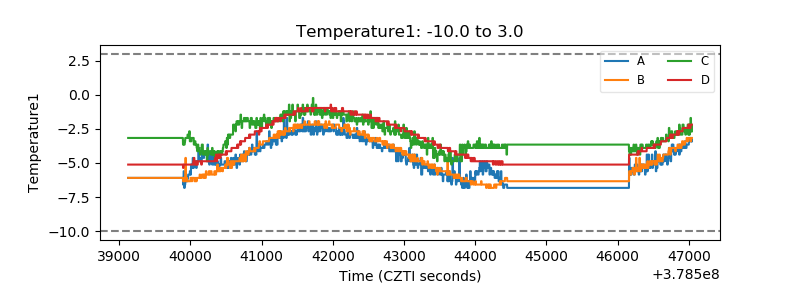 |
| Veto HV Monitor |  |
| Veto LLD | 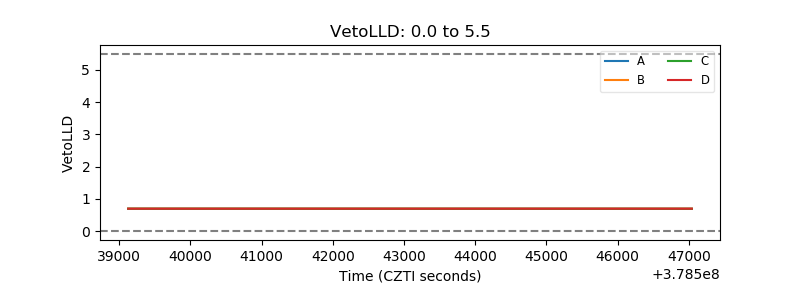 |
| Alpha Counter | 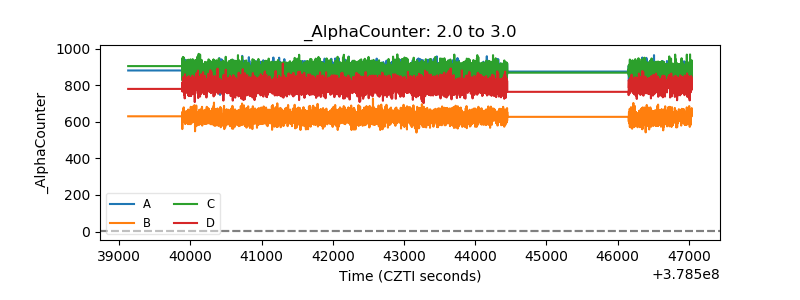 |
| _CPM_Rate | 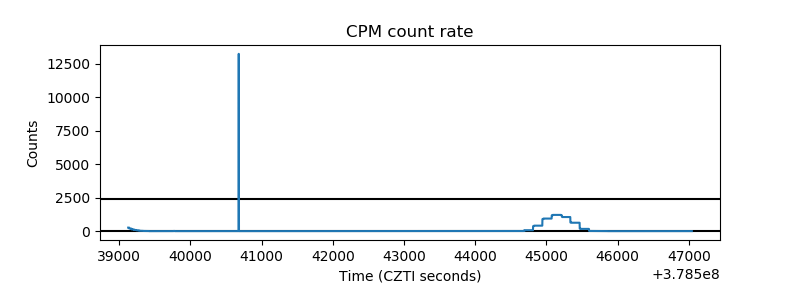 |
| CZT Counter | 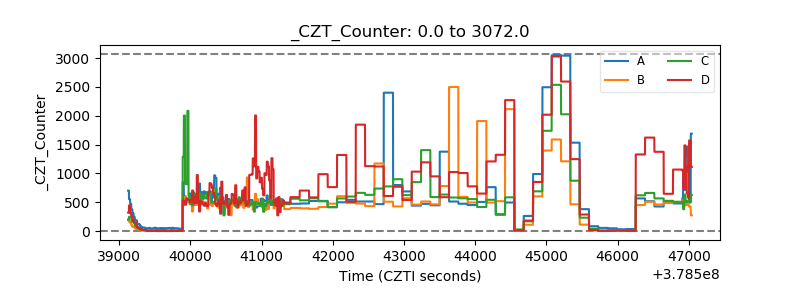 |
| +2.5 Volts monitor |  |
| +5 Volts monitor |  |
| _ROLL_ROT | 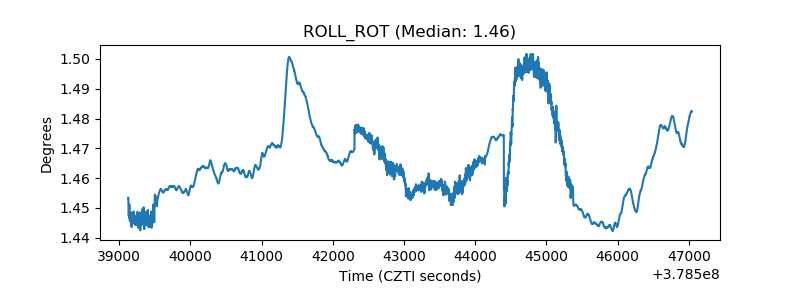 |
| _Roll_DEC |  |
| _Roll_RA | 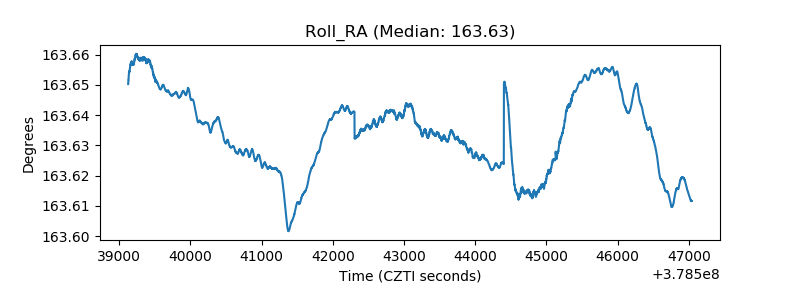 |
| Veto Counter | 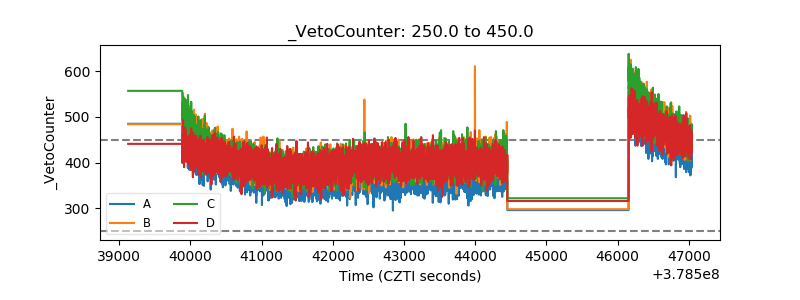 |