| Param | Original file | Final file |
|---|---|---|
| Filename | modeM0/AS1A11_106T03_9000004826_33827cztM0_level2.evt | modeM0/AS1A11_106T03_9000004826_33827cztM0_level2_quad_clean.evt |
| Size (bytes) | 2,633,495,040 | 327,816,000 |
| Size | 2.5 GB | 312.6 MB |
| Events in quadrant A | 15,381,648 | 2,043,289 |
| Events in quadrant B | 18,455,884 | 2,032,111 |
| Events in quadrant C | 17,194,879 | 2,042,232 |
| Events in quadrant D | 26,834,660 | 1,878,060 |
| Mode M9 | |||
|---|---|---|---|
| Quadrant | BADHDUFLAG | Total packets | Discarded packets |
| A | 0 | 99 | 0 |
| B | 0 | 99 | 0 |
| C | 0 | 99 | 0 |
| D | 0 | 99 | 0 |
| Mode SS | |||
|---|---|---|---|
| Quadrant | BADHDUFLAG | Total packets | Discarded packets |
| A | 0 | 574 | 0 |
| B | 0 | 574 | 0 |
| C | 0 | 574 | 0 |
| D | 0 | 574 | 0 |
| Mode M0 | |||
|---|---|---|---|
| Quadrant | BADHDUFLAG | Total packets | Discarded packets |
| A | 0 | 63452 | 7 |
| B | 0 | 72981 | 6 |
| C | 0 | 68700 | 6 |
| D | 0 | 99564 | 6 |
| Quadrant | Total seconds | Saturated seconds | Saturation percentage |
|---|---|---|---|
| A | 28102 | 805 | 2.864565% |
| B | 28102 | 1576 | 5.608142% |
| C | 28102 | 305 | 1.085332% |
| D | 28102 | 1668 | 5.935521% |
Noise dominated data is calculated using 1-second bins in cleaned event files. If a bin has >2000 counts, and if more than 50% of those come from <1% of pixels, then it is considered to be noise-dominated and hence unusable.
| Quadrant | # 1 sec bins | Bins with >0 counts | Bins with >2000 counts | High rate bins dominated by noise | Noise dominated (total time) | Noise dominated (detector-on time) | Marked lightcurve |
|---|---|---|---|---|---|---|---|
| A | 37990 | 28108 | 743 | 743 | 1.96% | 2.64% | 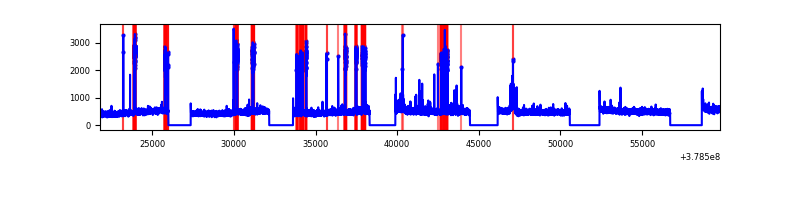 |
| B | 37990 | 28107 | 1047 | 1047 | 2.76% | 3.73% | 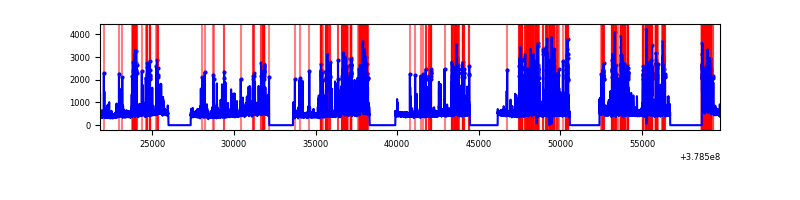 |
| C | 37990 | 28108 | 250 | 250 | 0.66% | 0.89% | 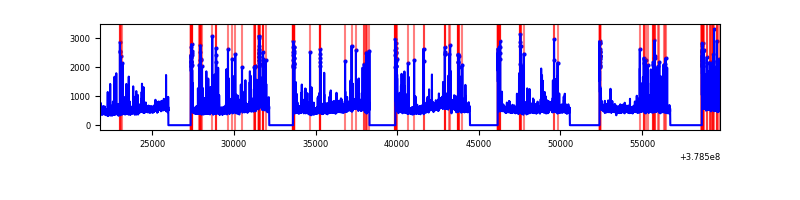 |
| D | 37990 | 28108 | 1429 | 1429 | 3.76% | 5.08% | 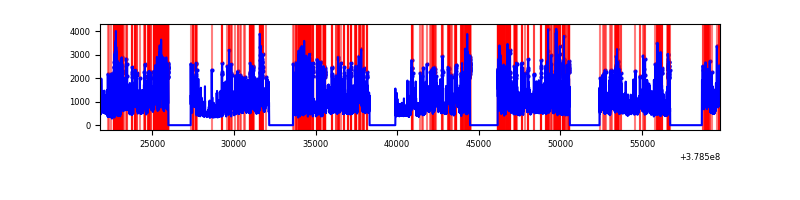 |
Top three noisy pixels from each quadrant. If the there are fewer than three noisy pixels in the level2.evt file, extra rows are filled as -1
| Pixel properties | Quadrant properties | ||||||
|---|---|---|---|---|---|---|---|
| Quadrant | DetID | PixID | Counts | Sigma | Mean | Median | Sigma |
| A | 15 | 169 | 2431652 | 3714.41 | 3320 | 3261 | 653.8 |
| A | 13 | 6 | 77659 | 113.8 | 3320 | 3261 | 653.8 |
| A | 13 | 254 | 46922 | 66.78 | 3320 | 3261 | 653.8 |
| B | 5 | 172 | 3894456 | 6314.37 | 3258 | 3173 | 616.3 |
| B | 5 | 255 | 986826 | 1596.17 | 3258 | 3173 | 616.3 |
| B | 0 | 213 | 168378 | 268.08 | 3258 | 3173 | 616.3 |
| C | 3 | 233 | 1551635 | 2106.65 | 3242 | 3268 | 735.0 |
| C | 15 | 214 | 1205191 | 1635.29 | 3242 | 3268 | 735.0 |
| C | 14 | 254 | 888410 | 1204.29 | 3242 | 3268 | 735.0 |
| D | 8 | 195 | 6038448 | 7652.49 | 3217 | 3125 | 788.7 |
| D | 12 | 235 | 2221610 | 2812.93 | 3217 | 3125 | 788.7 |
| D | 1 | 47 | 1593740 | 2016.82 | 3217 | 3125 | 788.7 |
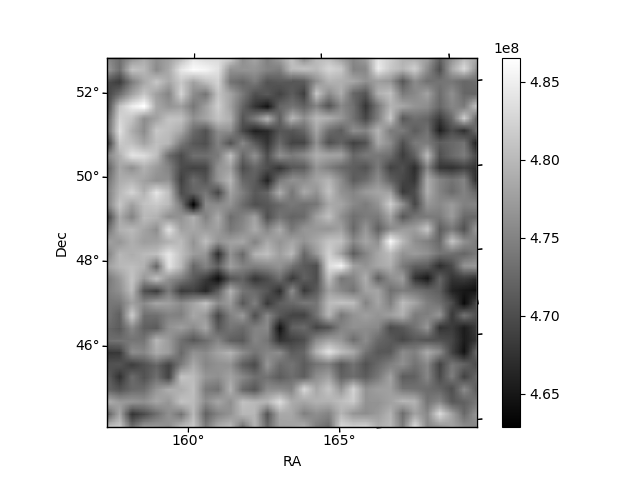
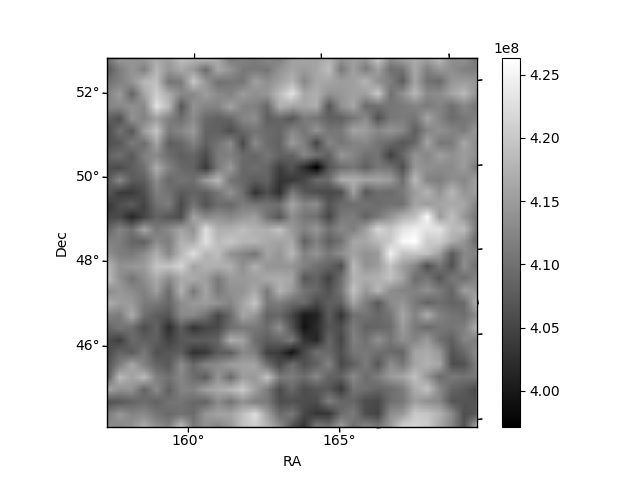
Histogram calculated using DETX and DETY for each event in the final _common_clean file
| Quadrant A | 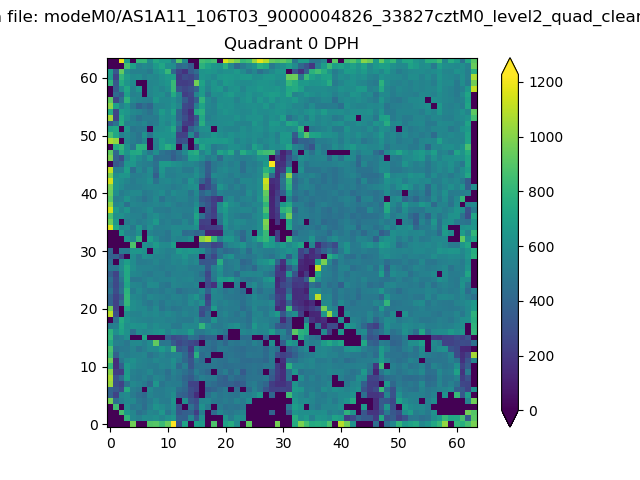 |
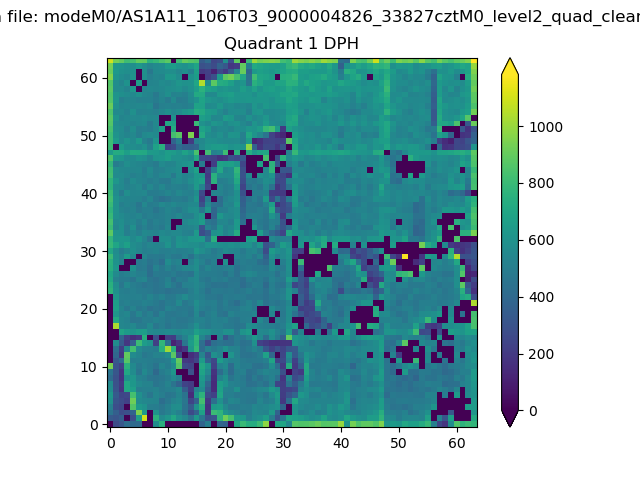 |
Quadrant B |
|---|---|---|---|
| Quadrant D | 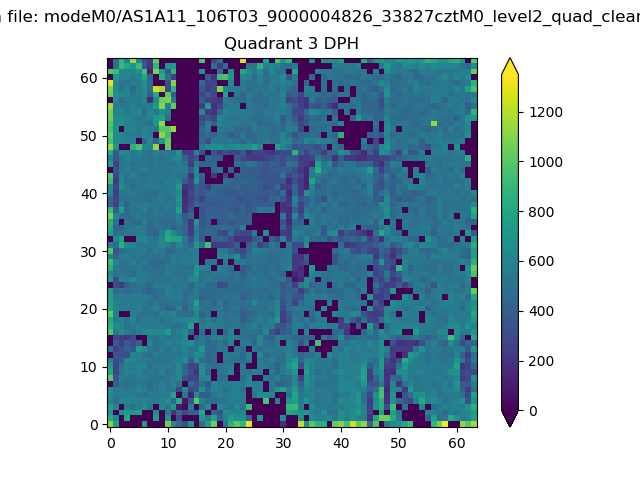 |
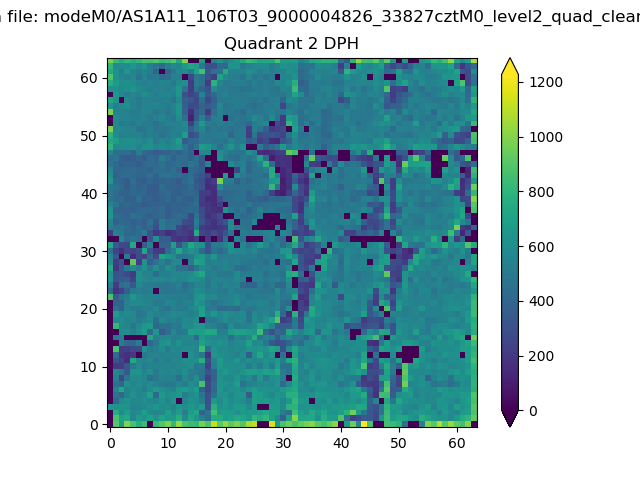 |
Quadrant C |
| Plot type | Count rate plots | Images |
|---|---|---|
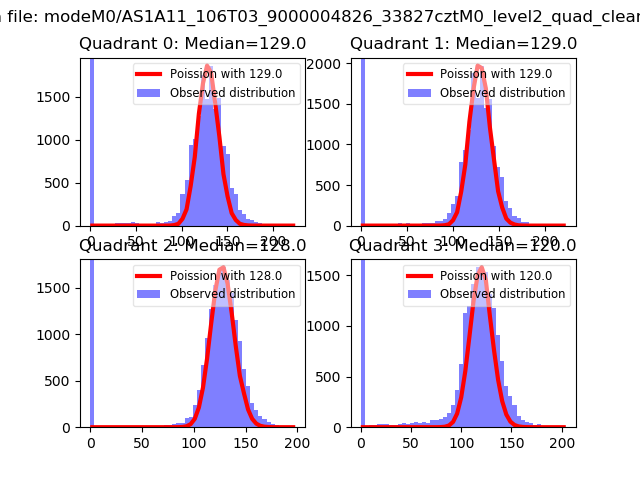
| Comparison with Poisson distribution Blue bars denote a histogram of data divided into 1 sec bins. Red curve is a Poisson curve with rate = median count rate of data. |
 |
 |
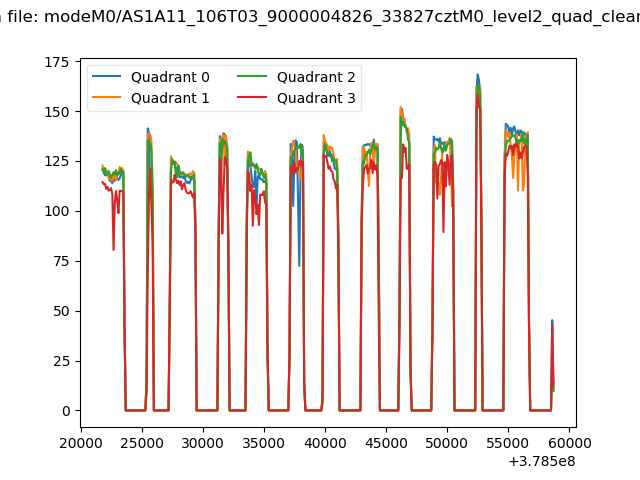
| Quadrant-wise count rates Data is divided into 100 sec bins |
 |
|
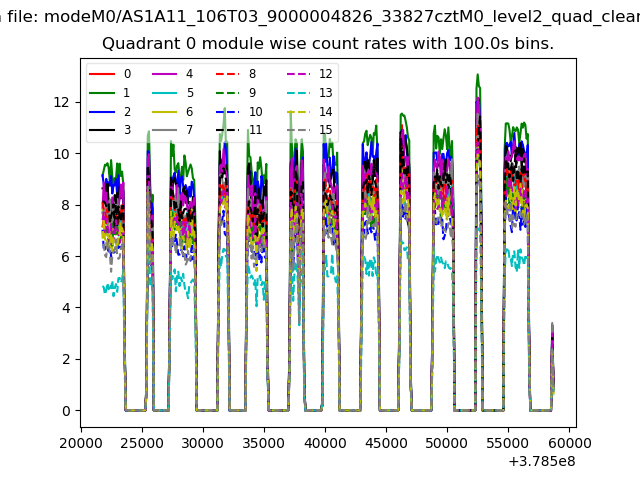
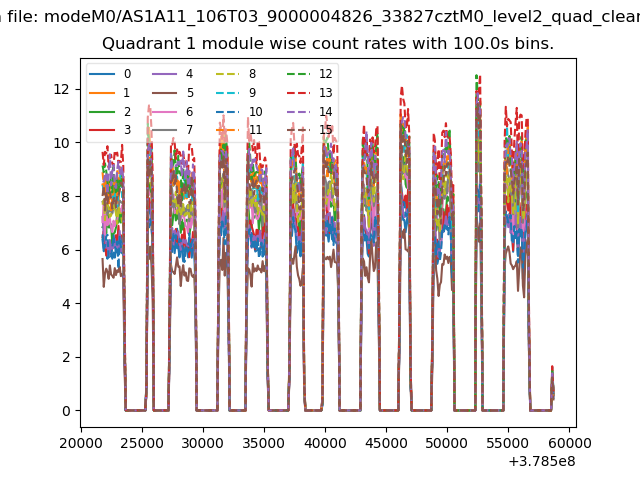
| Module-wise count rates for Quadrant A Data is divided into 100 sec bins |
 |
 |
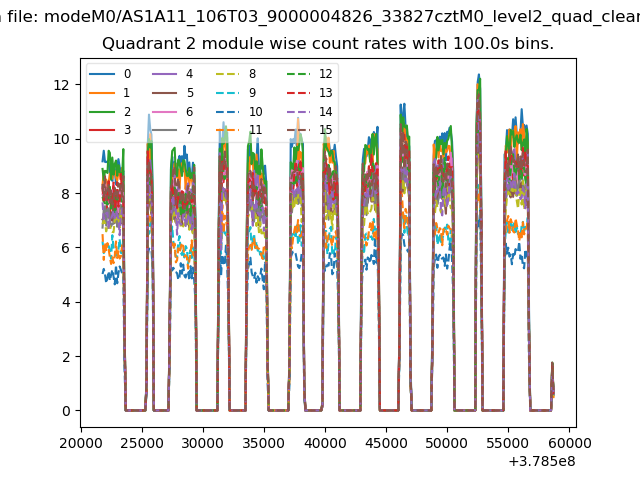
| Module-wise count rates for Quadrant B Data is divided into 100 sec bins |
 |
 |
| Module-wise count rates for Quadrant C Data is divided into 100 sec bins |
 |
 |
| Module-wise count rates for Quadrant D Data is divided into 100 sec bins |
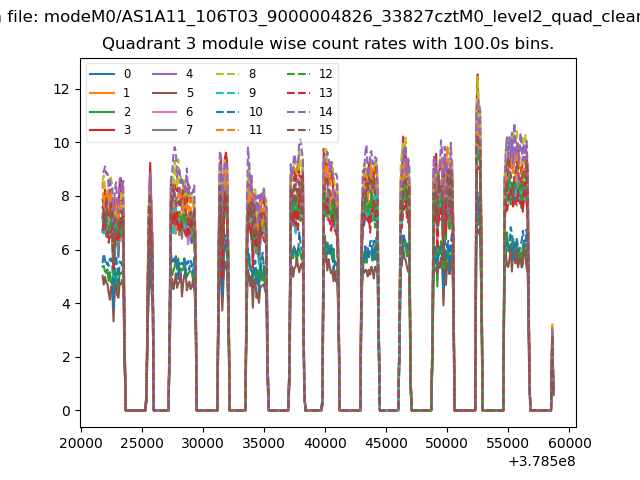 |
 |
| Parameter | Plot |
|---|---|
| CZT HV Monitor | 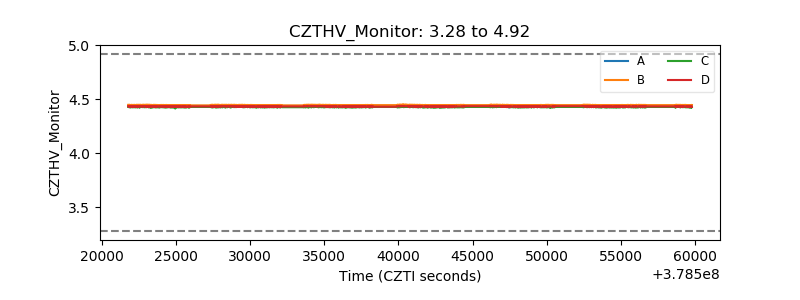 |
| D_VDD | 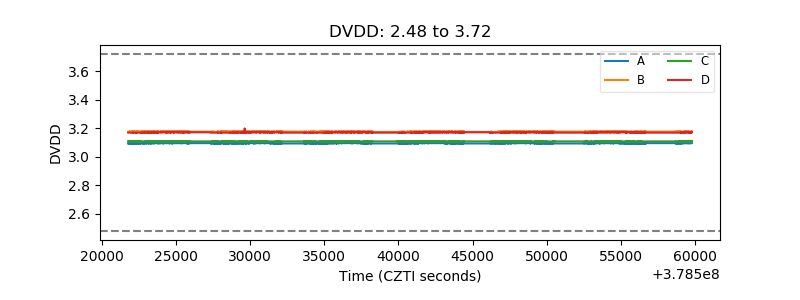 |
| Temperature 1 | 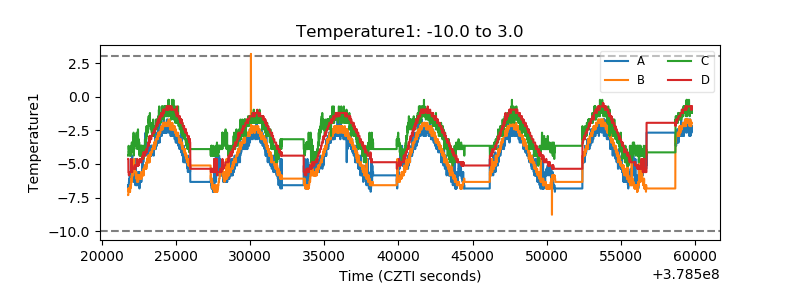 |
| Veto HV Monitor | 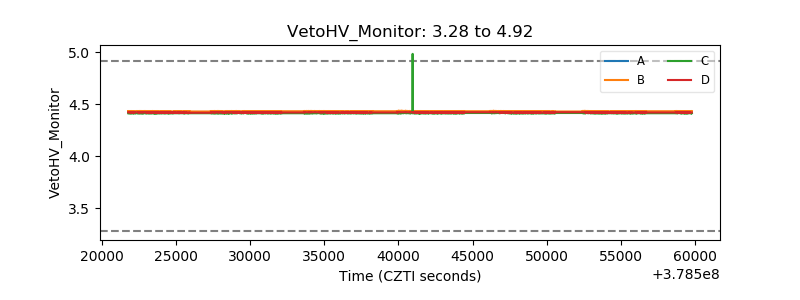 |
| Veto LLD | 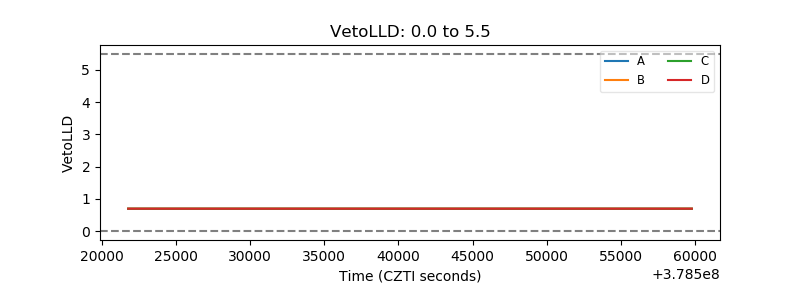 |
| Alpha Counter | 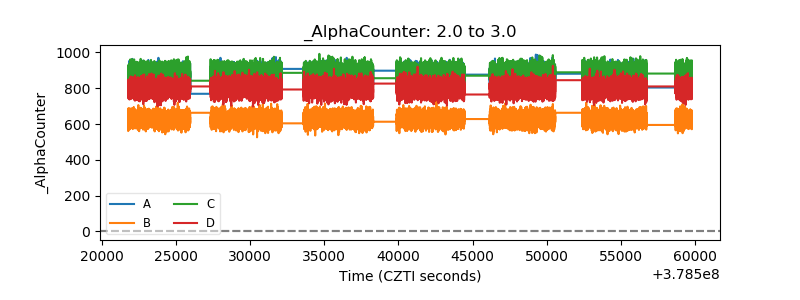 |
| _CPM_Rate | 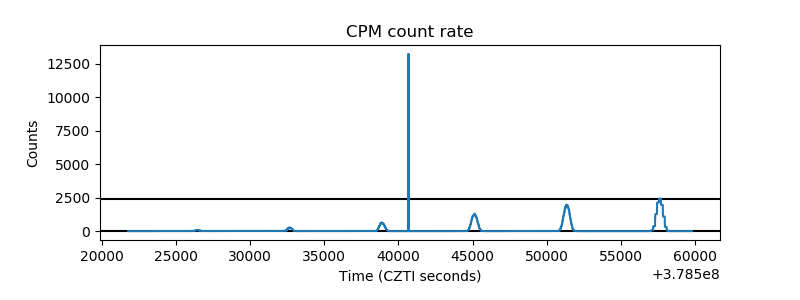 |
| CZT Counter | 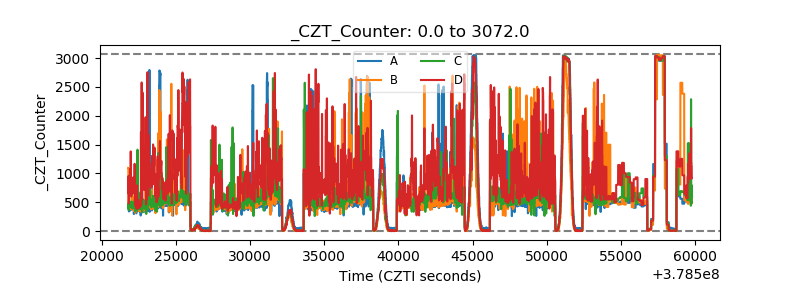 |
| +2.5 Volts monitor |  |
| +5 Volts monitor |  |
| _ROLL_ROT | 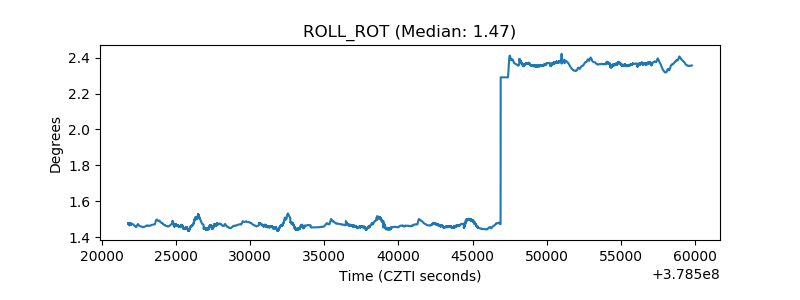 |
| _Roll_DEC | 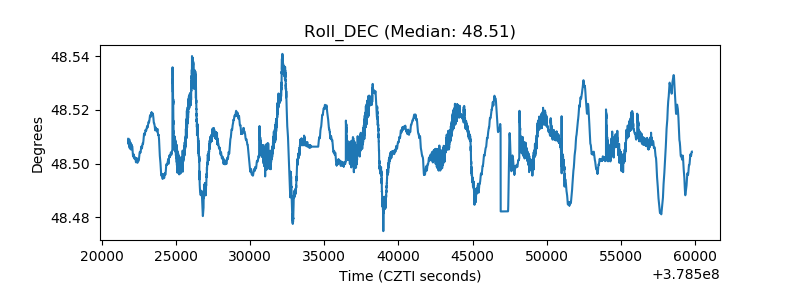 |
| _Roll_RA | 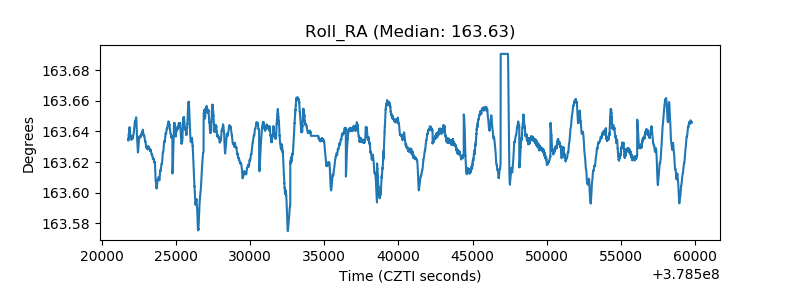 |
| Veto Counter | 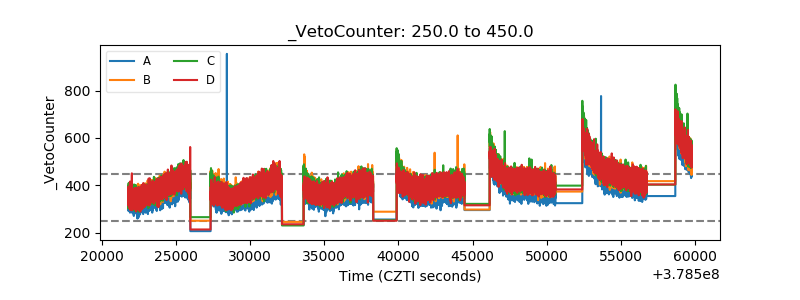 |