| Param | Original file | Final file |
|---|---|---|
| Filename | modeM0/AS1A11_106T03_9000004826_33828cztM0_level2.evt | modeM0/AS1A11_106T03_9000004826_33828cztM0_level2_quad_clean.evt |
| Size (bytes) | 524,134,080 | 56,796,480 |
| Size | 499.9 MB | 54.2 MB |
| Events in quadrant A | 2,955,001 | 350,523 |
| Events in quadrant B | 3,922,381 | 336,264 |
| Events in quadrant C | 3,625,434 | 337,700 |
| Events in quadrant D | 5,014,420 | 326,053 |
| Mode M9 | |||
|---|---|---|---|
| Quadrant | BADHDUFLAG | Total packets | Discarded packets |
| A | 0 | 29 | 0 |
| B | 0 | 29 | 0 |
| C | 0 | 29 | 0 |
| D | 0 | 30 | 0 |
| Mode SS | |||
|---|---|---|---|
| Quadrant | BADHDUFLAG | Total packets | Discarded packets |
| A | 0 | 106 | 0 |
| B | 0 | 106 | 0 |
| C | 0 | 106 | 0 |
| D | 0 | 106 | 0 |
| Mode M0 | |||
|---|---|---|---|
| Quadrant | BADHDUFLAG | Total packets | Discarded packets |
| A | 0 | 11966 | 3 |
| B | 0 | 14997 | 2 |
| C | 0 | 14404 | 2 |
| D | 0 | 18592 | 2 |
| Quadrant | Total seconds | Saturated seconds | Saturation percentage |
|---|---|---|---|
| A | 5271 | 8 | 0.151774% |
| B | 5271 | 394 | 7.474862% |
| C | 5271 | 117 | 2.219693% |
| D | 5271 | 240 | 4.553216% |
Noise dominated data is calculated using 1-second bins in cleaned event files. If a bin has >2000 counts, and if more than 50% of those come from <1% of pixels, then it is considered to be noise-dominated and hence unusable.
| Quadrant | # 1 sec bins | Bins with >0 counts | Bins with >2000 counts | High rate bins dominated by noise | Noise dominated (total time) | Noise dominated (detector-on time) | Marked lightcurve |
|---|---|---|---|---|---|---|---|
| A | 7304 | 5272 | 0 | 0 | 0.00% | 0.00% |  |
| B | 7304 | 5272 | 279 | 279 | 3.82% | 5.29% |  |
| C | 7304 | 5272 | 87 | 87 | 1.19% | 1.65% |  |
| D | 7304 | 5272 | 173 | 173 | 2.37% | 3.28% | 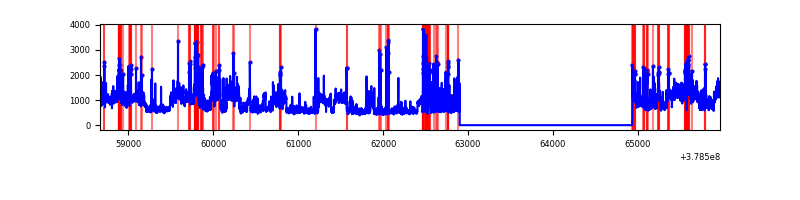 |
Top three noisy pixels from each quadrant. If the there are fewer than three noisy pixels in the level2.evt file, extra rows are filled as -1
| Pixel properties | Quadrant properties | ||||||
|---|---|---|---|---|---|---|---|
| Quadrant | DetID | PixID | Counts | Sigma | Mean | Median | Sigma |
| A | 15 | 169 | 186881 | 1325.56 | 707 | 695 | 140.5 |
| A | 13 | 6 | 19897 | 136.71 | 707 | 695 | 140.5 |
| A | 10 | 83 | 11028 | 73.57 | 707 | 695 | 140.5 |
| B | 5 | 172 | 1069021 | 8472.68 | 672 | 657 | 126.1 |
| B | 5 | 255 | 46153 | 360.81 | 672 | 657 | 126.1 |
| B | 3 | 112 | 37461 | 291.87 | 672 | 657 | 126.1 |
| C | 14 | 254 | 365923 | 2377.7 | 676 | 683 | 153.6 |
| C | 15 | 214 | 229494 | 1489.55 | 676 | 683 | 153.6 |
| C | 0 | 10 | 200815 | 1302.85 | 676 | 683 | 153.6 |
| D | 8 | 195 | 1188021 | 7204.82 | 678 | 662 | 164.8 |
| D | 12 | 235 | 313176 | 1896.31 | 678 | 662 | 164.8 |
| D | 13 | 249 | 214467 | 1297.35 | 678 | 662 | 164.8 |
Histogram calculated using DETX and DETY for each event in the final _common_clean file
| Quadrant A |  |
 |
Quadrant B |
|---|---|---|---|
| Quadrant D |  |
 |
Quadrant C |
| Plot type | Count rate plots | Images |
|---|---|---|
| Comparison with Poisson distribution Blue bars denote a histogram of data divided into 1 sec bins. Red curve is a Poisson curve with rate = median count rate of data. |
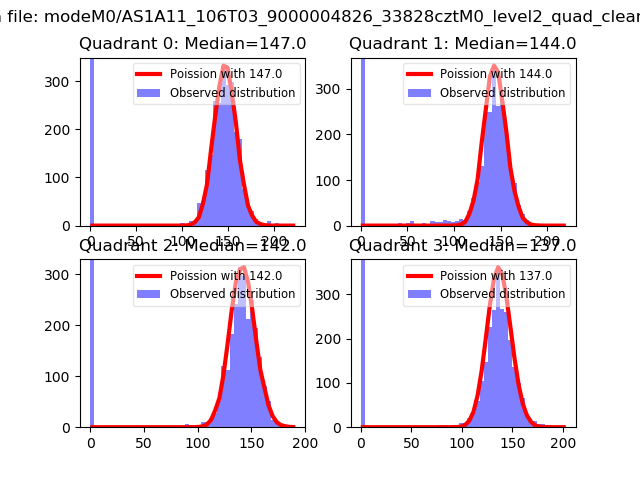 |
 |
| Quadrant-wise count rates Data is divided into 100 sec bins |
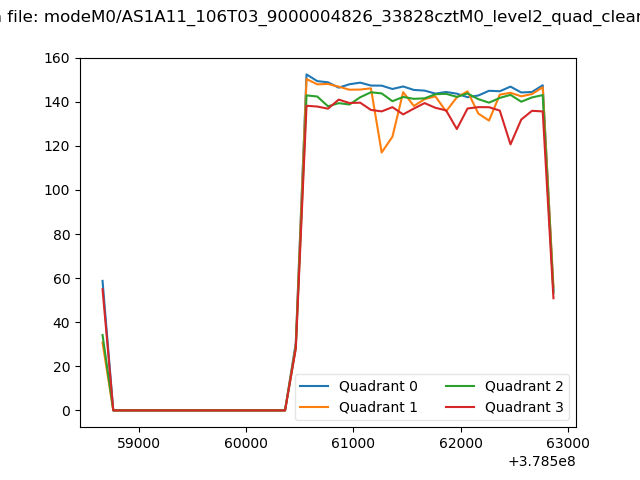 |
|
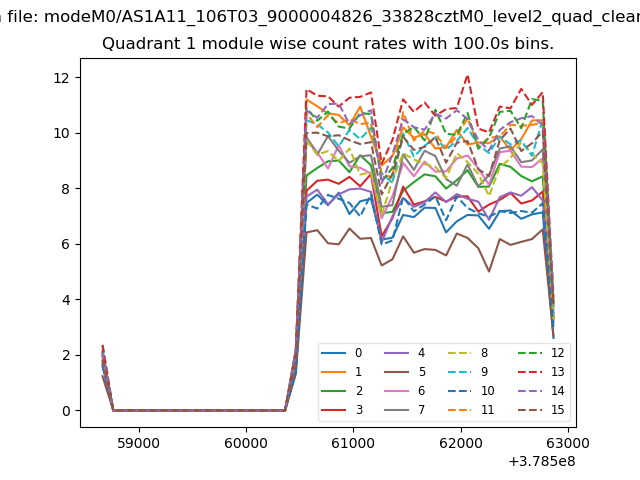
| Module-wise count rates for Quadrant A Data is divided into 100 sec bins |
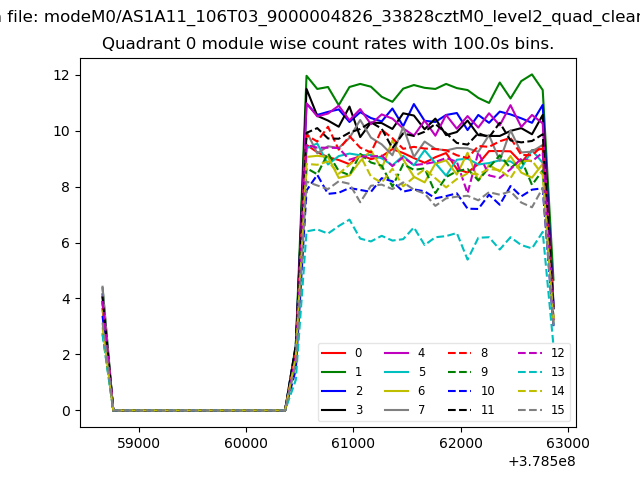 |
 |
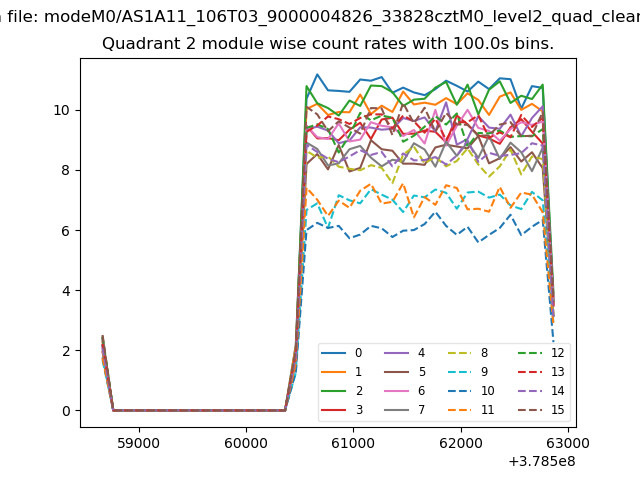
| Module-wise count rates for Quadrant B Data is divided into 100 sec bins |
 |
 |
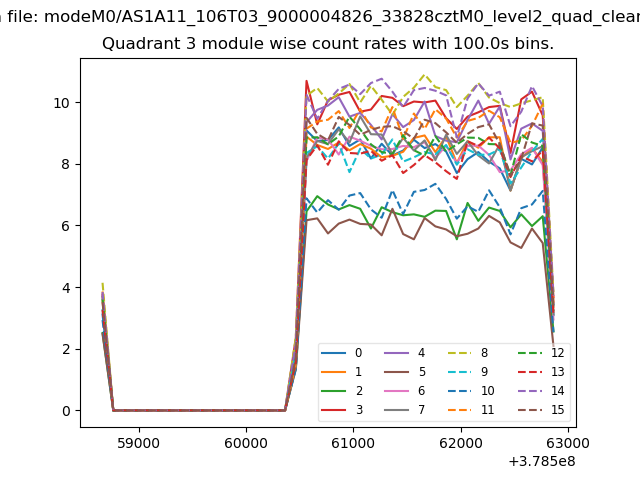
| Module-wise count rates for Quadrant C Data is divided into 100 sec bins |
 |
 |
| Module-wise count rates for Quadrant D Data is divided into 100 sec bins |
 |
 |
| Parameter | Plot |
|---|---|
| CZT HV Monitor | 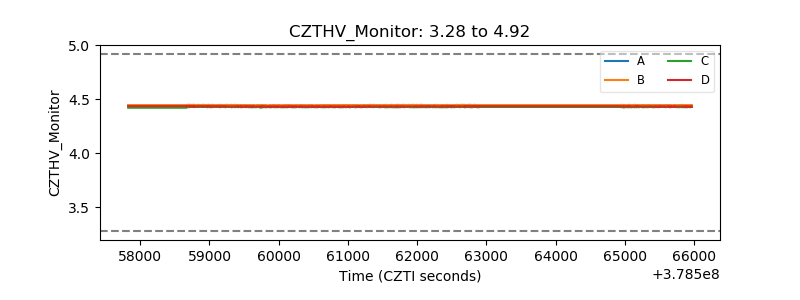 |
| D_VDD |  |
| Temperature 1 |  |
| Veto HV Monitor |  |
| Veto LLD |  |
| Alpha Counter | 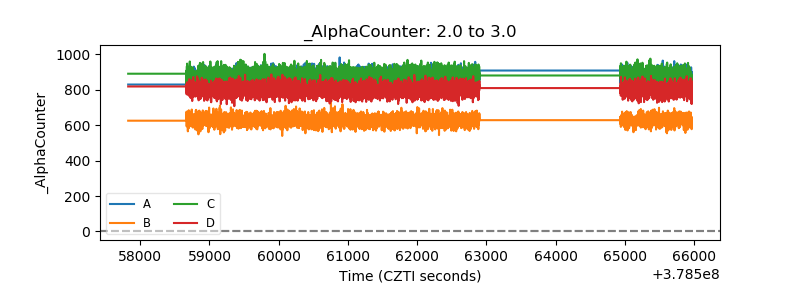 |
| _CPM_Rate | 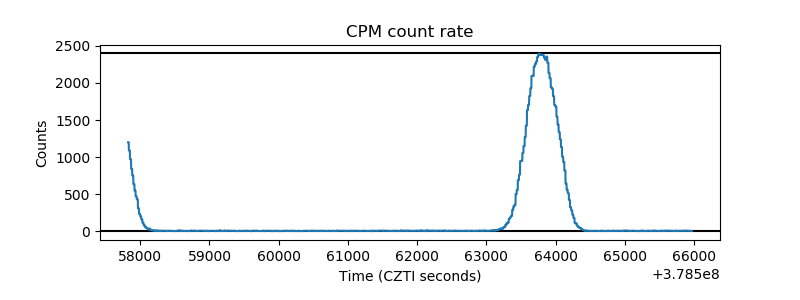 |
| CZT Counter |  |
| +2.5 Volts monitor |  |
| +5 Volts monitor |  |
| _ROLL_ROT | 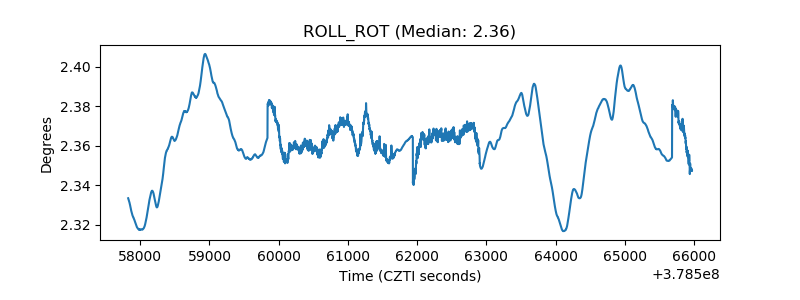 |
| _Roll_DEC |  |
| _Roll_RA |  |
| Veto Counter | 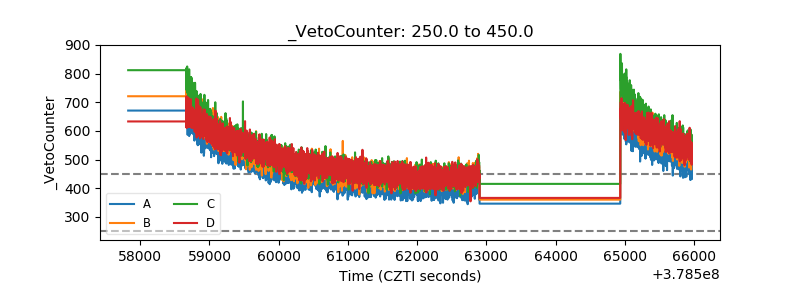 |