| Param | Original file | Final file |
|---|---|---|
| Filename | modeM0/AS1A11_106T03_9000004826_33829cztM0_level2.evt | modeM0/AS1A11_106T03_9000004826_33829cztM0_level2_quad_clean.evt |
| Size (bytes) | 493,683,840 | 62,467,200 |
| Size | 470.8 MB | 59.6 MB |
| Events in quadrant A | 2,854,175 | 395,748 |
| Events in quadrant B | 3,422,153 | 386,902 |
| Events in quadrant C | 3,281,105 | 392,046 |
| Events in quadrant D | 5,051,072 | 361,610 |
| Mode M9 | |||
|---|---|---|---|
| Quadrant | BADHDUFLAG | Total packets | Discarded packets |
| A | 0 | 32 | 0 |
| B | 0 | 32 | 0 |
| C | 0 | 32 | 0 |
| D | 0 | 33 | 0 |
| Mode SS | |||
|---|---|---|---|
| Quadrant | BADHDUFLAG | Total packets | Discarded packets |
| A | 0 | 102 | 0 |
| B | 0 | 102 | 0 |
| C | 0 | 102 | 0 |
| D | 0 | 102 | 0 |
| Mode M0 | |||
|---|---|---|---|
| Quadrant | BADHDUFLAG | Total packets | Discarded packets |
| A | 0 | 11710 | 3 |
| B | 0 | 13488 | 2 |
| C | 0 | 13174 | 2 |
| D | 0 | 18533 | 2 |
| Quadrant | Total seconds | Saturated seconds | Saturation percentage |
|---|---|---|---|
| A | 5067 | 7 | 0.138149% |
| B | 5067 | 170 | 3.355042% |
| C | 5067 | 81 | 1.598579% |
| D | 5067 | 339 | 6.690349% |
Noise dominated data is calculated using 1-second bins in cleaned event files. If a bin has >2000 counts, and if more than 50% of those come from <1% of pixels, then it is considered to be noise-dominated and hence unusable.
| Quadrant | # 1 sec bins | Bins with >0 counts | Bins with >2000 counts | High rate bins dominated by noise | Noise dominated (total time) | Noise dominated (detector-on time) | Marked lightcurve |
|---|---|---|---|---|---|---|---|
| A | 7189 | 5068 | 0 | 0 | 0.00% | 0.00% | 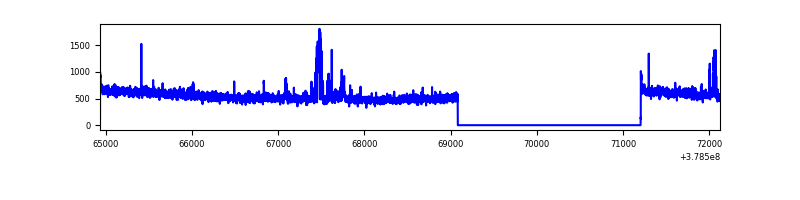 |
| B | 7189 | 5068 | 119 | 119 | 1.66% | 2.35% | 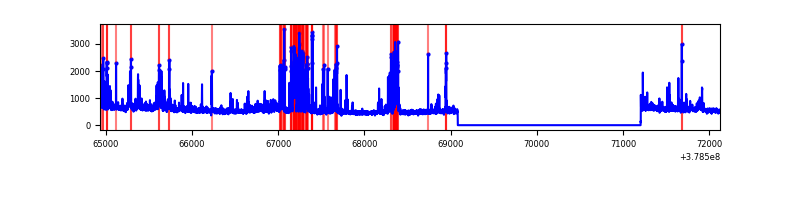 |
| C | 7189 | 5068 | 53 | 53 | 0.74% | 1.05% | 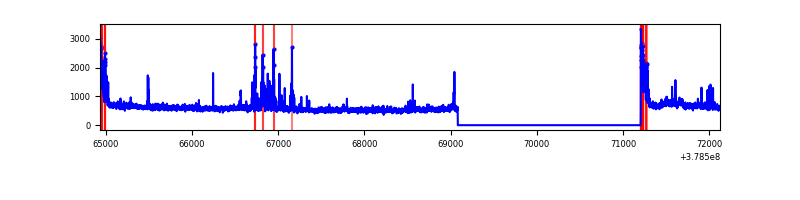 |
| D | 7189 | 5068 | 279 | 279 | 3.88% | 5.51% | 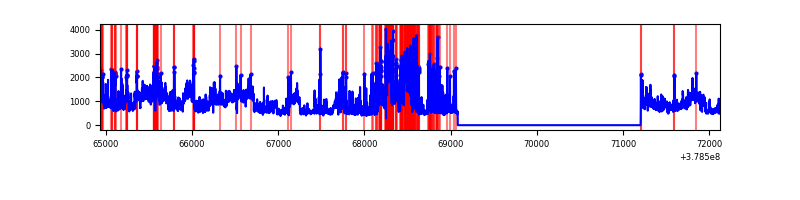 |
Top three noisy pixels from each quadrant. If the there are fewer than three noisy pixels in the level2.evt file, extra rows are filled as -1
| Pixel properties | Quadrant properties | ||||||
|---|---|---|---|---|---|---|---|
| Quadrant | DetID | PixID | Counts | Sigma | Mean | Median | Sigma |
| A | 15 | 169 | 135111 | 1014.34 | 670 | 660 | 132.6 |
| A | 0 | 254 | 99423 | 745.1 | 670 | 660 | 132.6 |
| A | 13 | 6 | 21511 | 157.31 | 670 | 660 | 132.6 |
| B | 5 | 172 | 576673 | 4747.87 | 656 | 639 | 121.3 |
| B | 8 | 128 | 62415 | 509.18 | 656 | 639 | 121.3 |
| B | 0 | 213 | 58072 | 473.38 | 656 | 639 | 121.3 |
| C | 15 | 214 | 220902 | 1493.62 | 649 | 655 | 147.5 |
| C | 0 | 10 | 202313 | 1367.56 | 649 | 655 | 147.5 |
| C | 3 | 233 | 135172 | 912.24 | 649 | 655 | 147.5 |
| D | 8 | 195 | 1042130 | 6209.86 | 636 | 623 | 167.7 |
| D | 12 | 6 | 417711 | 2486.84 | 636 | 623 | 167.7 |
| D | 2 | 250 | 308823 | 1837.61 | 636 | 623 | 167.7 |
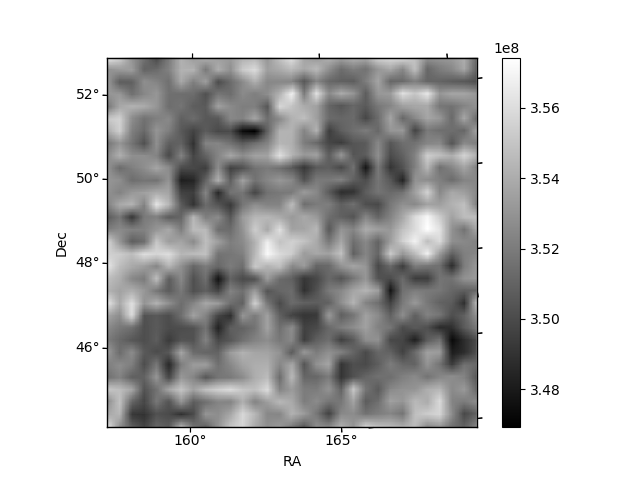
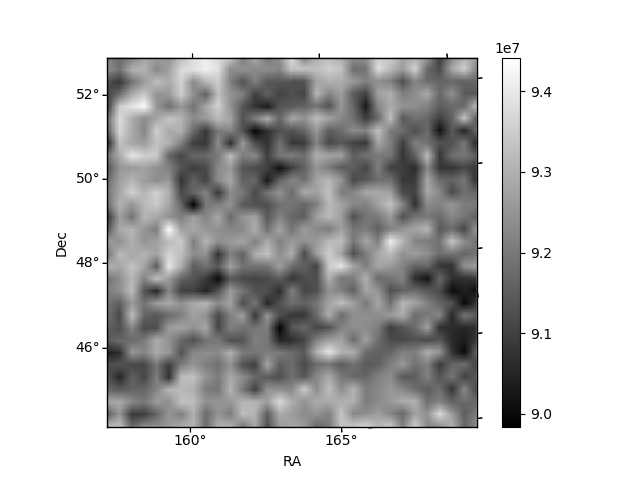
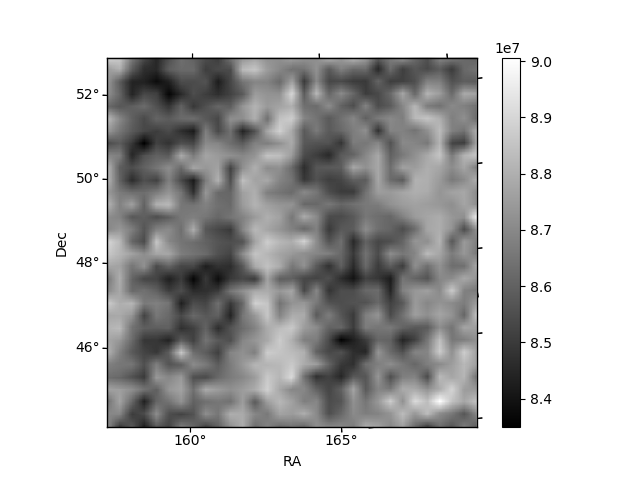
Histogram calculated using DETX and DETY for each event in the final _common_clean file
| Quadrant A | 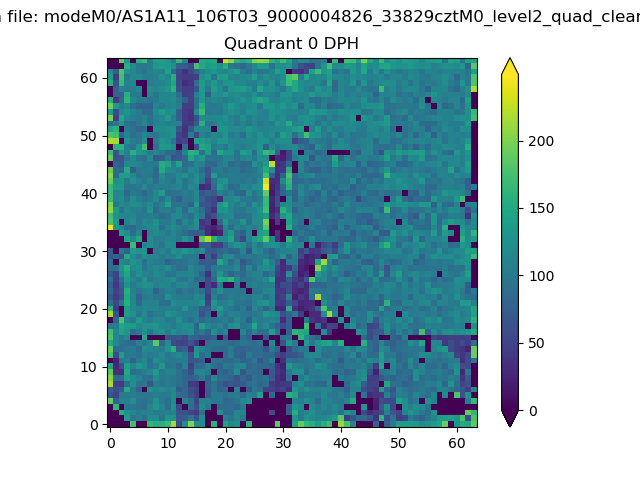 |
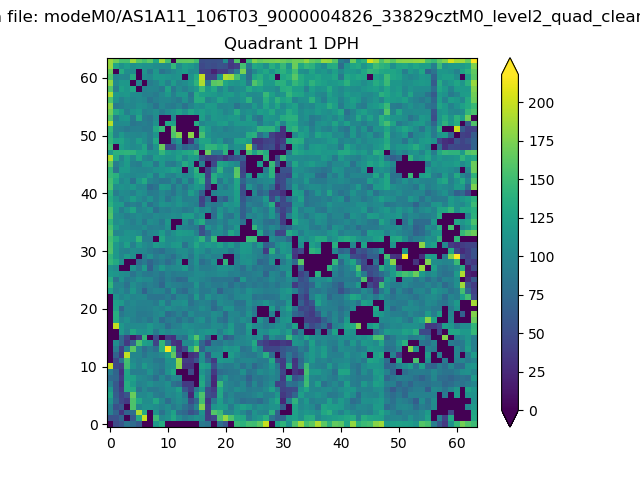 |
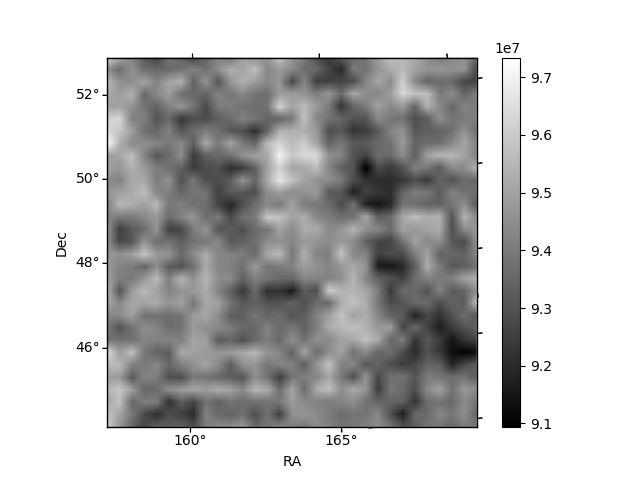
Quadrant B |
|---|---|---|---|
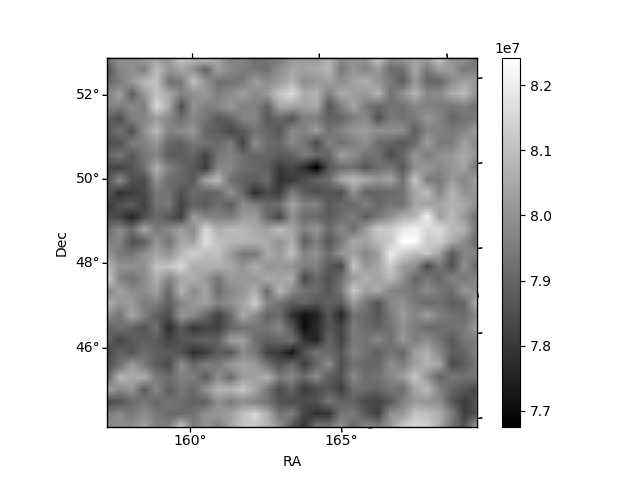
| Quadrant D | 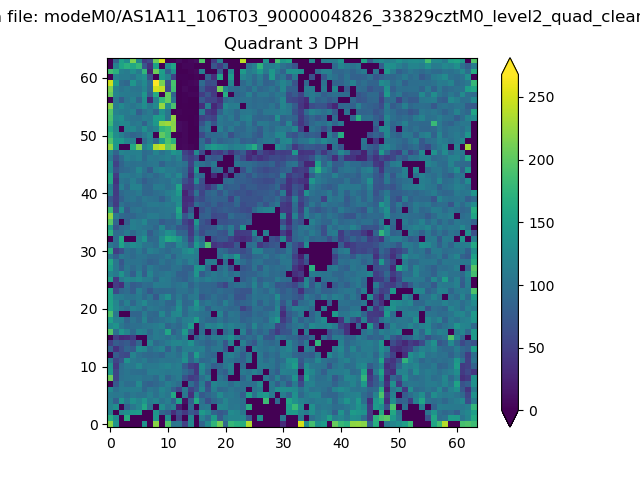 |
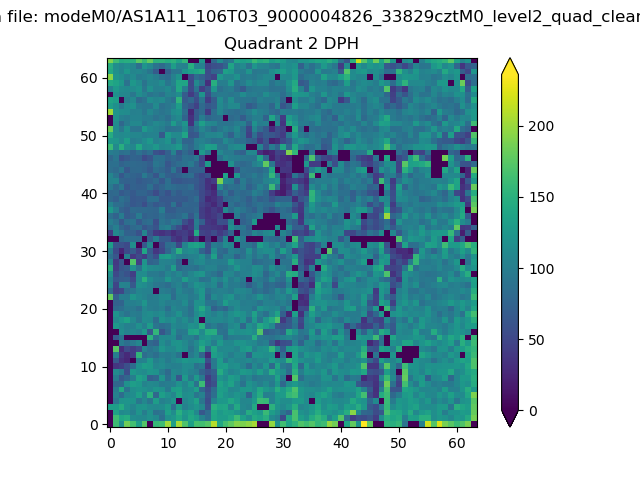 |
Quadrant C |
| Plot type | Count rate plots | Images |
|---|---|---|
| Comparison with Poisson distribution Blue bars denote a histogram of data divided into 1 sec bins. Red curve is a Poisson curve with rate = median count rate of data. |
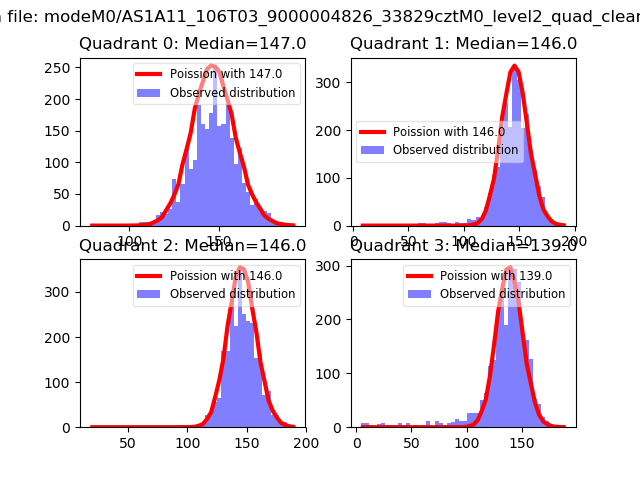 |
 |
| Quadrant-wise count rates Data is divided into 100 sec bins |
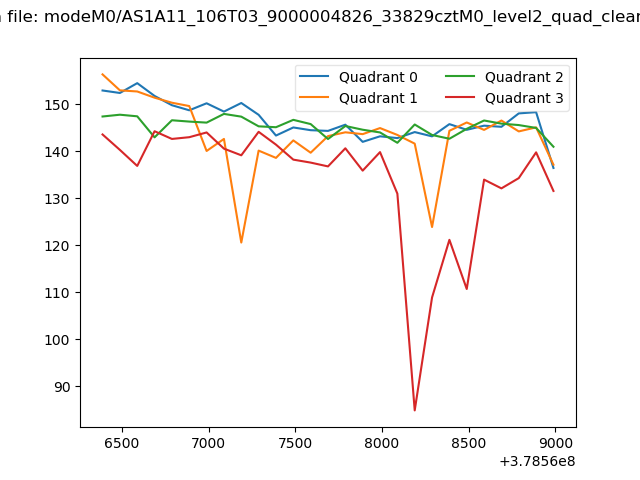 |
|
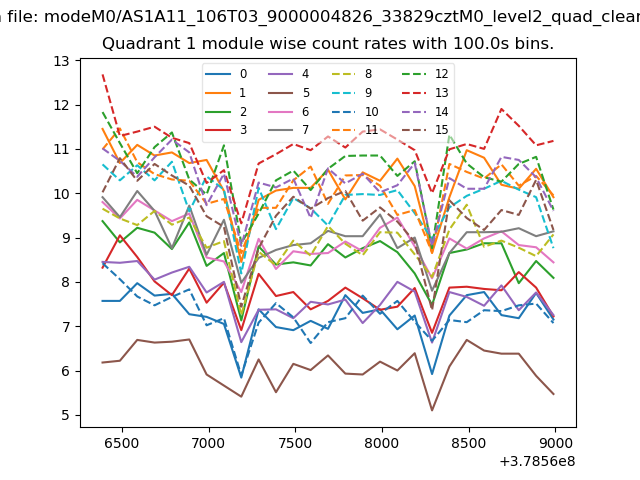
| Module-wise count rates for Quadrant A Data is divided into 100 sec bins |
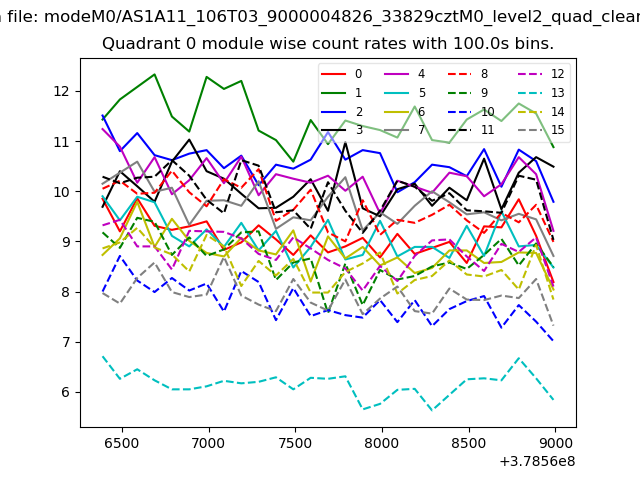 |
 |
| Module-wise count rates for Quadrant B Data is divided into 100 sec bins |
 |
 |
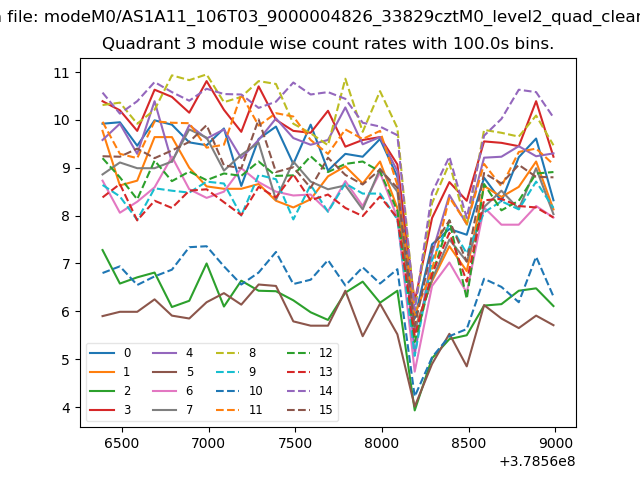
| Module-wise count rates for Quadrant C Data is divided into 100 sec bins |
 |
 |
| Module-wise count rates for Quadrant D Data is divided into 100 sec bins |
 |
 |
| Parameter | Plot |
|---|---|
| CZT HV Monitor |  |
| D_VDD | 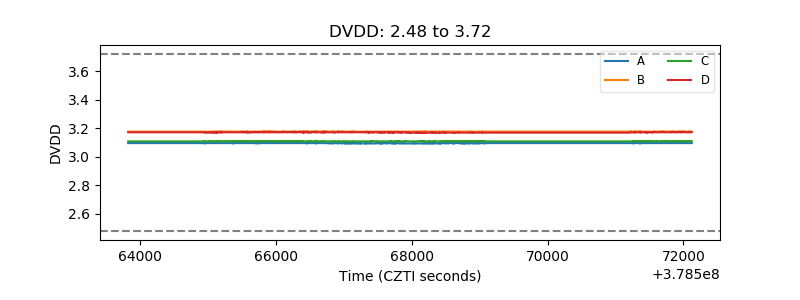 |
| Temperature 1 | 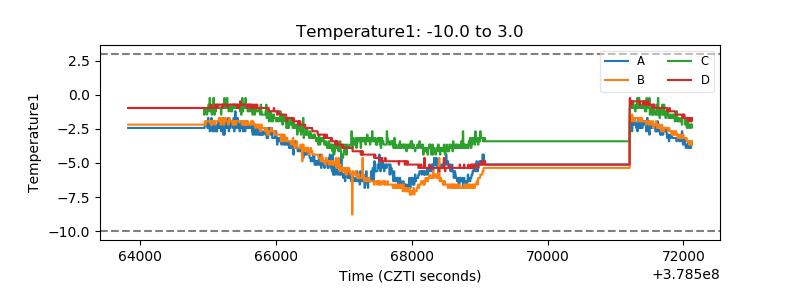 |
| Veto HV Monitor | 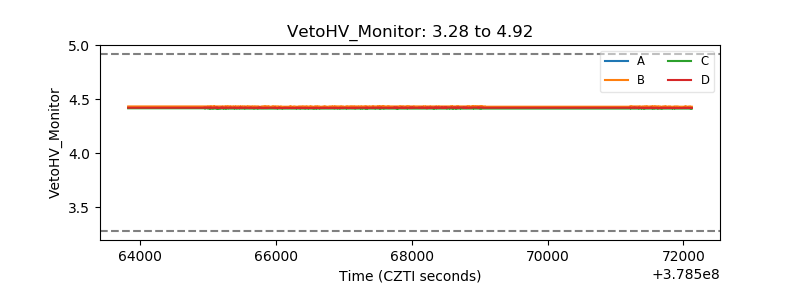 |
| Veto LLD | 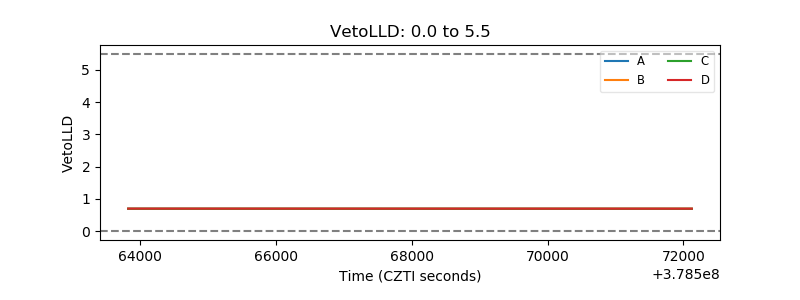 |
| Alpha Counter | 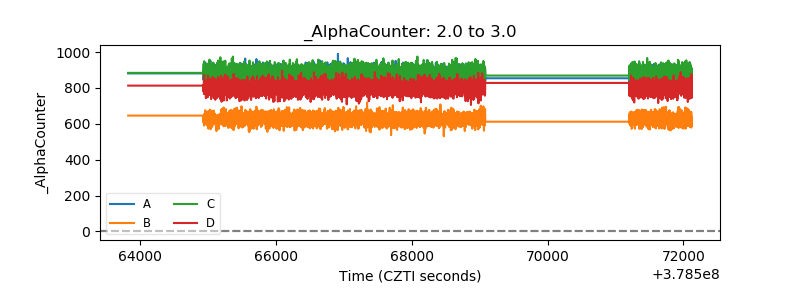 |
| _CPM_Rate | 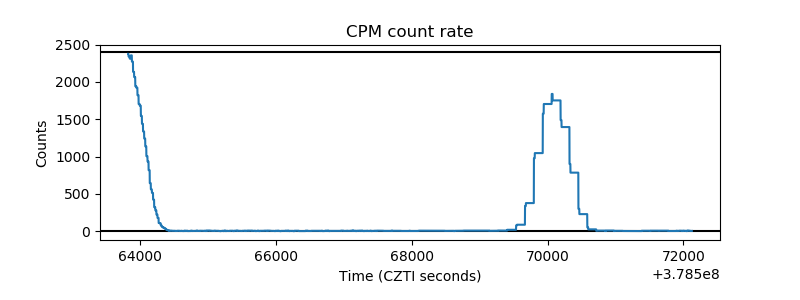 |
| CZT Counter | 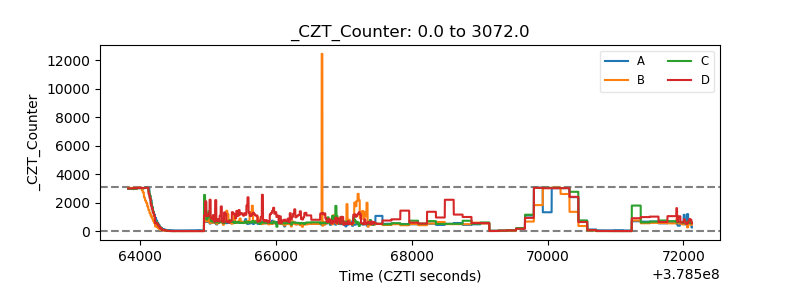 |
| +2.5 Volts monitor |  |
| +5 Volts monitor |  |
| _ROLL_ROT | 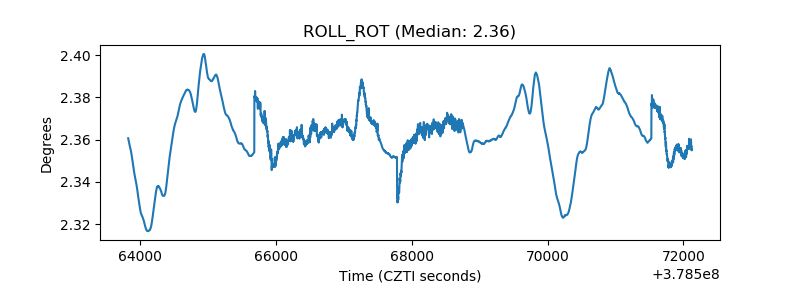 |
| _Roll_DEC | 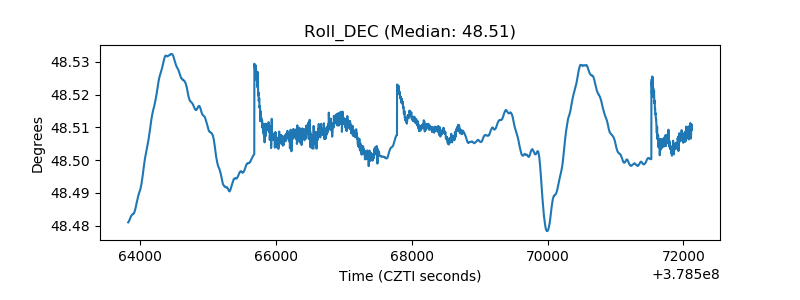 |
| _Roll_RA | 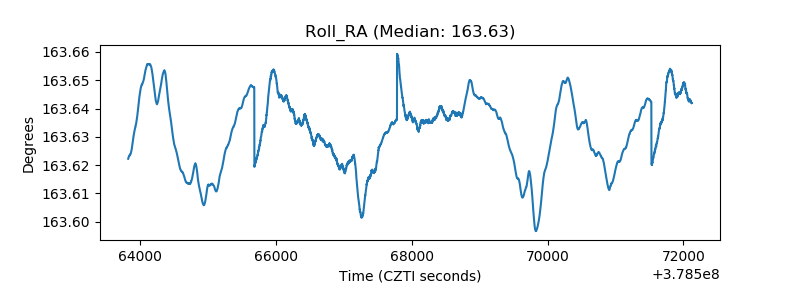 |
| Veto Counter | 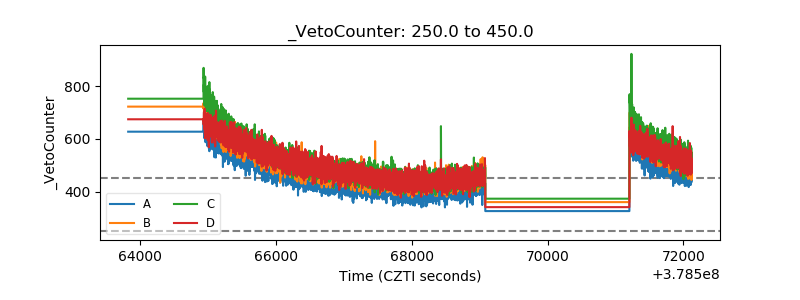 |