| Param | Original file | Final file |
|---|---|---|
| Filename | modeM0/AS1A11_106T03_9000004826_33830cztM0_level2.evt | modeM0/AS1A11_106T03_9000004826_33830cztM0_level2_quad_clean.evt |
| Size (bytes) | 486,789,120 | 71,225,280 |
| Size | 464.2 MB | 67.9 MB |
| Events in quadrant A | 3,365,841 | 444,811 |
| Events in quadrant B | 3,425,479 | 457,855 |
| Events in quadrant C | 3,282,720 | 468,010 |
| Events in quadrant D | 4,335,135 | 440,642 |
| Mode M9 | |||
|---|---|---|---|
| Quadrant | BADHDUFLAG | Total packets | Discarded packets |
| A | 0 | 34 | 0 |
| B | 0 | 34 | 0 |
| C | 0 | 34 | 0 |
| D | 0 | 35 | 0 |
| Mode SS | |||
|---|---|---|---|
| Quadrant | BADHDUFLAG | Total packets | Discarded packets |
| A | 0 | 102 | 0 |
| B | 0 | 102 | 0 |
| C | 0 | 102 | 0 |
| D | 0 | 102 | 0 |
| Mode M0 | |||
|---|---|---|---|
| Quadrant | BADHDUFLAG | Total packets | Discarded packets |
| A | 0 | 13110 | 3 |
| B | 0 | 13323 | 2 |
| C | 0 | 13087 | 2 |
| D | 0 | 16232 | 2 |
| Quadrant | Total seconds | Saturated seconds | Saturation percentage |
|---|---|---|---|
| A | 4914 | 337 | 6.857957% |
| B | 4914 | 260 | 5.291005% |
| C | 4914 | 87 | 1.770452% |
| D | 4914 | 183 | 3.724054% |
Noise dominated data is calculated using 1-second bins in cleaned event files. If a bin has >2000 counts, and if more than 50% of those come from <1% of pixels, then it is considered to be noise-dominated and hence unusable.
| Quadrant | # 1 sec bins | Bins with >0 counts | Bins with >2000 counts | High rate bins dominated by noise | Noise dominated (total time) | Noise dominated (detector-on time) | Marked lightcurve |
|---|---|---|---|---|---|---|---|
| A | 7036 | 4915 | 308 | 308 | 4.38% | 6.27% | 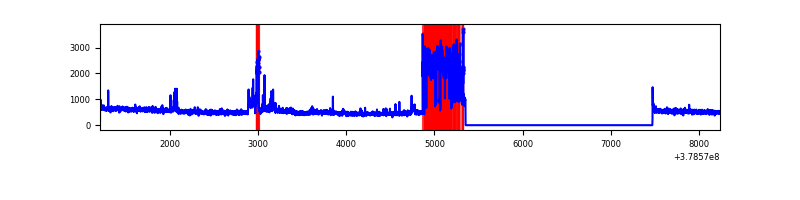 |
| B | 7036 | 4915 | 174 | 174 | 2.47% | 3.54% | 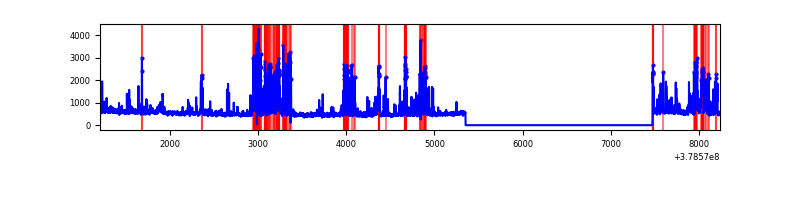 |
| C | 7036 | 4915 | 61 | 61 | 0.87% | 1.24% | 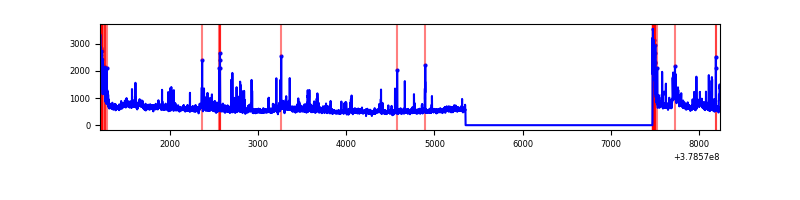 |
| D | 7036 | 4915 | 176 | 176 | 2.50% | 3.58% | 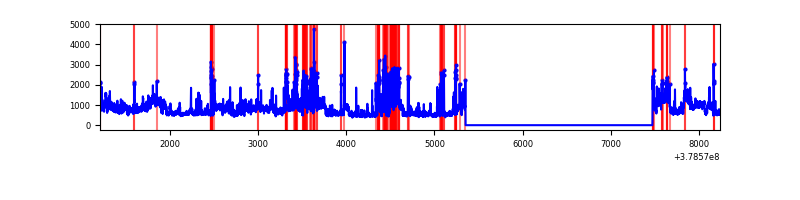 |
Top three noisy pixels from each quadrant. If the there are fewer than three noisy pixels in the level2.evt file, extra rows are filled as -1
| Pixel properties | Quadrant properties | ||||||
|---|---|---|---|---|---|---|---|
| Quadrant | DetID | PixID | Counts | Sigma | Mean | Median | Sigma |
| A | 15 | 169 | 1006797 | 8377.24 | 602 | 592 | 120.1 |
| A | 13 | 6 | 17839 | 143.59 | 602 | 592 | 120.1 |
| A | 10 | 83 | 11463 | 90.51 | 602 | 592 | 120.1 |
| B | 5 | 172 | 780565 | 6900.51 | 606 | 593 | 113.0 |
| B | 0 | 229 | 129630 | 1141.61 | 606 | 593 | 113.0 |
| B | 0 | 213 | 25745 | 222.52 | 606 | 593 | 113.0 |
| C | 3 | 233 | 278167 | 2027.5 | 604 | 609 | 136.9 |
| C | 15 | 214 | 210585 | 1533.83 | 604 | 609 | 136.9 |
| C | 0 | 10 | 183010 | 1332.4 | 604 | 609 | 136.9 |
| D | 8 | 195 | 960604 | 5931.71 | 596 | 586 | 161.8 |
| D | 2 | 250 | 290355 | 1790.41 | 596 | 586 | 161.8 |
| D | 12 | 6 | 255016 | 1572.06 | 596 | 586 | 161.8 |
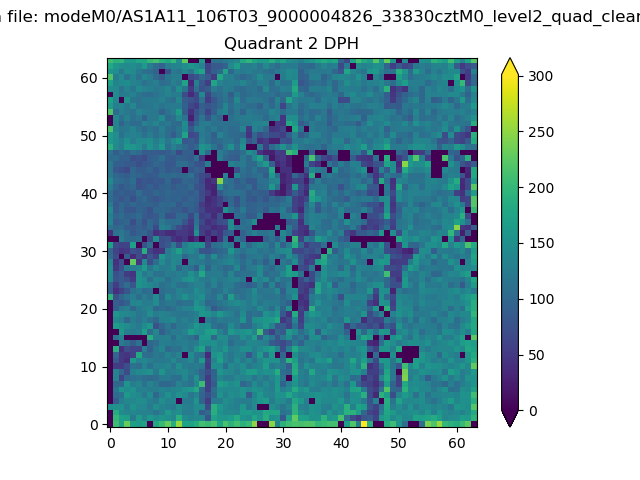
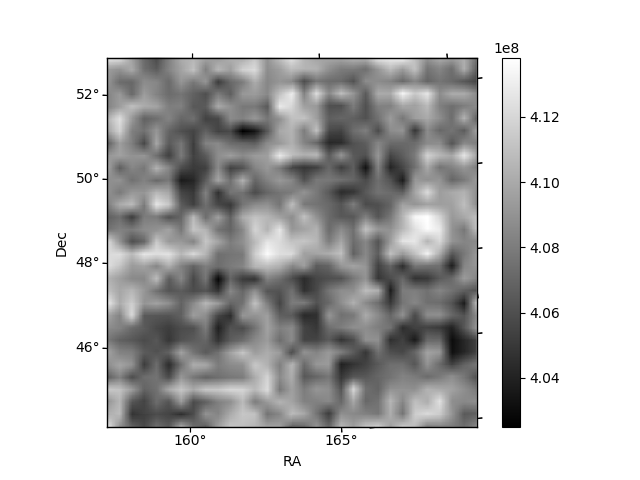
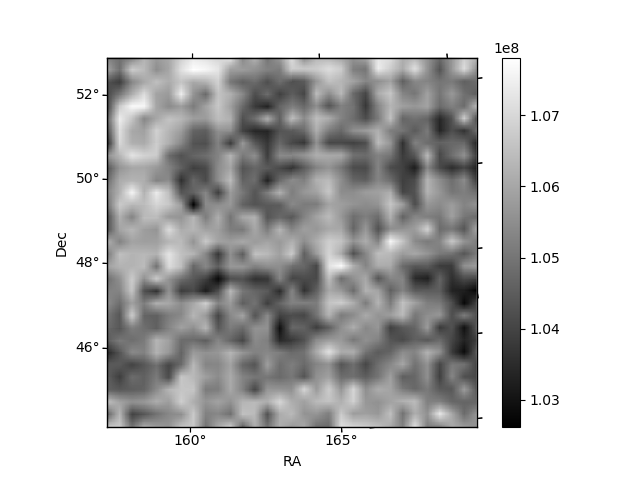
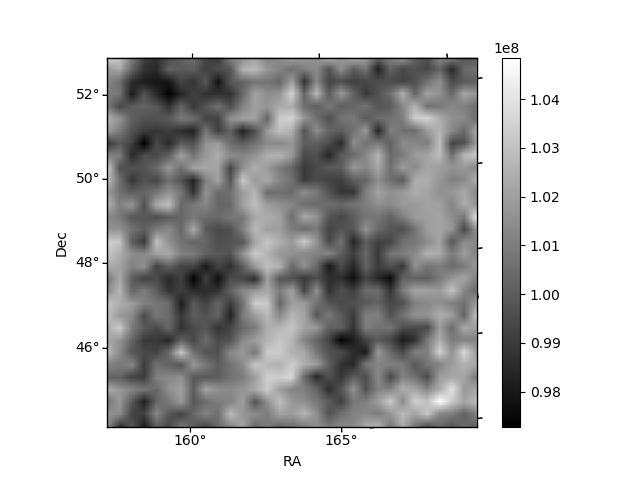
Histogram calculated using DETX and DETY for each event in the final _common_clean file
| Quadrant A | 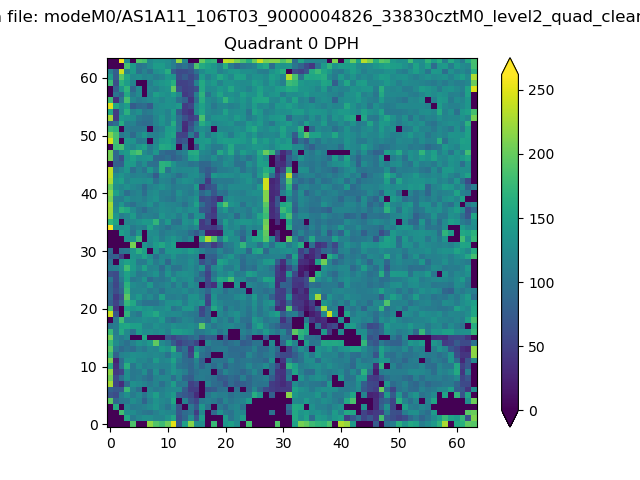 |
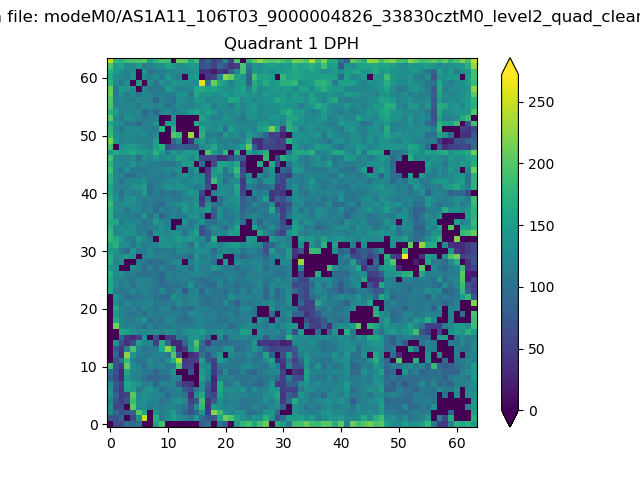 |
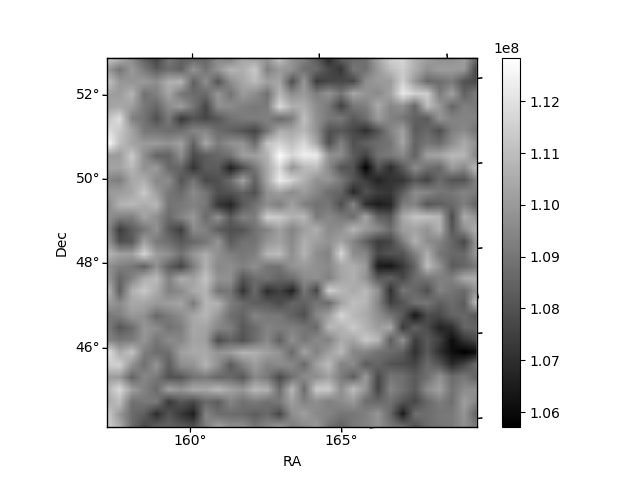
Quadrant B |
|---|---|---|---|
| Quadrant D | 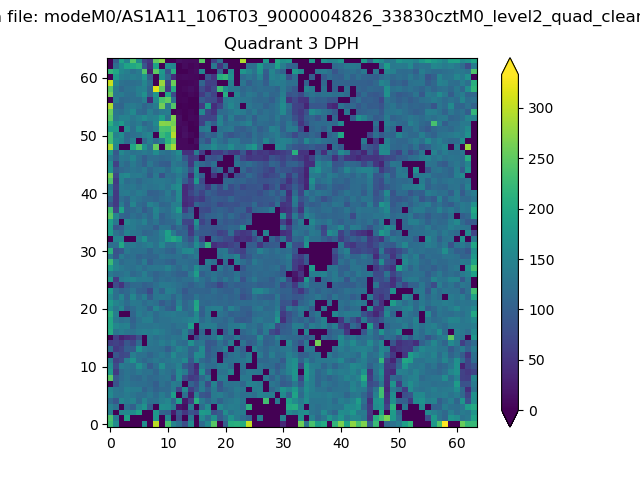 |
 |
Quadrant C |
| Plot type | Count rate plots | Images |
|---|---|---|
| Comparison with Poisson distribution Blue bars denote a histogram of data divided into 1 sec bins. Red curve is a Poisson curve with rate = median count rate of data. |
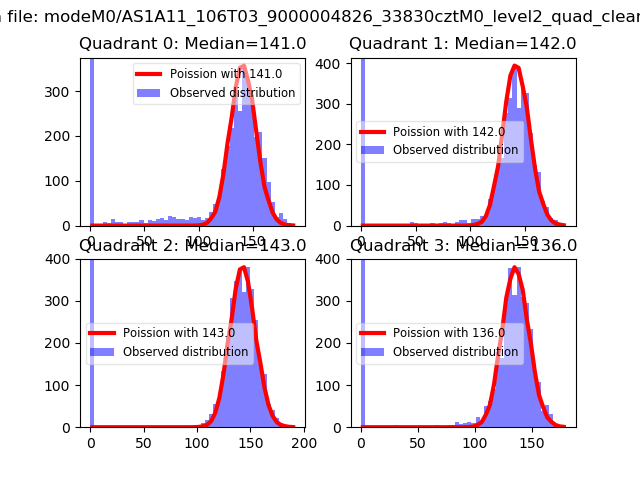 |
 |
| Quadrant-wise count rates Data is divided into 100 sec bins |
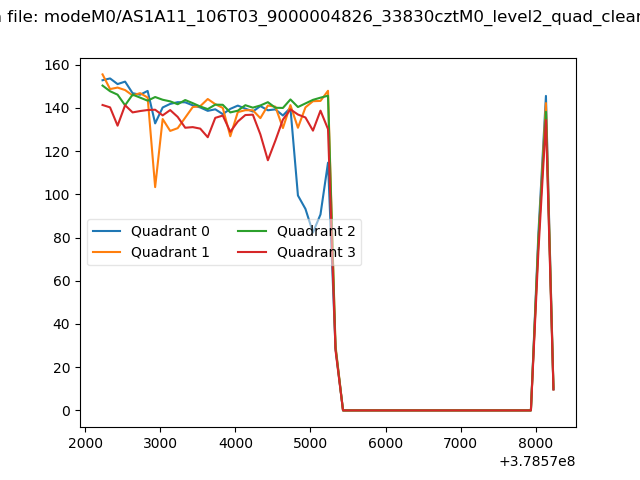 |
|
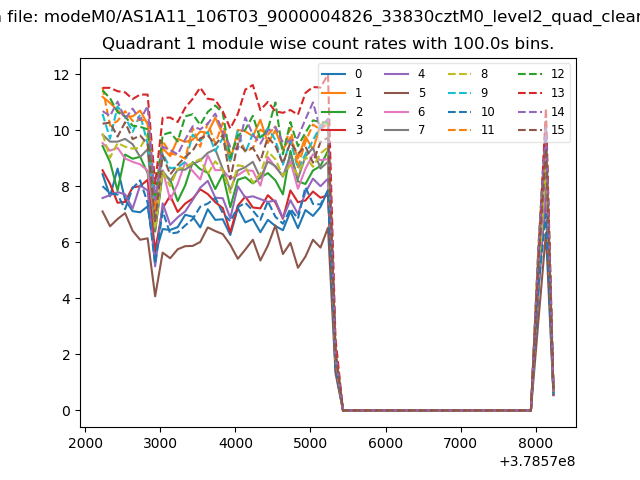
| Module-wise count rates for Quadrant A Data is divided into 100 sec bins |
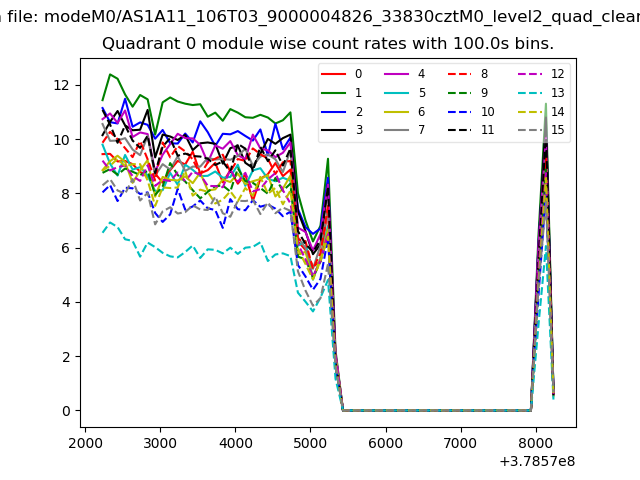 |
 |
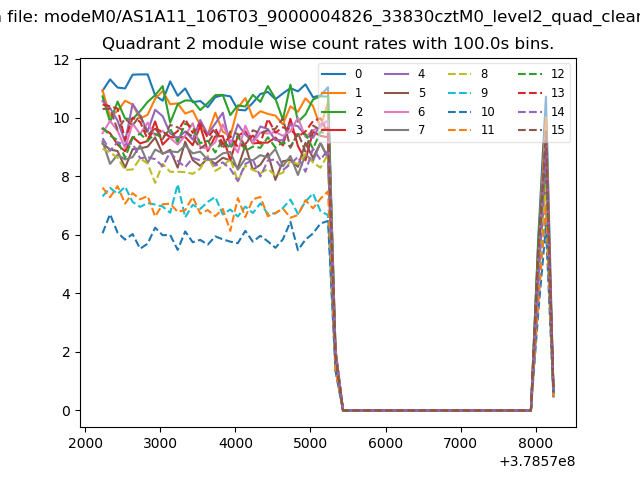
| Module-wise count rates for Quadrant B Data is divided into 100 sec bins |
 |
 |
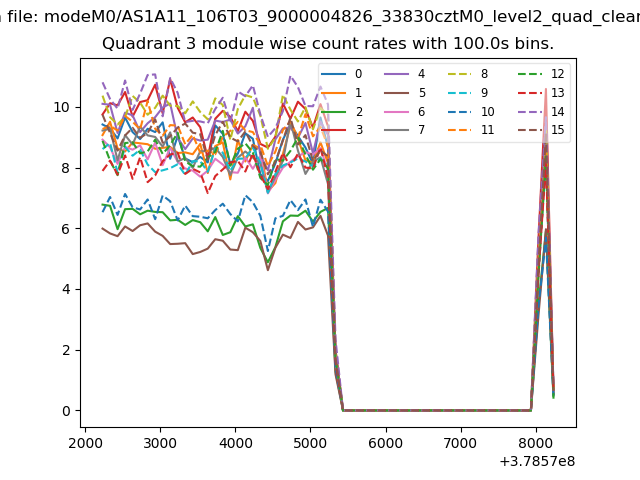
| Module-wise count rates for Quadrant C Data is divided into 100 sec bins |
 |
 |
| Module-wise count rates for Quadrant D Data is divided into 100 sec bins |
 |
 |
| Parameter | Plot |
|---|---|
| CZT HV Monitor | 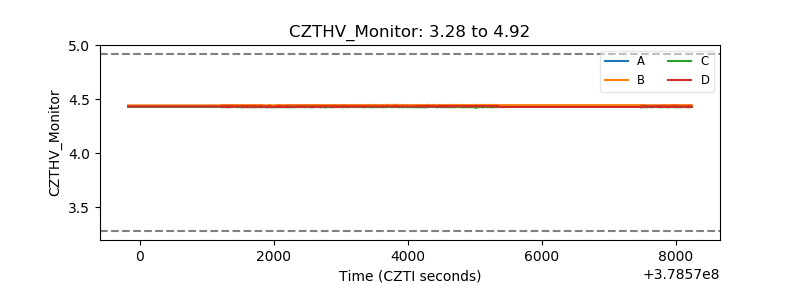 |
| D_VDD | 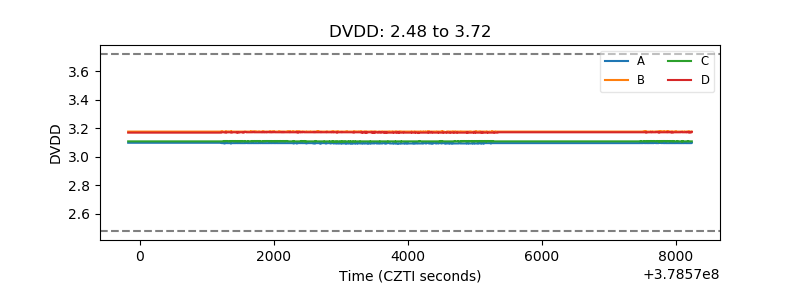 |
| Temperature 1 | 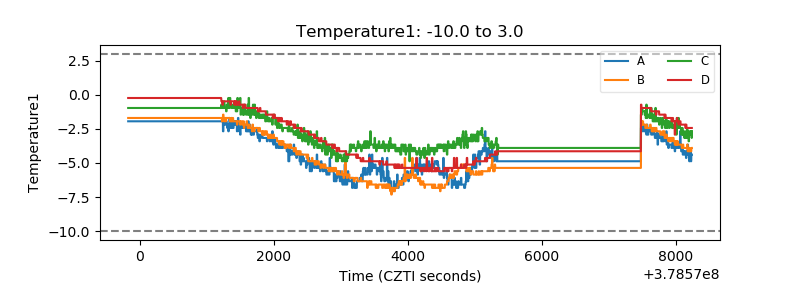 |
| Veto HV Monitor | 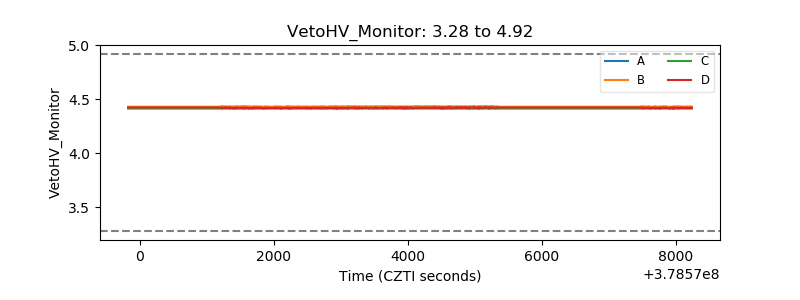 |
| Veto LLD |  |
| Alpha Counter | 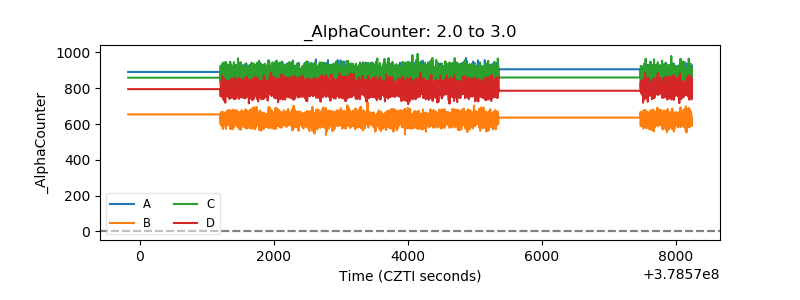 |
| _CPM_Rate | 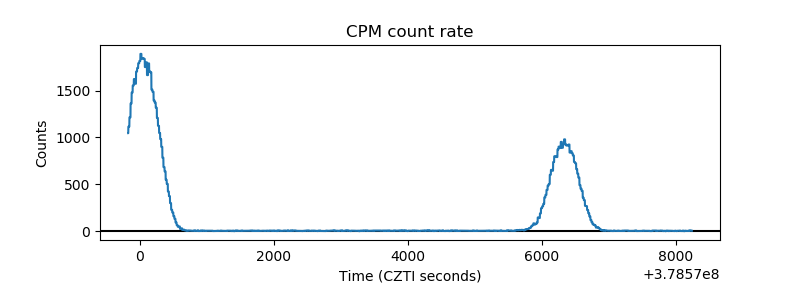 |
| CZT Counter | 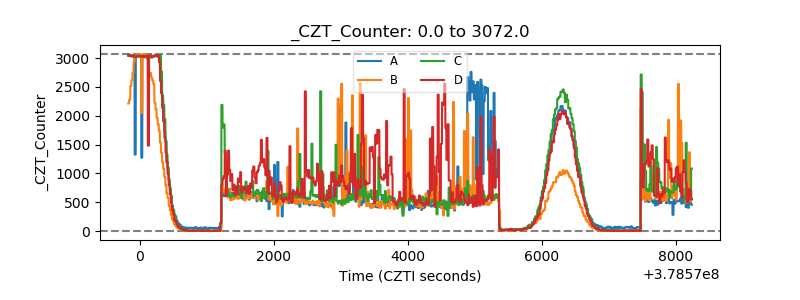 |
| +2.5 Volts monitor |  |
| +5 Volts monitor |  |
| _ROLL_ROT | 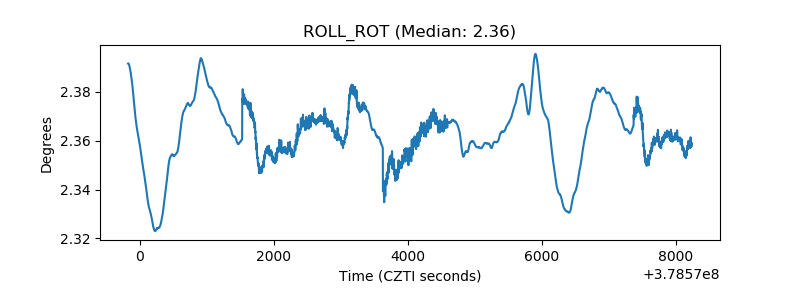 |
| _Roll_DEC | 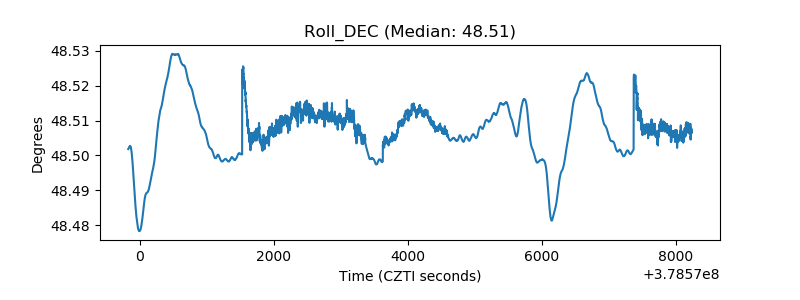 |
| _Roll_RA | 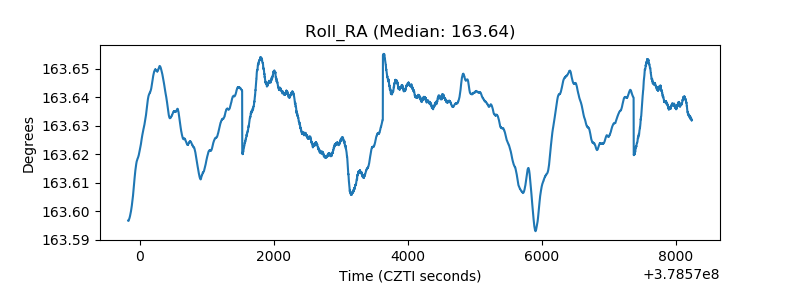 |
| Veto Counter | 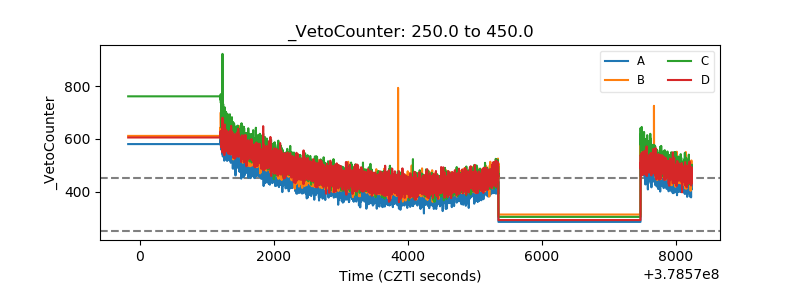 |