| Param | Original file | Final file |
|---|---|---|
| Filename | modeM0/AS1A11_106T03_9000004826_33831cztM0_level2.evt | modeM0/AS1A11_106T03_9000004826_33831cztM0_level2_quad_clean.evt |
| Size (bytes) | 448,850,880 | 87,209,280 |
| Size | 428.1 MB | 83.2 MB |
| Events in quadrant A | 2,383,483 | 583,040 |
| Events in quadrant B | 3,316,149 | 577,334 |
| Events in quadrant C | 3,254,245 | 577,697 |
| Events in quadrant D | 4,296,868 | 548,650 |
| Mode M9 | |||
|---|---|---|---|
| Quadrant | BADHDUFLAG | Total packets | Discarded packets |
| A | 0 | 35 | 0 |
| B | 0 | 35 | 0 |
| C | 0 | 35 | 0 |
| D | 0 | 36 | 0 |
| Mode SS | |||
|---|---|---|---|
| Quadrant | BADHDUFLAG | Total packets | Discarded packets |
| A | 0 | 102 | 0 |
| B | 0 | 102 | 0 |
| C | 0 | 102 | 0 |
| D | 0 | 102 | 0 |
| Mode M0 | |||
|---|---|---|---|
| Quadrant | BADHDUFLAG | Total packets | Discarded packets |
| A | 0 | 10271 | 3 |
| B | 0 | 13068 | 2 |
| C | 0 | 12860 | 2 |
| D | 0 | 16308 | 2 |
| Quadrant | Total seconds | Saturated seconds | Saturation percentage |
|---|---|---|---|
| A | 5057 | 8 | 0.158197% |
| B | 5057 | 256 | 5.062290% |
| C | 5057 | 98 | 1.937908% |
| D | 5057 | 170 | 3.361677% |
Noise dominated data is calculated using 1-second bins in cleaned event files. If a bin has >2000 counts, and if more than 50% of those come from <1% of pixels, then it is considered to be noise-dominated and hence unusable.
| Quadrant | # 1 sec bins | Bins with >0 counts | Bins with >2000 counts | High rate bins dominated by noise | Noise dominated (total time) | Noise dominated (detector-on time) | Marked lightcurve |
|---|---|---|---|---|---|---|---|
| A | 7029 | 5058 | 0 | 0 | 0.00% | 0.00% |  |
| B | 7029 | 5058 | 175 | 175 | 2.49% | 3.46% |  |
| C | 7029 | 5058 | 78 | 78 | 1.11% | 1.54% |  |
| D | 7029 | 5058 | 145 | 145 | 2.06% | 2.87% |  |
Top three noisy pixels from each quadrant. If the there are fewer than three noisy pixels in the level2.evt file, extra rows are filled as -1
| Pixel properties | Quadrant properties | ||||||
|---|---|---|---|---|---|---|---|
| Quadrant | DetID | PixID | Counts | Sigma | Mean | Median | Sigma |
| A | 13 | 6 | 27486 | 222.49 | 605 | 595 | 120.9 |
| A | 10 | 83 | 11330 | 88.82 | 605 | 595 | 120.9 |
| A | 13 | 254 | 9126 | 70.58 | 605 | 595 | 120.9 |
| B | 5 | 172 | 760178 | 6734.02 | 595 | 582 | 112.8 |
| B | 0 | 229 | 149250 | 1317.98 | 595 | 582 | 112.8 |
| B | 0 | 190 | 16465 | 140.81 | 595 | 582 | 112.8 |
| C | 3 | 233 | 326036 | 2407.72 | 589 | 595 | 135.2 |
| C | 15 | 214 | 218427 | 1611.59 | 589 | 595 | 135.2 |
| C | 0 | 10 | 173083 | 1276.12 | 589 | 595 | 135.2 |
| D | 8 | 195 | 1048216 | 6644.33 | 580 | 568 | 157.7 |
| D | 12 | 235 | 240560 | 1522.06 | 580 | 568 | 157.7 |
| D | 2 | 250 | 229922 | 1454.59 | 580 | 568 | 157.7 |
Histogram calculated using DETX and DETY for each event in the final _common_clean file
| Quadrant A |  |
 |
Quadrant B |
|---|---|---|---|
| Quadrant D |  |
 |
Quadrant C |
| Plot type | Count rate plots | Images |
|---|---|---|
| Comparison with Poisson distribution Blue bars denote a histogram of data divided into 1 sec bins. Red curve is a Poisson curve with rate = median count rate of data. |
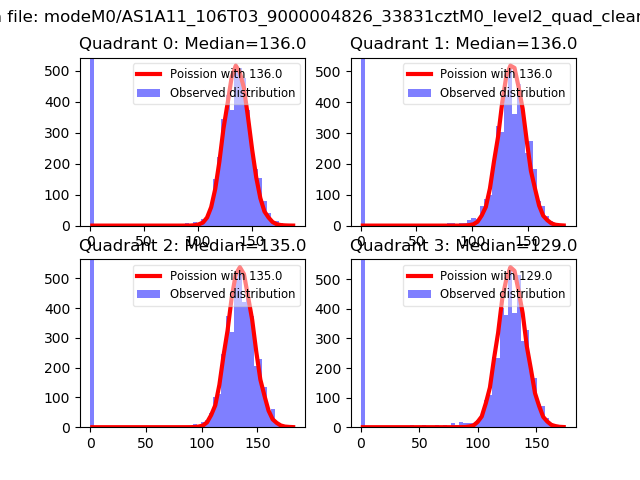 |
 |
| Quadrant-wise count rates Data is divided into 100 sec bins |
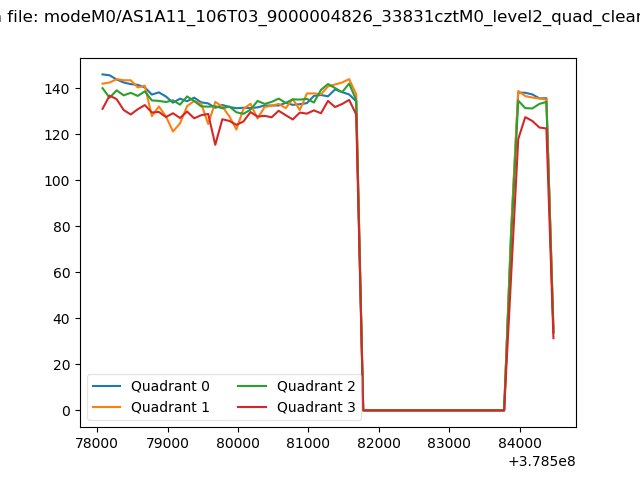 |
|
| Module-wise count rates for Quadrant A Data is divided into 100 sec bins |
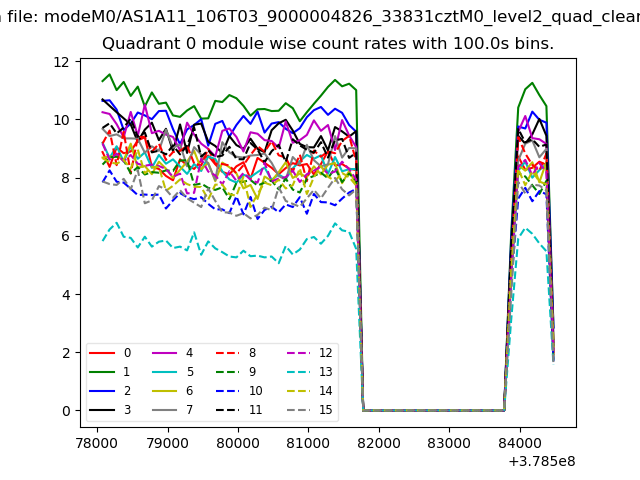 |
 |
| Module-wise count rates for Quadrant B Data is divided into 100 sec bins |
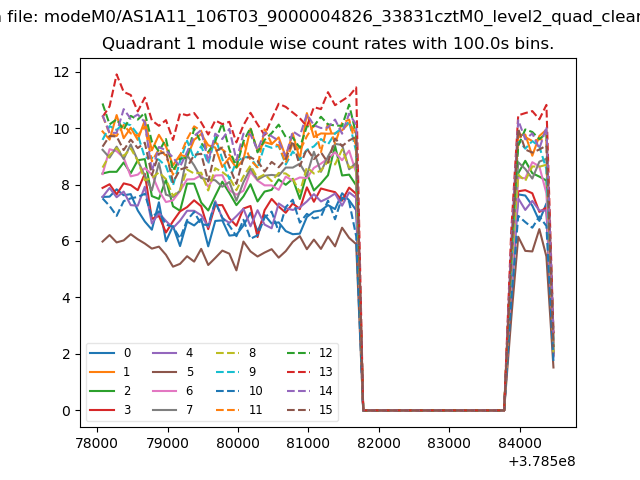 |
 |
| Module-wise count rates for Quadrant C Data is divided into 100 sec bins |
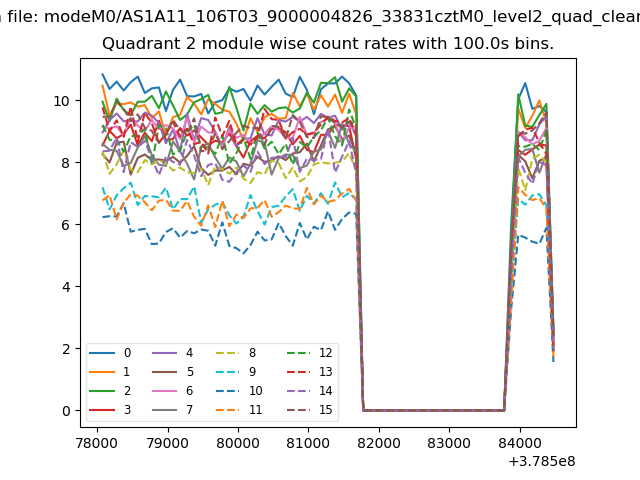 |
 |
| Module-wise count rates for Quadrant D Data is divided into 100 sec bins |
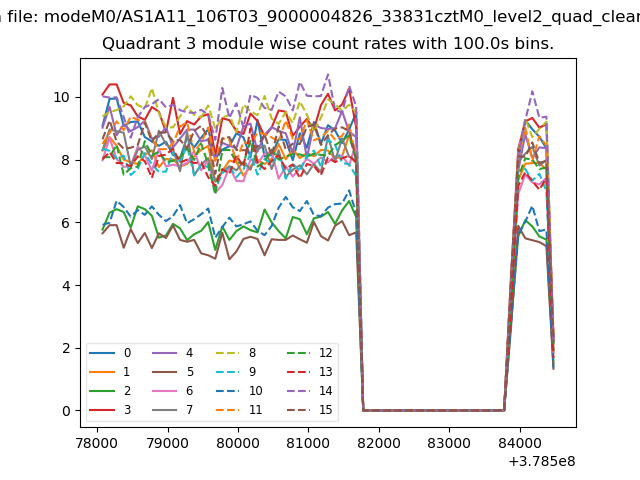 |
 |
| Parameter | Plot |
|---|---|
| CZT HV Monitor | 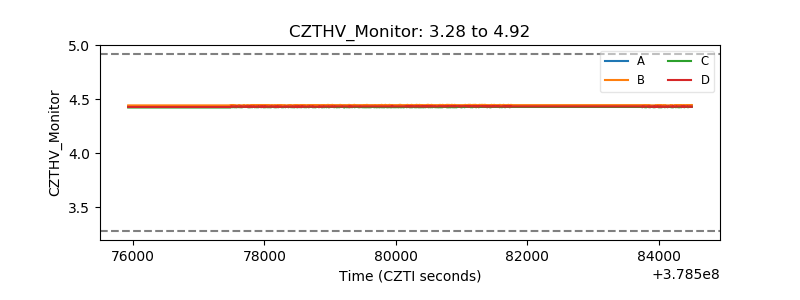 |
| D_VDD |  |
| Temperature 1 |  |
| Veto HV Monitor |  |
| Veto LLD |  |
| Alpha Counter | 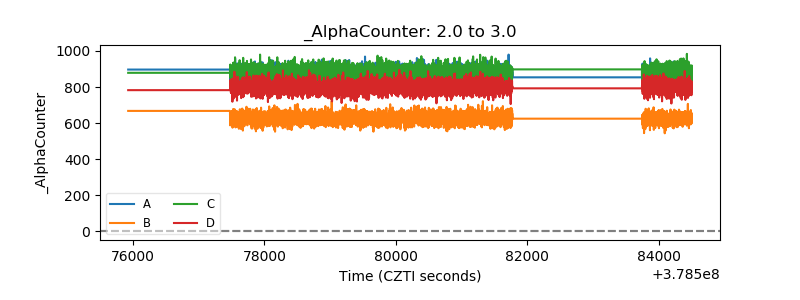 |
| _CPM_Rate | 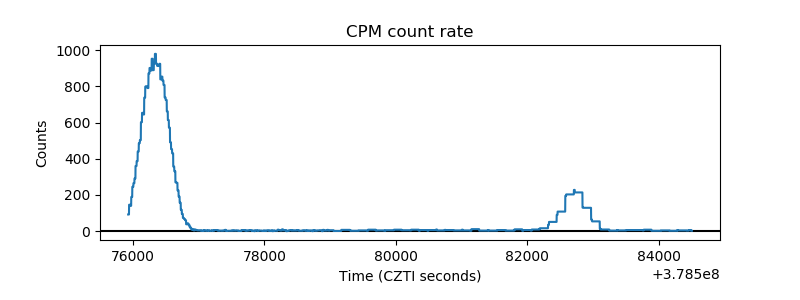 |
| CZT Counter |  |
| +2.5 Volts monitor |  |
| +5 Volts monitor |  |
| _ROLL_ROT | 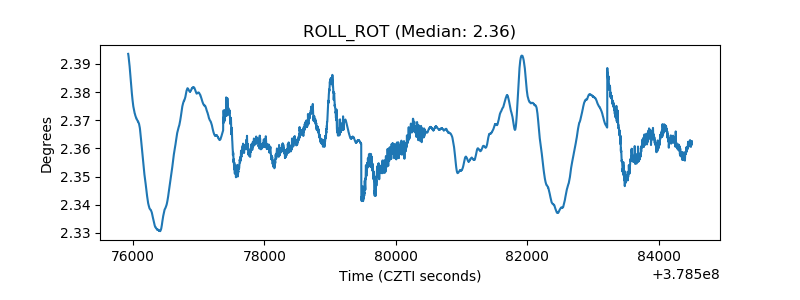 |
| _Roll_DEC |  |
| _Roll_RA |  |
| Veto Counter | 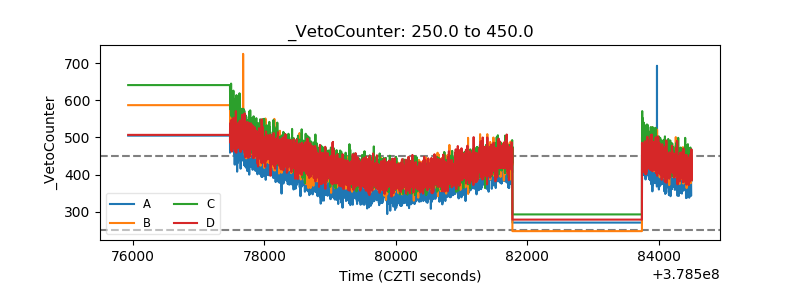 |