| Param | Original file | Final file |
|---|---|---|
| Filename | modeM0/AS1A11_106T03_9000004826_33832cztM0_level2.evt | modeM0/AS1A11_106T03_9000004826_33832cztM0_level2_quad_clean.evt |
| Size (bytes) | 68,149,440 | 14,777,280 |
| Size | 65.0 MB | 14.1 MB |
| Events in quadrant A | 364,512 | 99,127 |
| Events in quadrant B | 507,041 | 98,540 |
| Events in quadrant C | 571,109 | 94,431 |
| Events in quadrant D | 566,812 | 94,458 |
| Mode M9 | |||
|---|---|---|---|
| Quadrant | BADHDUFLAG | Total packets | Discarded packets |
| A | 0 | 7 | 2 |
| B | 0 | 6 | 1 |
| C | 0 | 5 | 0 |
| D | 0 | 6 | 1 |
| Mode SS | |||
|---|---|---|---|
| Quadrant | BADHDUFLAG | Total packets | Discarded packets |
| A | 0 | 17 | 1 |
| B | 0 | 17 | 1 |
| C | 0 | 16 | 0 |
| D | 0 | 16 | 0 |
| Mode M0 | |||
|---|---|---|---|
| Quadrant | BADHDUFLAG | Total packets | Discarded packets |
| A | 0 | 1576 | 39 |
| B | 0 | 2013 | 37 |
| C | 0 | 2199 | 41 |
| D | 0 | 2240 | 34 |
| Quadrant | Total seconds | Saturated seconds | Saturation percentage |
|---|---|---|---|
| A | 753 | 1 | 0.132802% |
| B | 753 | 30 | 3.984064% |
| C | 753 | 46 | 6.108898% |
| D | 752 | 1 | 0.132979% |
Noise dominated data is calculated using 1-second bins in cleaned event files. If a bin has >2000 counts, and if more than 50% of those come from <1% of pixels, then it is considered to be noise-dominated and hence unusable.
| Quadrant | # 1 sec bins | Bins with >0 counts | Bins with >2000 counts | High rate bins dominated by noise | Noise dominated (total time) | Noise dominated (detector-on time) | Marked lightcurve |
|---|---|---|---|---|---|---|---|
| A | 753 | 753 | 0 | 0 | 0.00% | 0.00% | 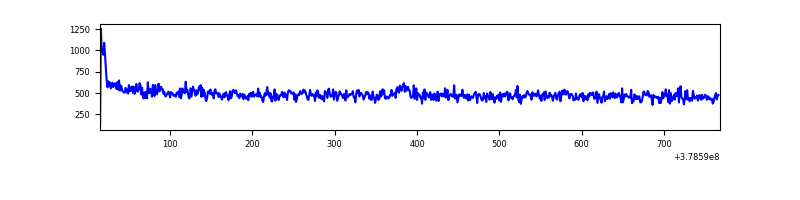 |
| B | 753 | 753 | 18 | 18 | 2.39% | 2.39% | 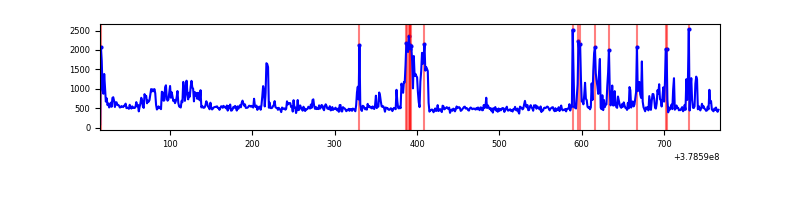 |
| C | 753 | 753 | 29 | 29 | 3.85% | 3.85% | 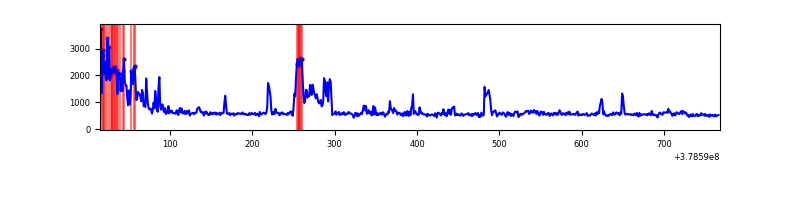 |
| D | 753 | 753 | 0 | 0 | 0.00% | 0.00% | 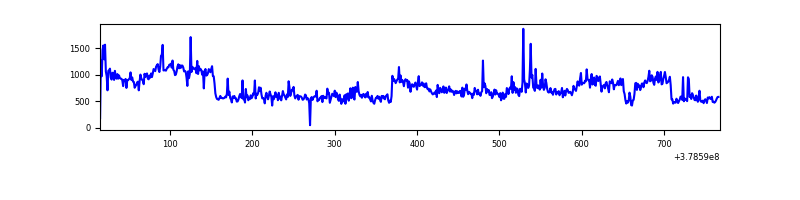 |
Top three noisy pixels from each quadrant. If the there are fewer than three noisy pixels in the level2.evt file, extra rows are filled as -1
| Pixel properties | Quadrant properties | ||||||
|---|---|---|---|---|---|---|---|
| Quadrant | DetID | PixID | Counts | Sigma | Mean | Median | Sigma |
| A | 13 | 6 | 5974 | 293.7 | 90 | 89 | 20.0 |
| A | 10 | 83 | 4707 | 230.47 | 90 | 89 | 20.0 |
| A | 13 | 254 | 1251 | 57.99 | 90 | 89 | 20.0 |
| B | 5 | 172 | 65658 | 3340.76 | 90 | 88 | 19.6 |
| B | 5 | 200 | 31921 | 1621.87 | 90 | 88 | 19.6 |
| B | 0 | 190 | 23899 | 1213.16 | 90 | 88 | 19.6 |
| C | 0 | 10 | 90798 | 4056.55 | 88 | 88 | 22.4 |
| C | 9 | 187 | 55929 | 2497.21 | 88 | 88 | 22.4 |
| C | 15 | 214 | 36396 | 1623.69 | 88 | 88 | 22.4 |
| D | 8 | 195 | 178082 | 7218.75 | 89 | 86 | 24.7 |
| D | 12 | 235 | 13026 | 524.79 | 89 | 86 | 24.7 |
| D | 2 | 152 | 7310 | 292.97 | 89 | 86 | 24.7 |
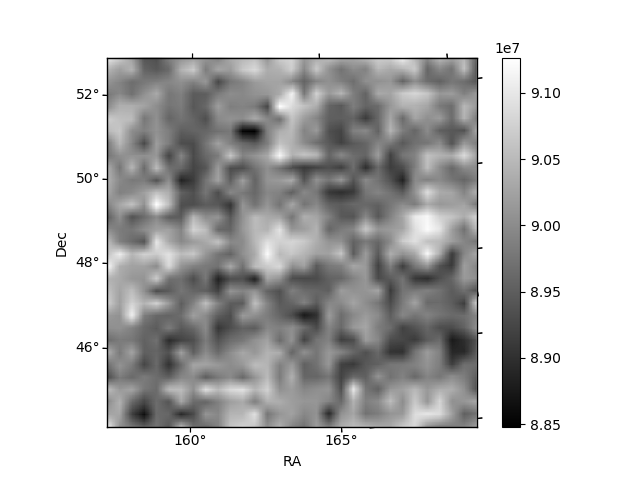
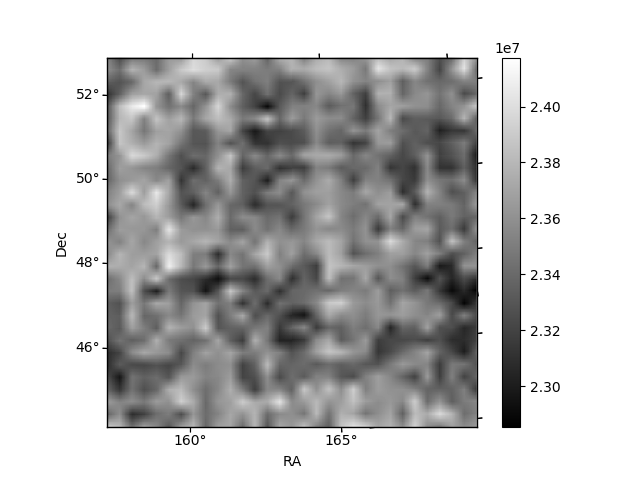
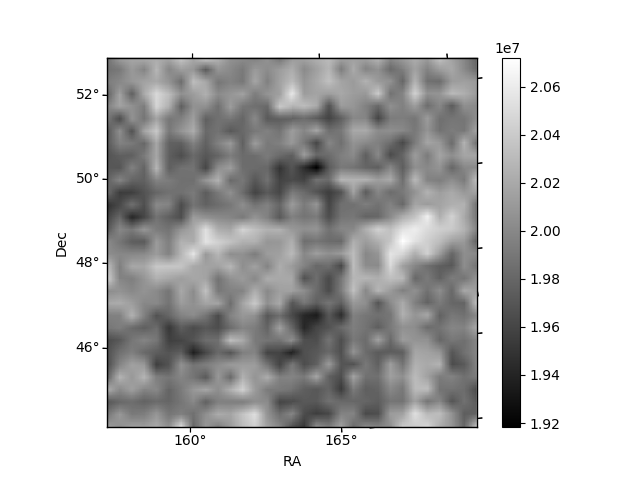
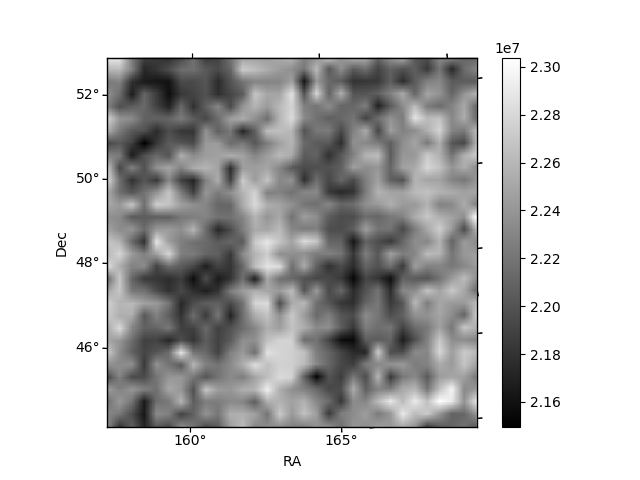
Histogram calculated using DETX and DETY for each event in the final _common_clean file
| Quadrant A | 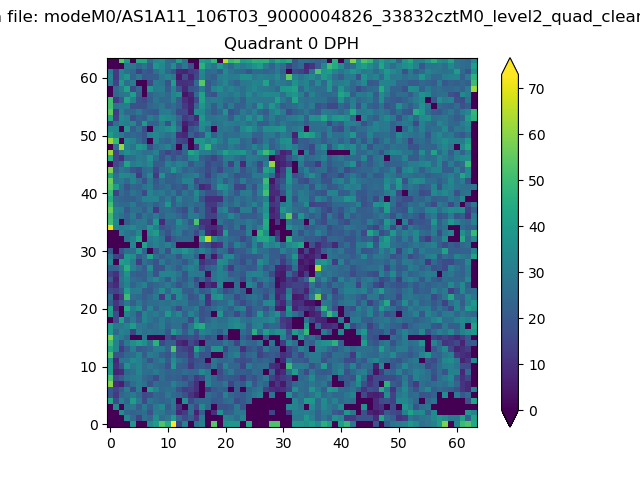 |
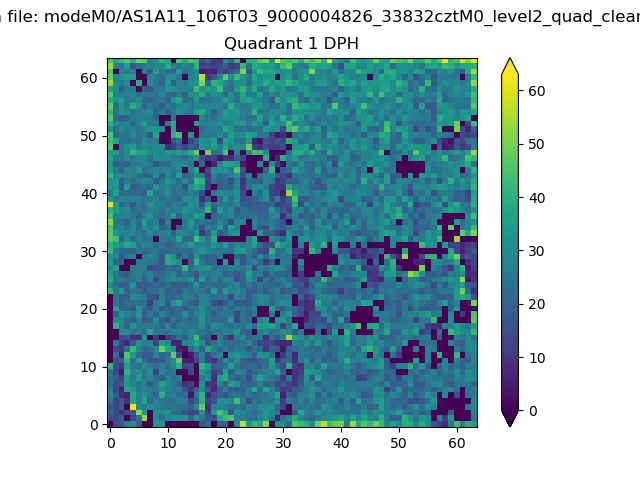 |
Quadrant B |
|---|---|---|---|
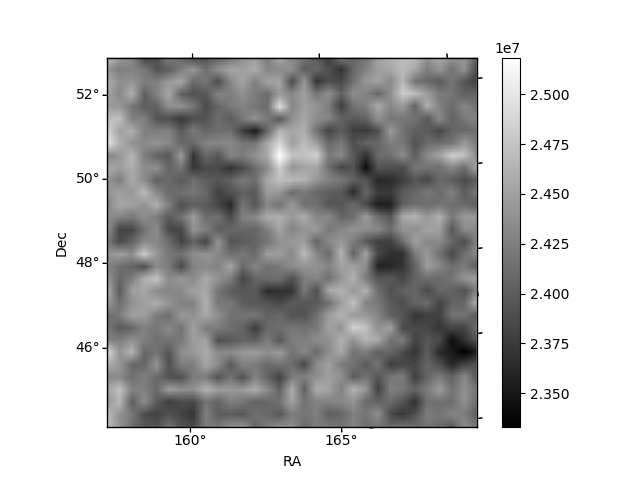
| Quadrant D | 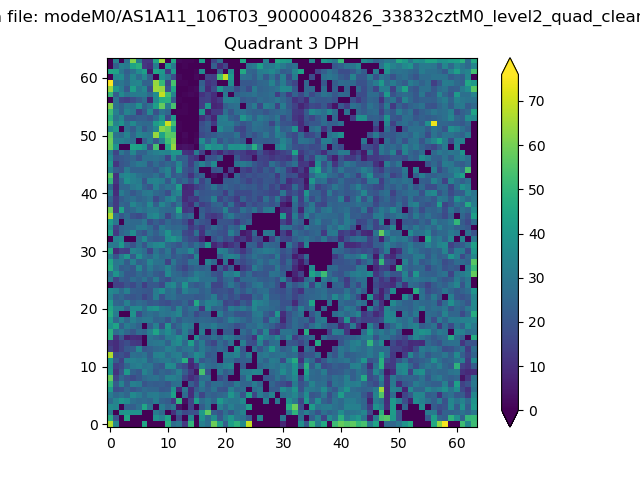 |
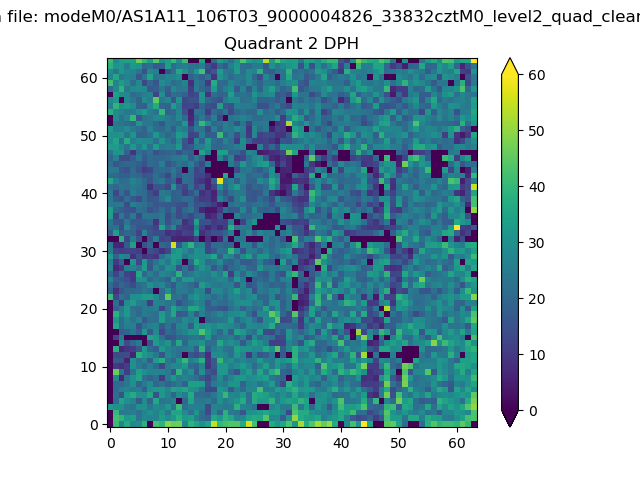 |
Quadrant C |
| Plot type | Count rate plots | Images |
|---|---|---|
| Comparison with Poisson distribution Blue bars denote a histogram of data divided into 1 sec bins. Red curve is a Poisson curve with rate = median count rate of data. |
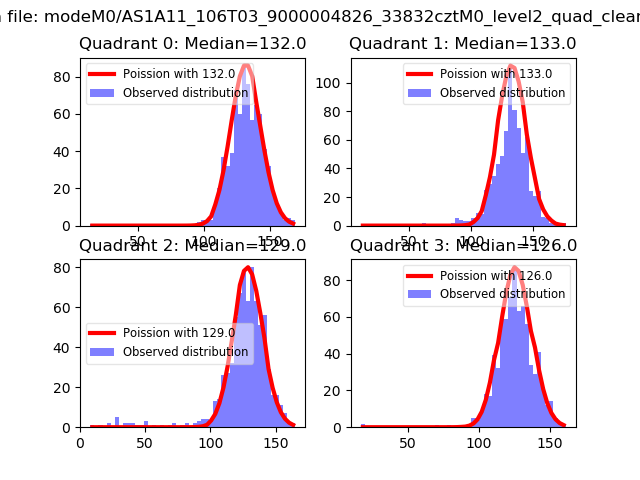 |
 |
| Quadrant-wise count rates Data is divided into 100 sec bins |
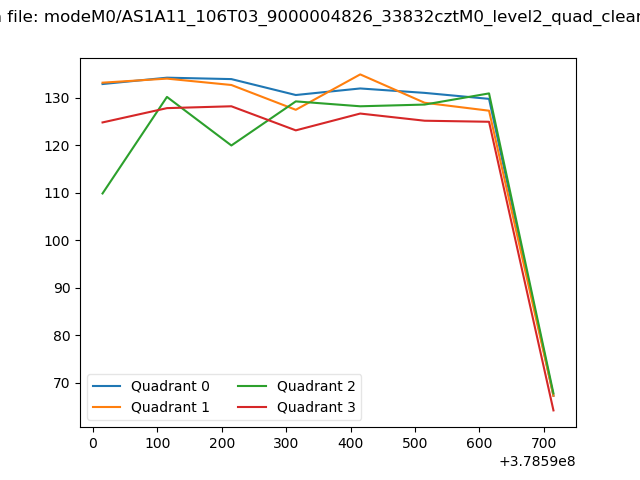 |
|
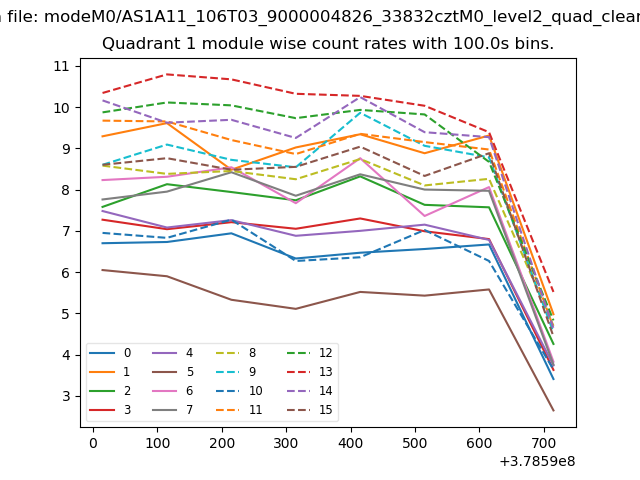
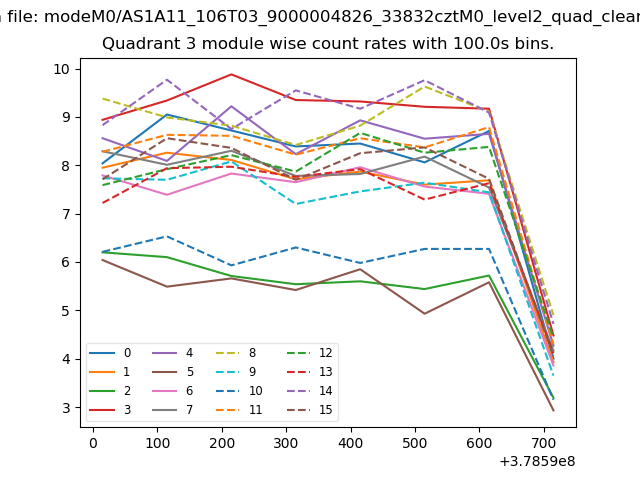
| Module-wise count rates for Quadrant A Data is divided into 100 sec bins |
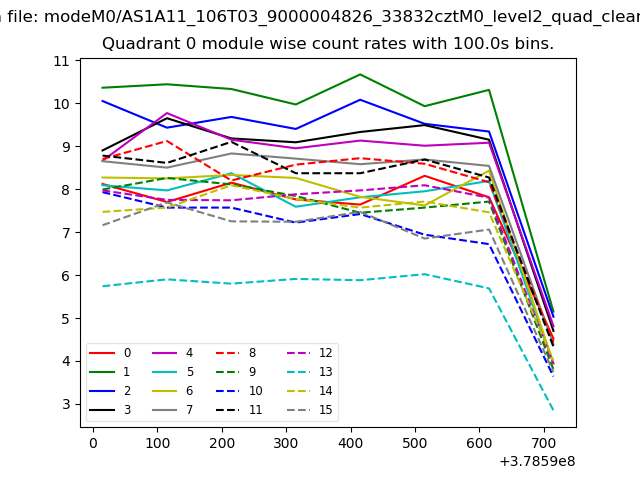 |
 |
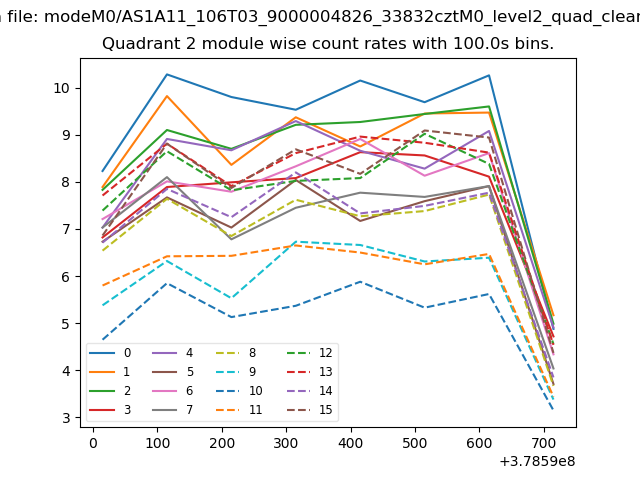
| Module-wise count rates for Quadrant B Data is divided into 100 sec bins |
 |
 |
| Module-wise count rates for Quadrant C Data is divided into 100 sec bins |
 |
 |
| Module-wise count rates for Quadrant D Data is divided into 100 sec bins |
 |
 |
| Parameter | Plot |
|---|---|
| CZT HV Monitor | 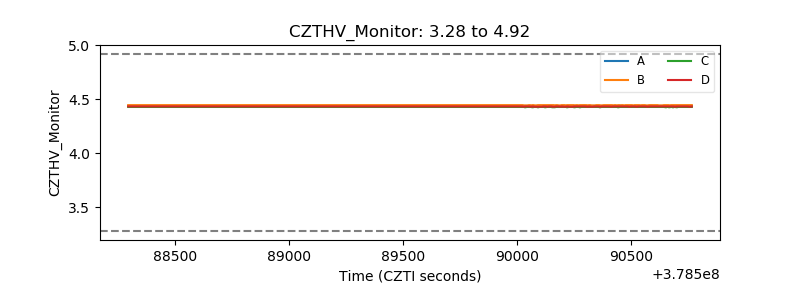 |
| D_VDD | 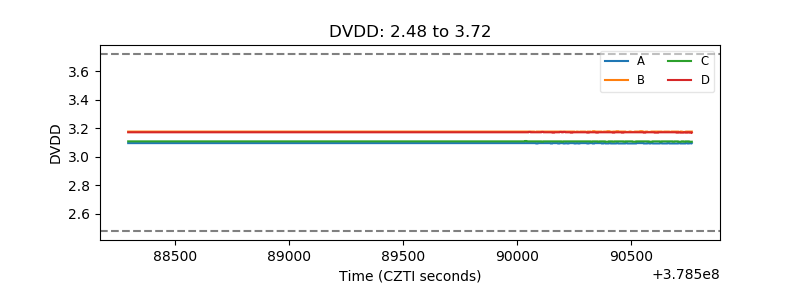 |
| Temperature 1 | 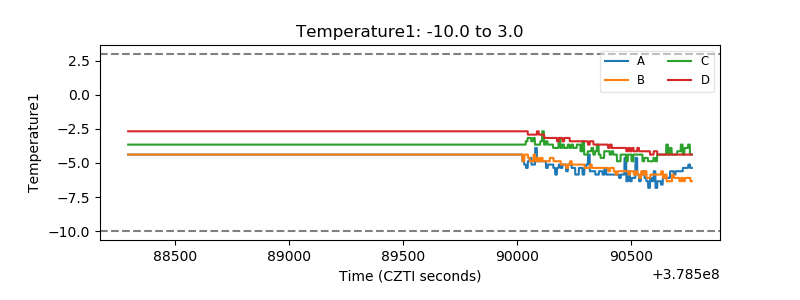 |
| Veto HV Monitor | 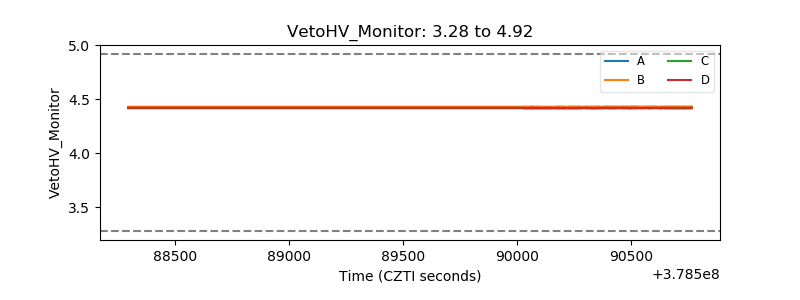 |
| Veto LLD | 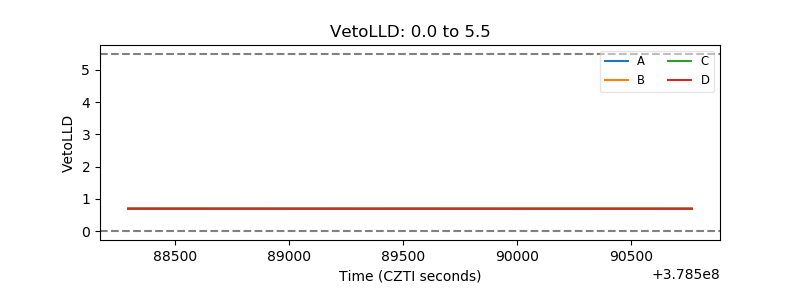 |
| Alpha Counter | 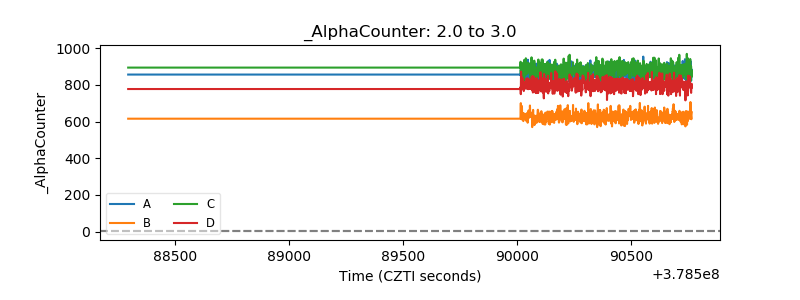 |
| _CPM_Rate | 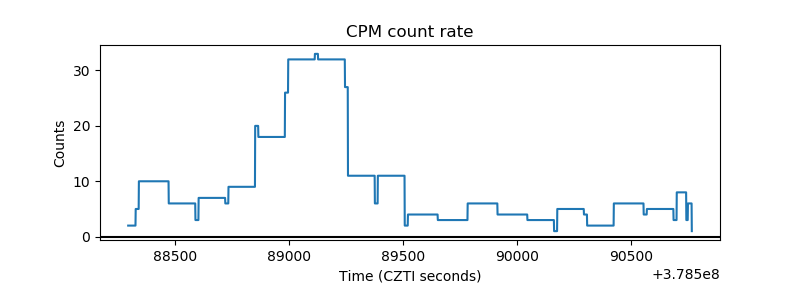 |
| CZT Counter | 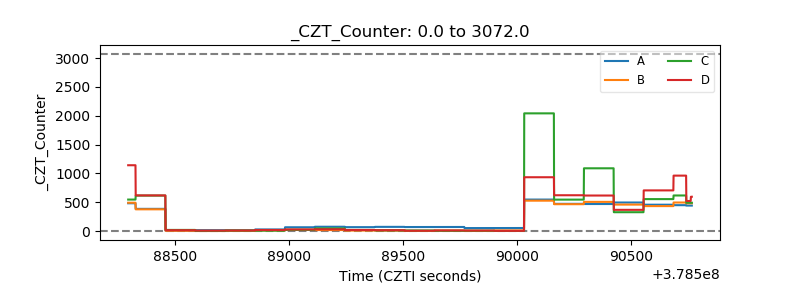 |
| +2.5 Volts monitor |  |
| +5 Volts monitor |  |
| _ROLL_ROT | 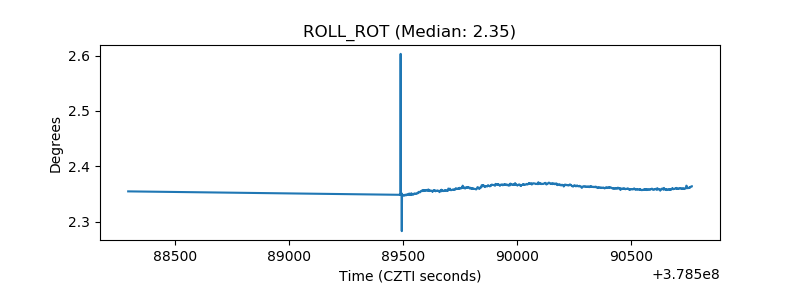 |
| _Roll_DEC | 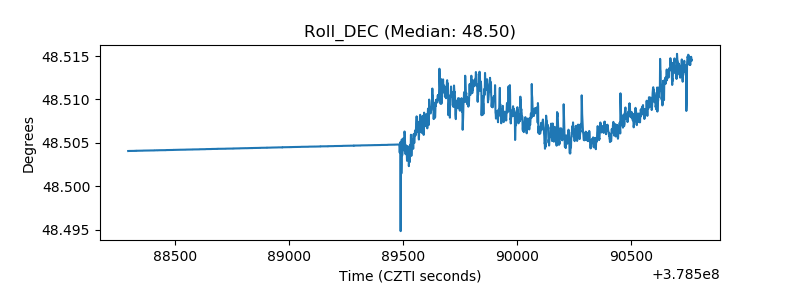 |
| _Roll_RA | 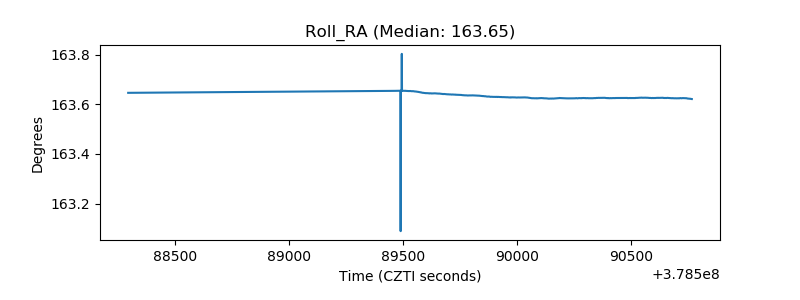 |
| Veto Counter | 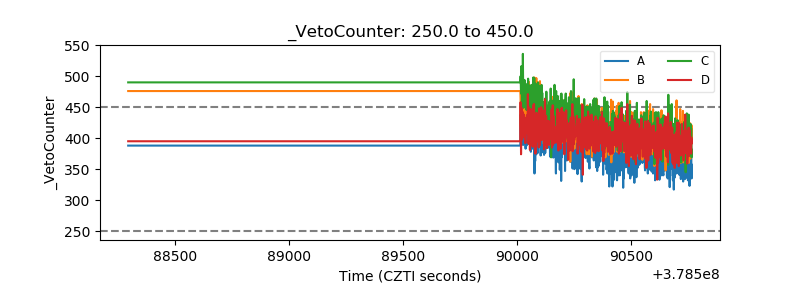 |