| Param | Original file | Final file |
|---|---|---|
| Filename | modeM0/AS1A11_106T03_9000004826_33834cztM0_level2.evt | modeM0/AS1A11_106T03_9000004826_33834cztM0_level2_quad_clean.evt |
| Size (bytes) | 534,781,440 | 81,446,400 |
| Size | 510.0 MB | 77.7 MB |
| Events in quadrant A | 2,862,148 | 519,227 |
| Events in quadrant B | 4,334,482 | 501,733 |
| Events in quadrant C | 3,632,830 | 513,746 |
| Events in quadrant D | 4,939,225 | 491,585 |
| Mode M9 | |||
|---|---|---|---|
| Quadrant | BADHDUFLAG | Total packets | Discarded packets |
| A | 0 | 27 | 0 |
| B | 0 | 27 | 0 |
| C | 0 | 27 | 0 |
| D | 0 | 27 | 0 |
| Mode SS | |||
|---|---|---|---|
| Quadrant | BADHDUFLAG | Total packets | Discarded packets |
| A | 0 | 130 | 0 |
| B | 0 | 130 | 0 |
| C | 0 | 130 | 0 |
| D | 0 | 130 | 0 |
| Mode M0 | |||
|---|---|---|---|
| Quadrant | BADHDUFLAG | Total packets | Discarded packets |
| A | 0 | 12785 | 3 |
| B | 0 | 17178 | 2 |
| C | 0 | 14880 | 2 |
| D | 0 | 19069 | 2 |
| Quadrant | Total seconds | Saturated seconds | Saturation percentage |
|---|---|---|---|
| A | 6302 | 5 | 0.079340% |
| B | 6302 | 417 | 6.616947% |
| C | 6302 | 111 | 1.761346% |
| D | 6302 | 190 | 3.014916% |
Noise dominated data is calculated using 1-second bins in cleaned event files. If a bin has >2000 counts, and if more than 50% of those come from <1% of pixels, then it is considered to be noise-dominated and hence unusable.
| Quadrant | # 1 sec bins | Bins with >0 counts | Bins with >2000 counts | High rate bins dominated by noise | Noise dominated (total time) | Noise dominated (detector-on time) | Marked lightcurve |
|---|---|---|---|---|---|---|---|
| A | 8988 | 6304 | 0 | 0 | 0.00% | 0.00% | 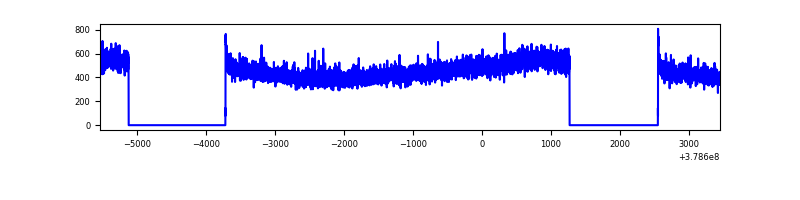 |
| B | 8988 | 6304 | 302 | 302 | 3.36% | 4.79% | 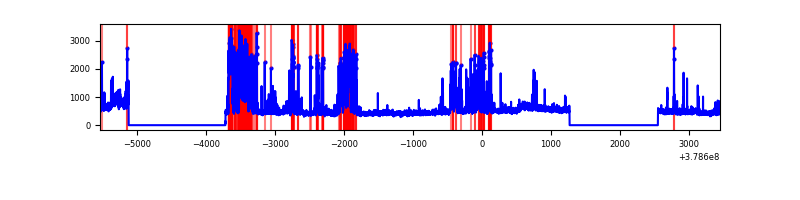 |
| C | 8988 | 6304 | 92 | 92 | 1.02% | 1.46% | 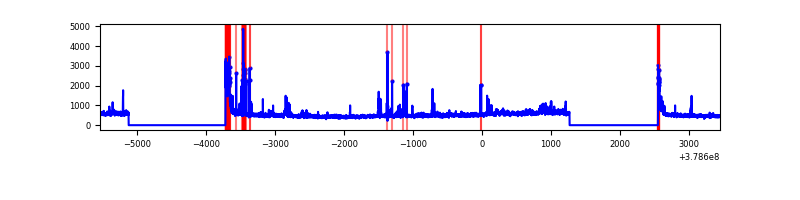 |
| D | 8988 | 6304 | 149 | 149 | 1.66% | 2.36% | 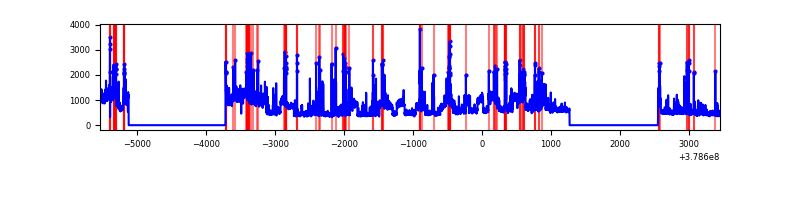 |
Top three noisy pixels from each quadrant. If the there are fewer than three noisy pixels in the level2.evt file, extra rows are filled as -1
| Pixel properties | Quadrant properties | ||||||
|---|---|---|---|---|---|---|---|
| Quadrant | DetID | PixID | Counts | Sigma | Mean | Median | Sigma |
| A | 13 | 6 | 27414 | 181.75 | 731 | 716 | 146.9 |
| A | 13 | 254 | 11568 | 73.88 | 731 | 716 | 146.9 |
| A | 10 | 83 | 10779 | 68.51 | 731 | 716 | 146.9 |
| B | 5 | 172 | 905172 | 6591.71 | 711 | 693 | 137.2 |
| B | 4 | 251 | 400609 | 2914.53 | 711 | 693 | 137.2 |
| B | 0 | 219 | 60513 | 435.96 | 711 | 693 | 137.2 |
| C | 15 | 214 | 268676 | 1652.38 | 704 | 709 | 162.2 |
| C | 0 | 10 | 254563 | 1565.35 | 704 | 709 | 162.2 |
| C | 3 | 233 | 100517 | 615.45 | 704 | 709 | 162.2 |
| D | 8 | 195 | 1362689 | 7861.62 | 704 | 683 | 173.2 |
| D | 12 | 6 | 219465 | 1262.83 | 704 | 683 | 173.2 |
| D | 2 | 249 | 177721 | 1021.88 | 704 | 683 | 173.2 |
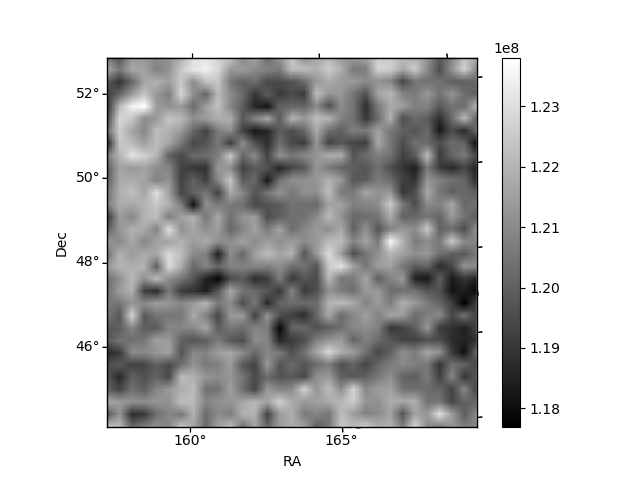
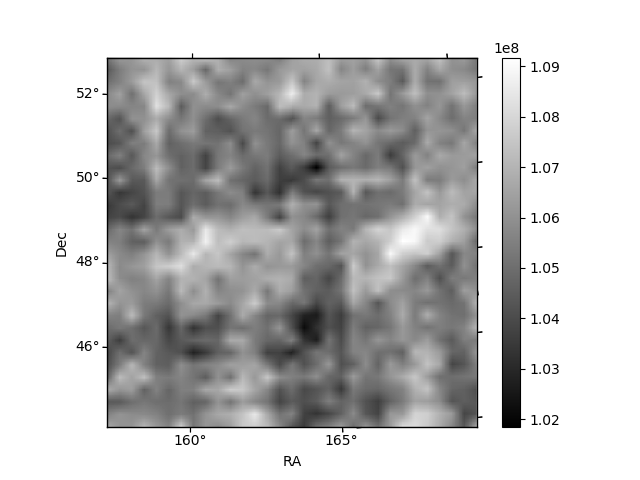
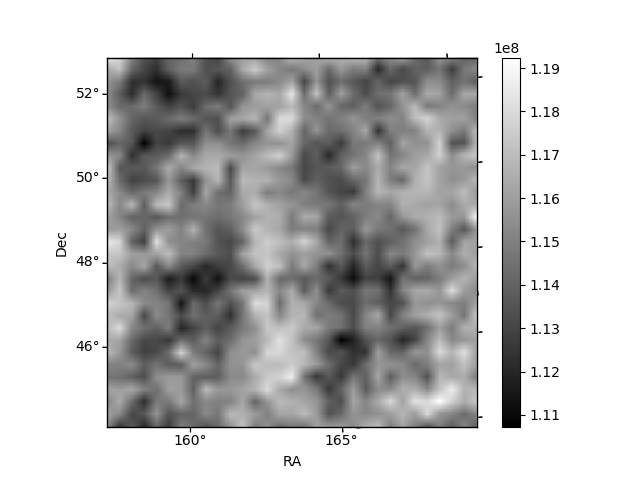
Histogram calculated using DETX and DETY for each event in the final _common_clean file
| Quadrant A |  |
 |
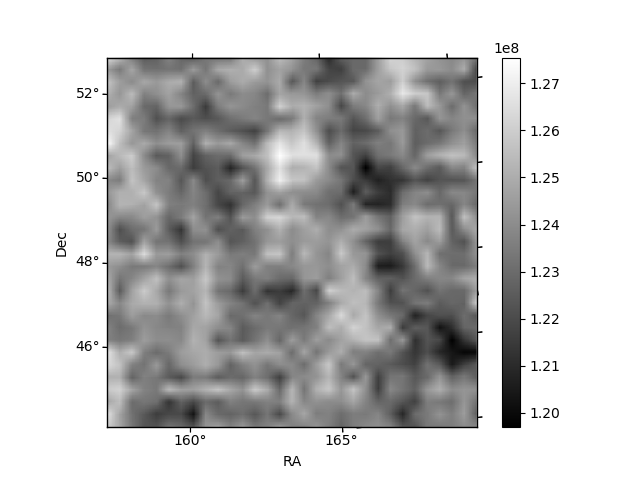
Quadrant B |
|---|---|---|---|
| Quadrant D | 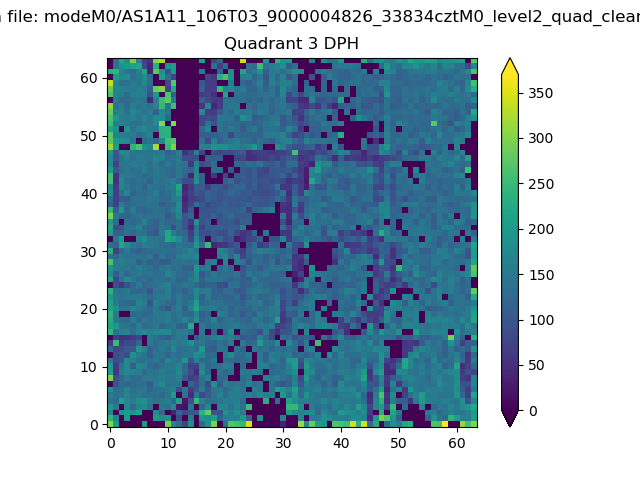 |
 |
Quadrant C |
| Plot type | Count rate plots | Images |
|---|---|---|
| Comparison with Poisson distribution Blue bars denote a histogram of data divided into 1 sec bins. Red curve is a Poisson curve with rate = median count rate of data. |
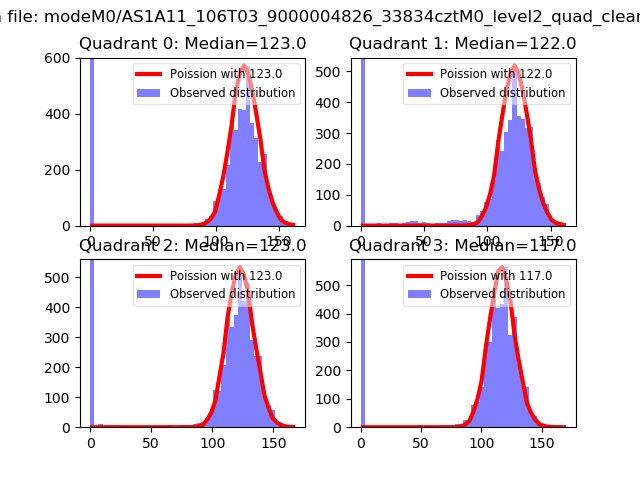 |
 |
| Quadrant-wise count rates Data is divided into 100 sec bins |
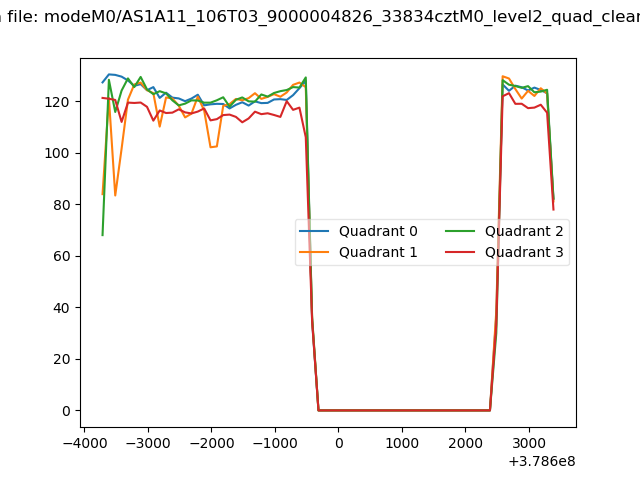 |
|
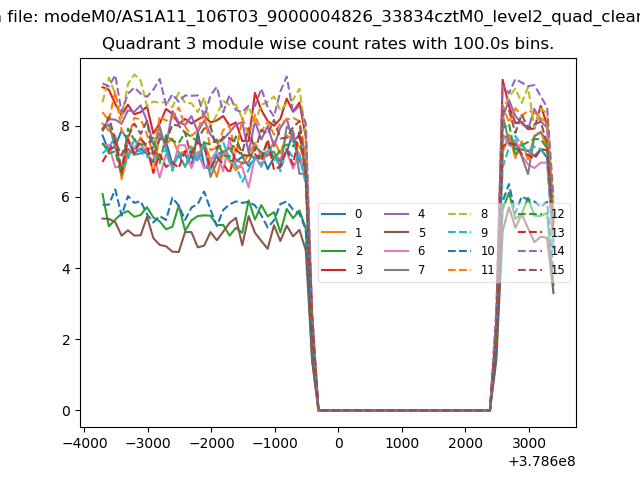
| Module-wise count rates for Quadrant A Data is divided into 100 sec bins |
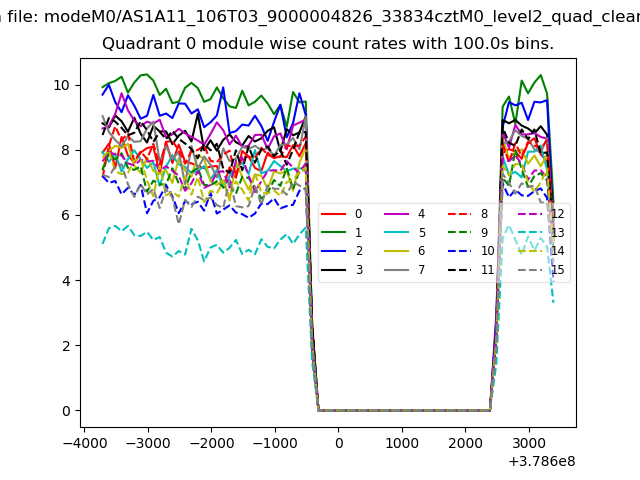 |
 |
| Module-wise count rates for Quadrant B Data is divided into 100 sec bins |
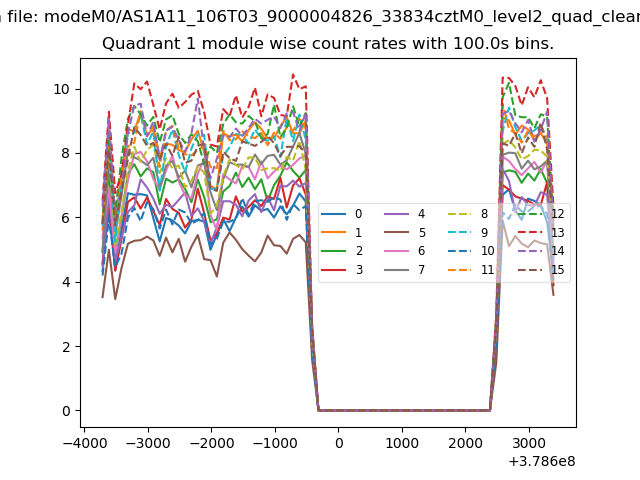 |
 |
| Module-wise count rates for Quadrant C Data is divided into 100 sec bins |
 |
 |
| Module-wise count rates for Quadrant D Data is divided into 100 sec bins |
 |
 |
| Parameter | Plot |
|---|---|
| CZT HV Monitor |  |
| D_VDD | 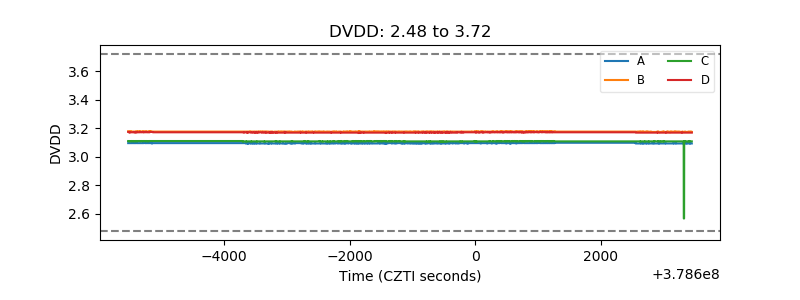 |
| Temperature 1 | 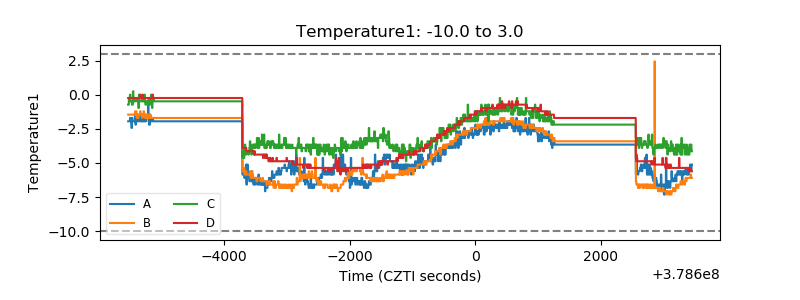 |
| Veto HV Monitor | 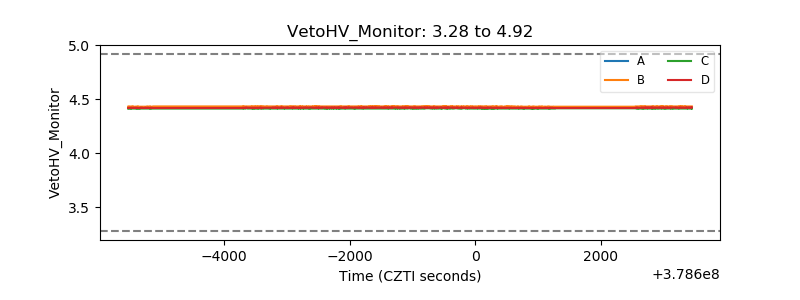 |
| Veto LLD | 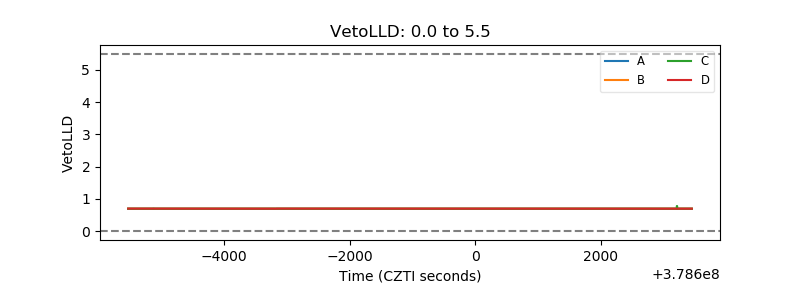 |
| Alpha Counter | 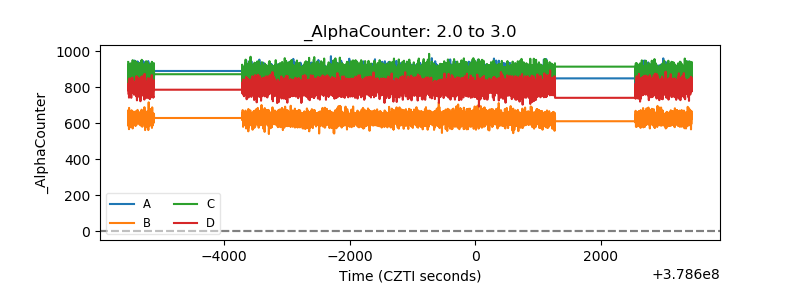 |
| _CPM_Rate | 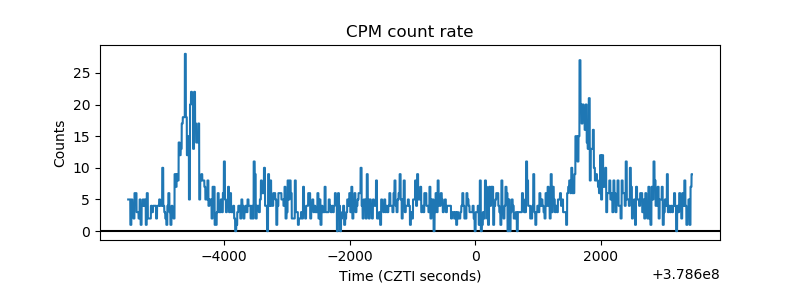 |
| CZT Counter | 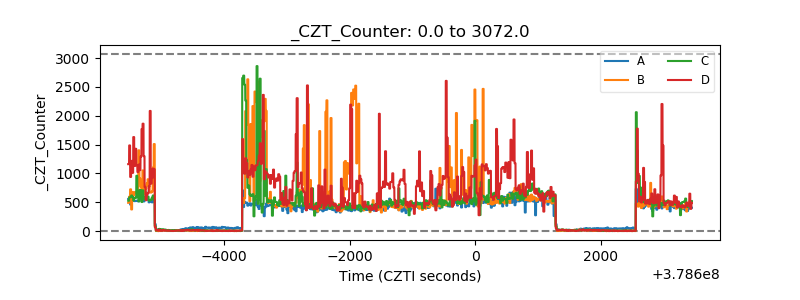 |
| +2.5 Volts monitor |  |
| +5 Volts monitor |  |
| _ROLL_ROT | 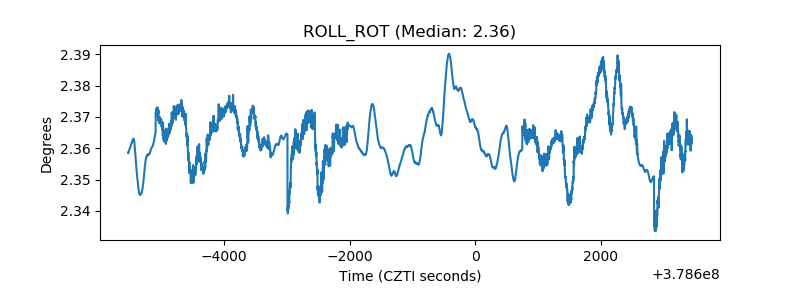 |
| _Roll_DEC | 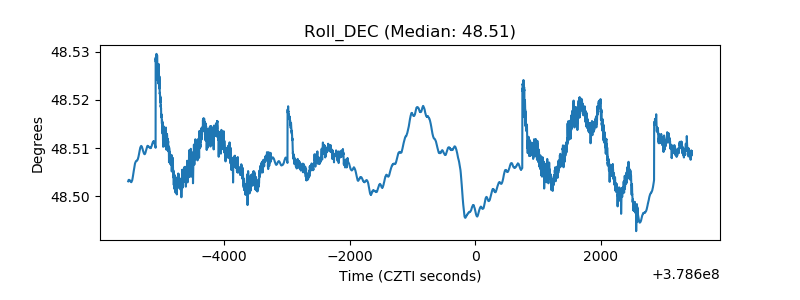 |
| _Roll_RA | 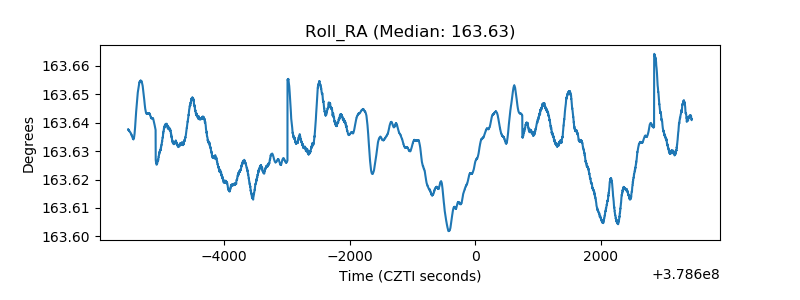 |
| Veto Counter | 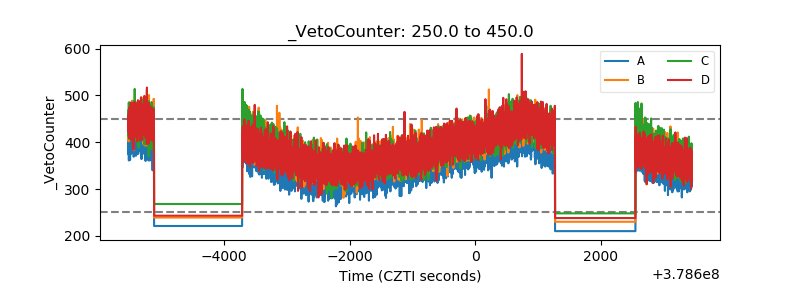 |