| Param | Original file | Final file |
|---|---|---|
| Filename | modeM0/AS1A11_106T03_9000004826_33838cztM0_level2.evt | modeM0/AS1A11_106T03_9000004826_33838cztM0_level2_quad_clean.evt |
| Size (bytes) | 527,068,800 | 75,695,040 |
| Size | 502.7 MB | 72.2 MB |
| Events in quadrant A | 3,701,910 | 482,321 |
| Events in quadrant B | 3,043,696 | 487,865 |
| Events in quadrant C | 3,183,225 | 483,475 |
| Events in quadrant D | 5,655,169 | 447,408 |
| Mode M9 | |||
|---|---|---|---|
| Quadrant | BADHDUFLAG | Total packets | Discarded packets |
| A | 0 | 27 | 0 |
| B | 0 | 27 | 0 |
| C | 0 | 27 | 0 |
| D | 0 | 28 | 0 |
| Mode SS | |||
|---|---|---|---|
| Quadrant | BADHDUFLAG | Total packets | Discarded packets |
| A | 0 | 112 | 0 |
| B | 0 | 112 | 0 |
| C | 0 | 112 | 0 |
| D | 0 | 112 | 0 |
| Mode M0 | |||
|---|---|---|---|
| Quadrant | BADHDUFLAG | Total packets | Discarded packets |
| A | 0 | 15430 | 3 |
| B | 0 | 12528 | 2 |
| C | 0 | 12894 | 2 |
| D | 0 | 20659 | 2 |
| Quadrant | Total seconds | Saturated seconds | Saturation percentage |
|---|---|---|---|
| A | 5594 | 7 | 0.125134% |
| B | 5594 | 76 | 1.358598% |
| C | 5594 | 43 | 0.768681% |
| D | 5594 | 608 | 10.868788% |
Noise dominated data is calculated using 1-second bins in cleaned event files. If a bin has >2000 counts, and if more than 50% of those come from <1% of pixels, then it is considered to be noise-dominated and hence unusable.
| Quadrant | # 1 sec bins | Bins with >0 counts | Bins with >2000 counts | High rate bins dominated by noise | Noise dominated (total time) | Noise dominated (detector-on time) | Marked lightcurve |
|---|---|---|---|---|---|---|---|
| A | 7207 | 5595 | 0 | 0 | 0.00% | 0.00% | 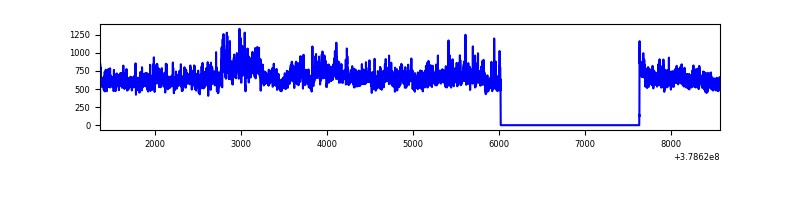 |
| B | 7207 | 5595 | 49 | 49 | 0.68% | 0.88% | 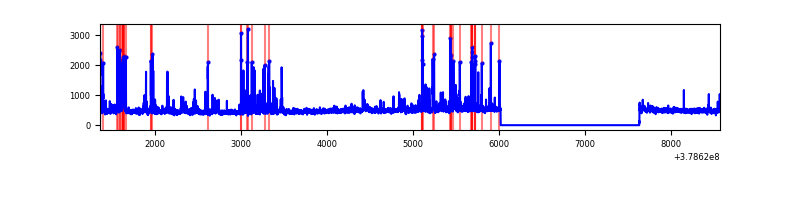 |
| C | 7207 | 5595 | 32 | 32 | 0.44% | 0.57% | 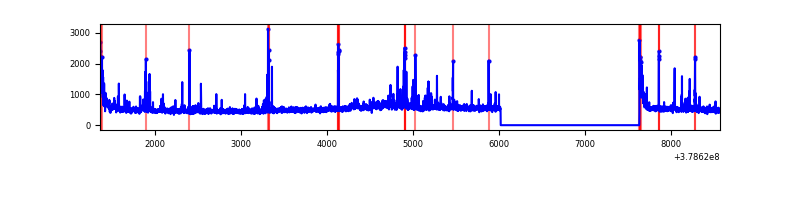 |
| D | 7207 | 5595 | 550 | 550 | 7.63% | 9.83% | 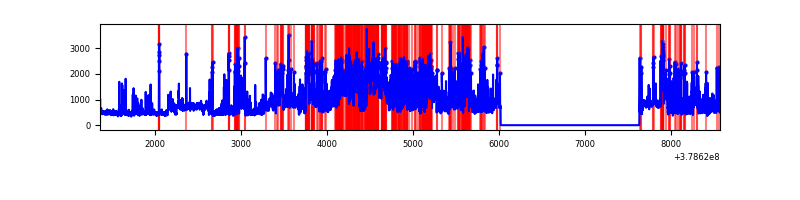 |
Top three noisy pixels from each quadrant. If the there are fewer than three noisy pixels in the level2.evt file, extra rows are filled as -1
| Pixel properties | Quadrant properties | ||||||
|---|---|---|---|---|---|---|---|
| Quadrant | DetID | PixID | Counts | Sigma | Mean | Median | Sigma |
| A | 15 | 169 | 1142256 | 8690.12 | 657 | 645 | 131.4 |
| A | 13 | 6 | 12217 | 88.09 | 657 | 645 | 131.4 |
| A | 10 | 83 | 10741 | 76.85 | 657 | 645 | 131.4 |
| B | 5 | 172 | 293646 | 2365.66 | 648 | 632 | 123.9 |
| B | 4 | 251 | 88154 | 706.61 | 648 | 632 | 123.9 |
| B | 4 | 81 | 29352 | 231.87 | 648 | 632 | 123.9 |
| C | 15 | 214 | 245366 | 1666.66 | 634 | 638 | 146.8 |
| C | 3 | 233 | 129039 | 874.44 | 634 | 638 | 146.8 |
| C | 14 | 254 | 109276 | 739.85 | 634 | 638 | 146.8 |
| D | 12 | 235 | 1256274 | 8289.57 | 618 | 601 | 151.5 |
| D | 8 | 195 | 720775 | 4754.37 | 618 | 601 | 151.5 |
| D | 2 | 250 | 583207 | 3846.19 | 618 | 601 | 151.5 |
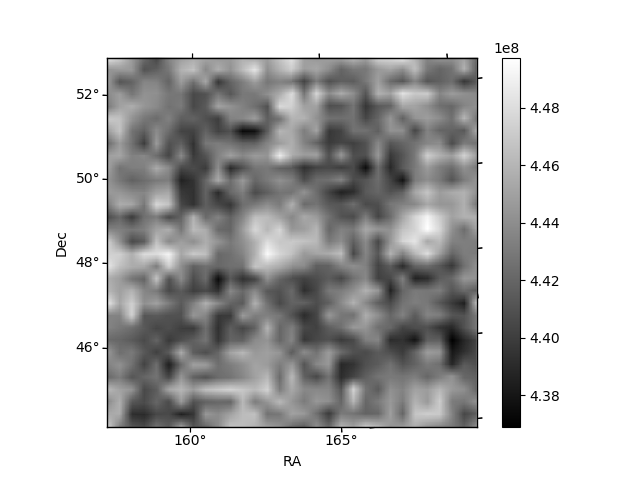
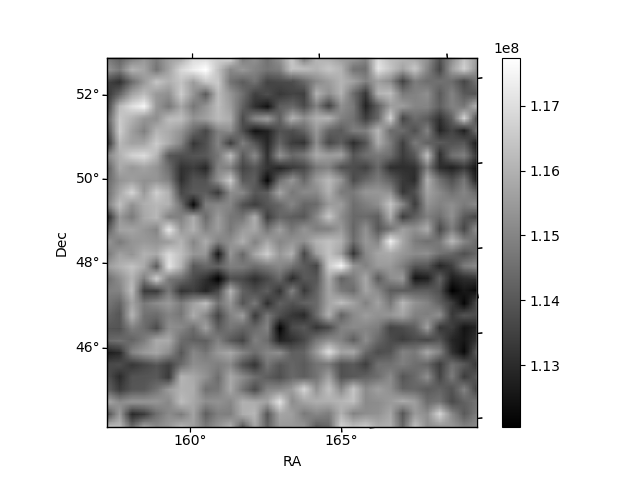
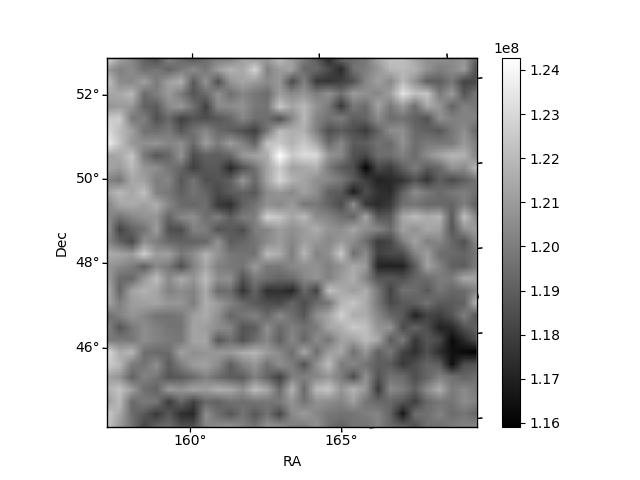
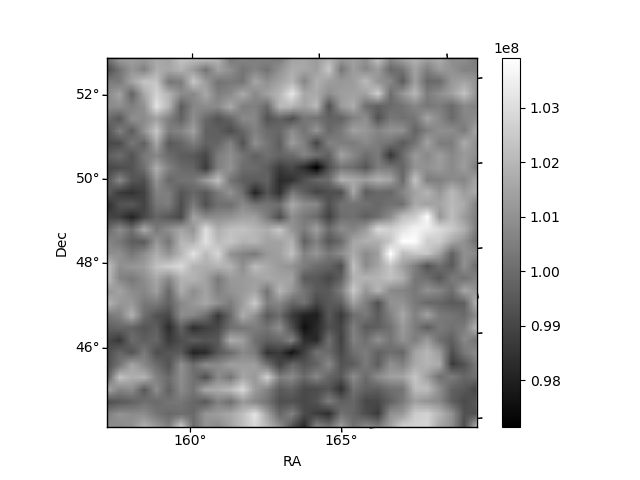
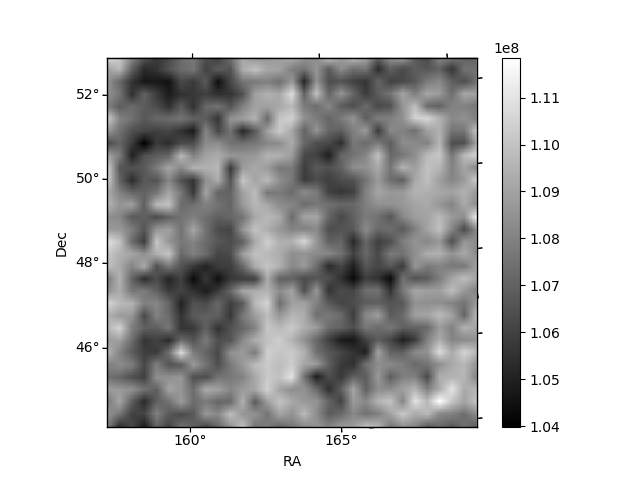
Histogram calculated using DETX and DETY for each event in the final _common_clean file
| Quadrant A | 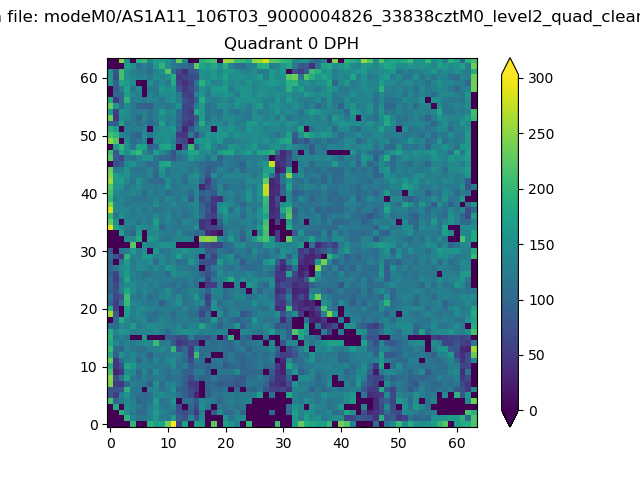 |
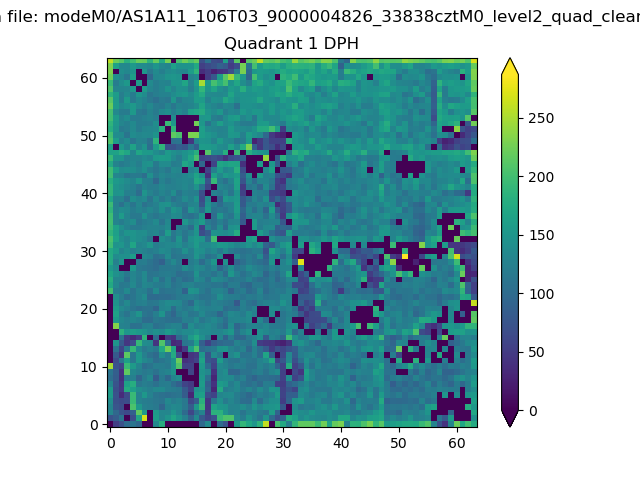 |
Quadrant B |
|---|---|---|---|
| Quadrant D |  |
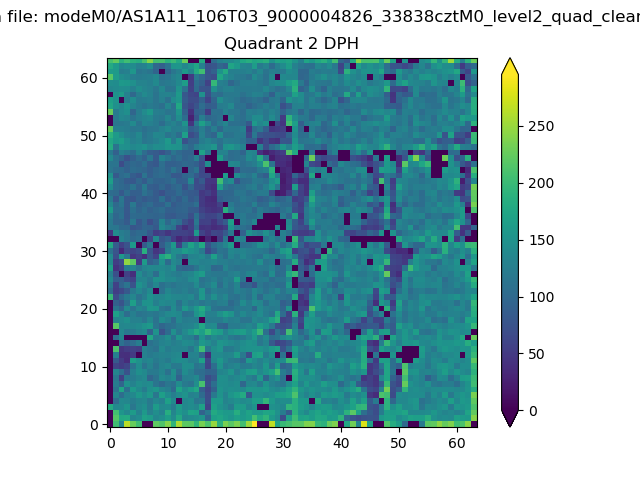 |
Quadrant C |
| Plot type | Count rate plots | Images |
|---|---|---|
| Comparison with Poisson distribution Blue bars denote a histogram of data divided into 1 sec bins. Red curve is a Poisson curve with rate = median count rate of data. |
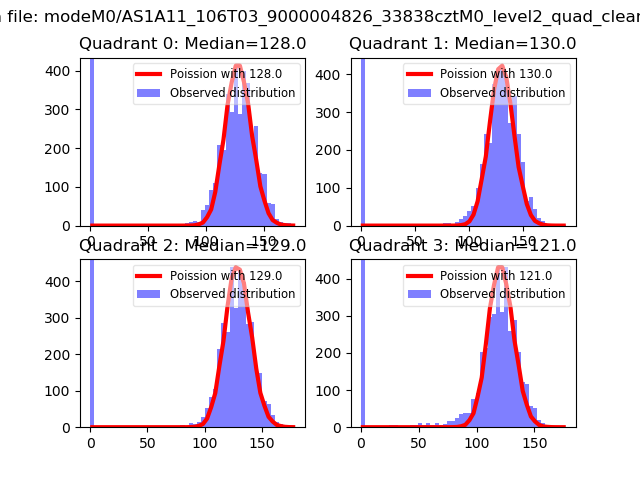 |
 |
| Quadrant-wise count rates Data is divided into 100 sec bins |
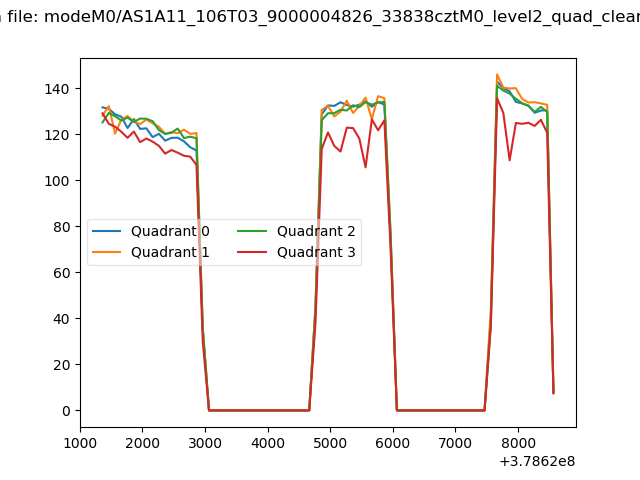 |
|
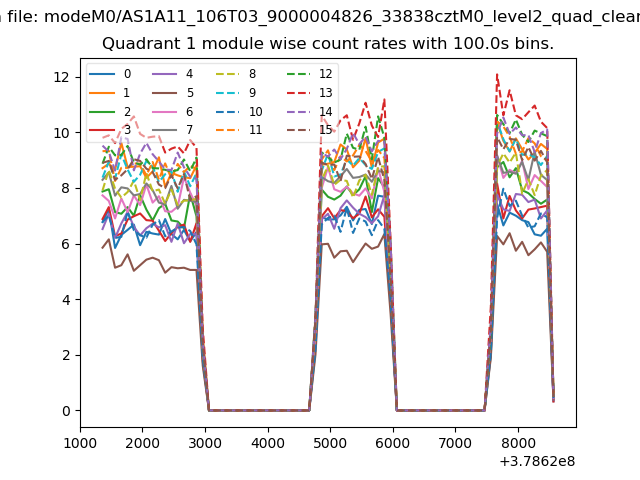
| Module-wise count rates for Quadrant A Data is divided into 100 sec bins |
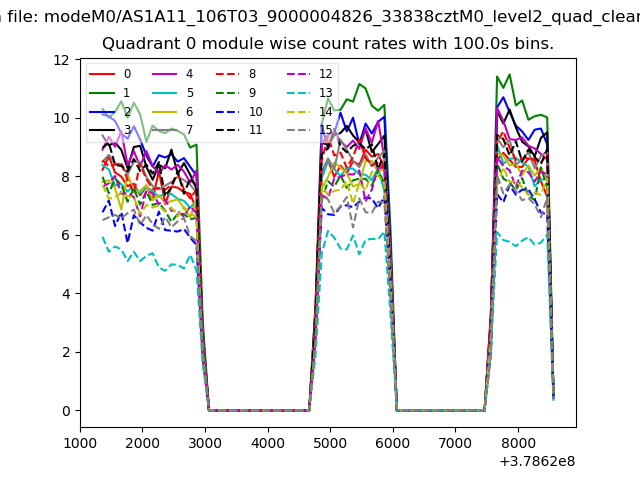 |
 |
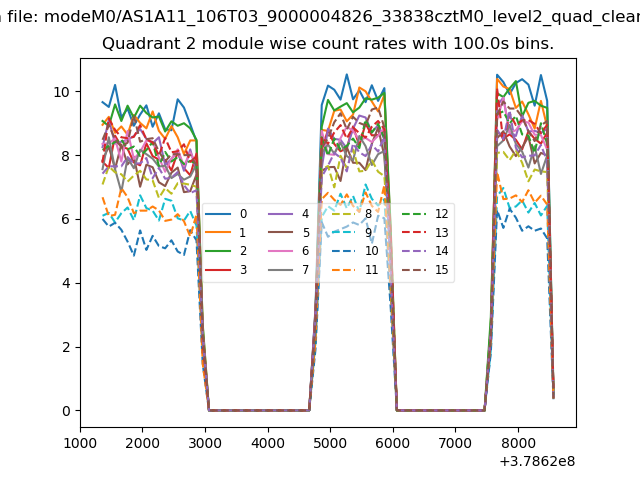
| Module-wise count rates for Quadrant B Data is divided into 100 sec bins |
 |
 |
| Module-wise count rates for Quadrant C Data is divided into 100 sec bins |
 |
 |
| Module-wise count rates for Quadrant D Data is divided into 100 sec bins |
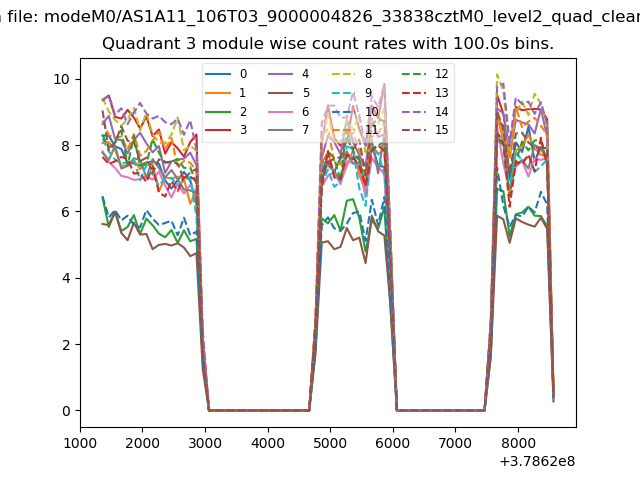 |
 |
| Parameter | Plot |
|---|---|
| CZT HV Monitor |  |
| D_VDD | 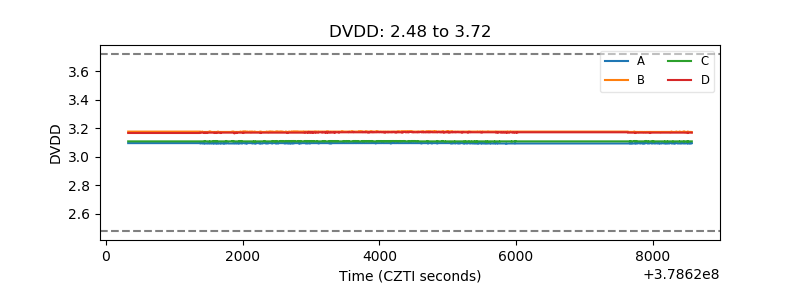 |
| Temperature 1 | 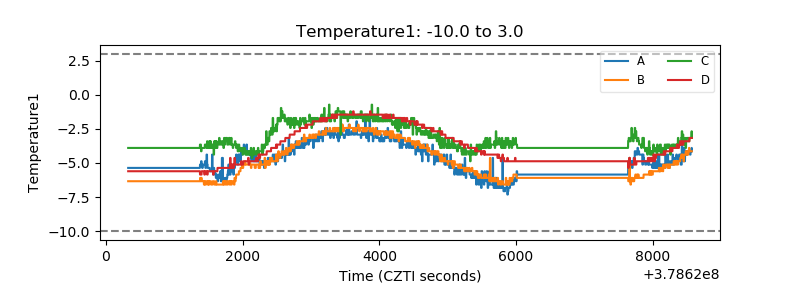 |
| Veto HV Monitor | 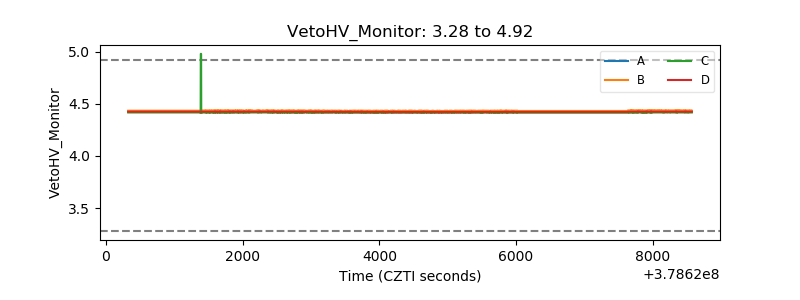 |
| Veto LLD | 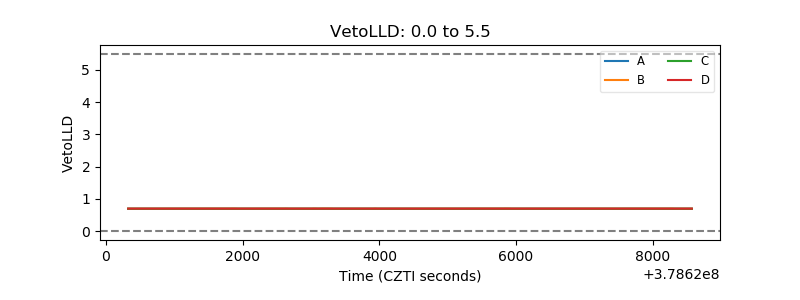 |
| Alpha Counter | 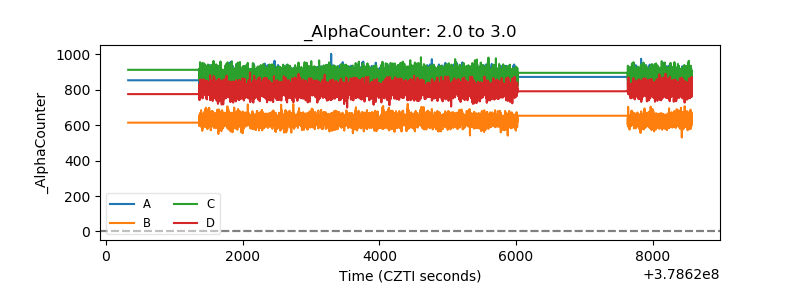 |
| _CPM_Rate | 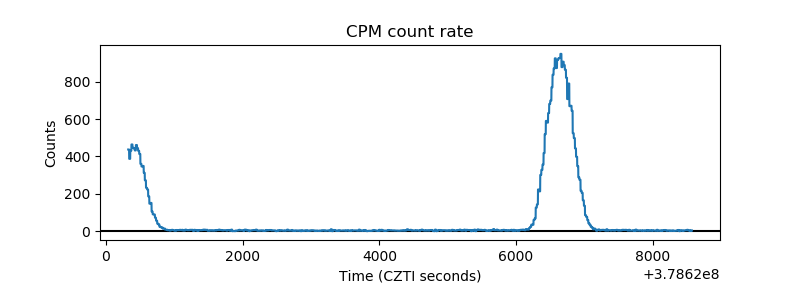 |
| CZT Counter | 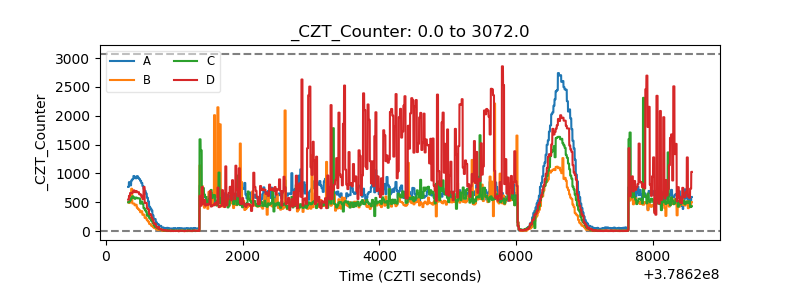 |
| +2.5 Volts monitor |  |
| +5 Volts monitor |  |
| _ROLL_ROT | 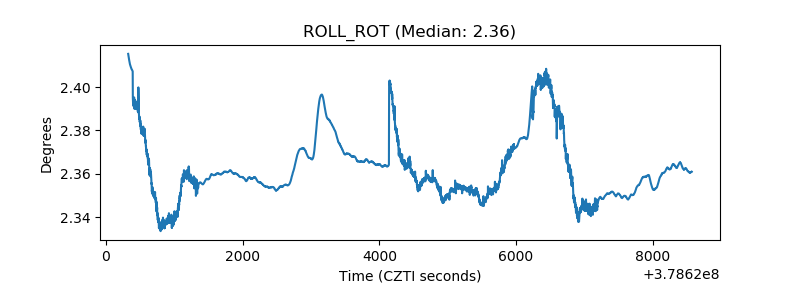 |
| _Roll_DEC | 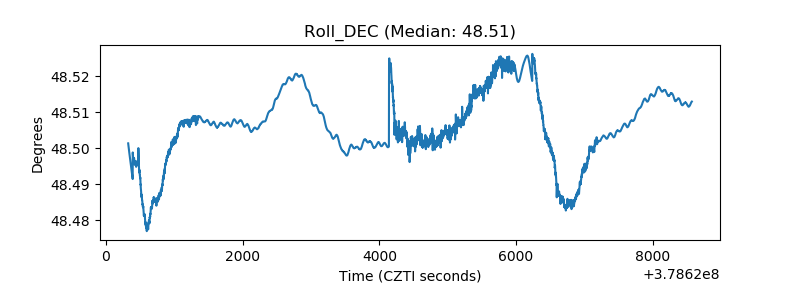 |
| _Roll_RA | 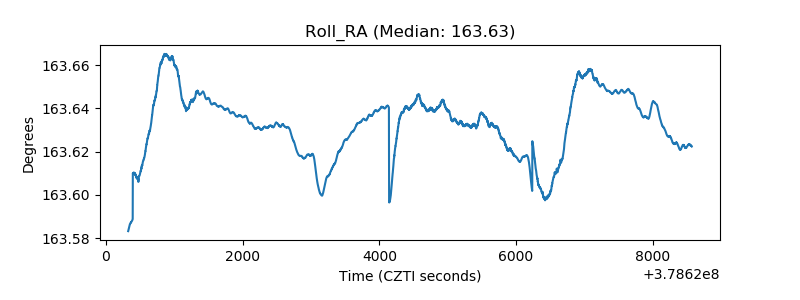 |
| Veto Counter | 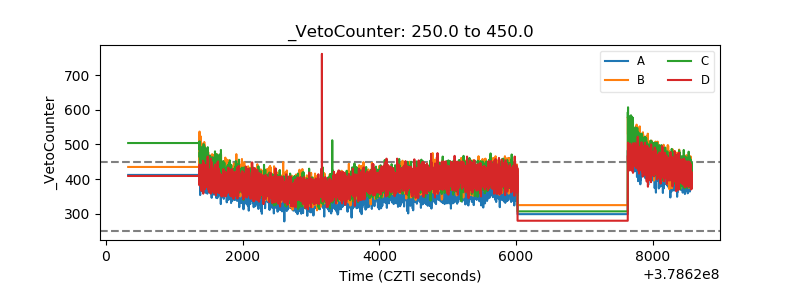 |