| Param | Original file | Final file |
|---|---|---|
| Filename | modeM0/AS1A11_106T03_9000004826_33840cztM0_level2.evt | modeM0/AS1A11_106T03_9000004826_33840cztM0_level2_quad_clean.evt |
| Size (bytes) | 579,170,880 | 72,976,320 |
| Size | 552.3 MB | 69.6 MB |
| Events in quadrant A | 4,676,396 | 467,107 |
| Events in quadrant B | 3,506,117 | 465,691 |
| Events in quadrant C | 3,065,655 | 467,795 |
| Events in quadrant D | 5,929,032 | 432,518 |
| Mode M9 | |||
|---|---|---|---|
| Quadrant | BADHDUFLAG | Total packets | Discarded packets |
| A | 0 | 19 | 0 |
| B | 0 | 19 | 0 |
| C | 0 | 19 | 0 |
| D | 0 | 20 | 0 |
| Mode SS | |||
|---|---|---|---|
| Quadrant | BADHDUFLAG | Total packets | Discarded packets |
| A | 0 | 110 | 0 |
| B | 0 | 110 | 0 |
| C | 0 | 110 | 0 |
| D | 0 | 110 | 0 |
| Mode M0 | |||
|---|---|---|---|
| Quadrant | BADHDUFLAG | Total packets | Discarded packets |
| A | 0 | 17893 | 3 |
| B | 0 | 13751 | 2 |
| C | 0 | 12097 | 2 |
| D | 0 | 21298 | 2 |
| Quadrant | Total seconds | Saturated seconds | Saturation percentage |
|---|---|---|---|
| A | 5374 | 43 | 0.800149% |
| B | 5374 | 281 | 5.228880% |
| C | 5374 | 45 | 0.837365% |
| D | 5374 | 590 | 10.978787% |
Noise dominated data is calculated using 1-second bins in cleaned event files. If a bin has >2000 counts, and if more than 50% of those come from <1% of pixels, then it is considered to be noise-dominated and hence unusable.
| Quadrant | # 1 sec bins | Bins with >0 counts | Bins with >2000 counts | High rate bins dominated by noise | Noise dominated (total time) | Noise dominated (detector-on time) | Marked lightcurve |
|---|---|---|---|---|---|---|---|
| A | 7137 | 5375 | 1 | 1 | 0.01% | 0.02% | 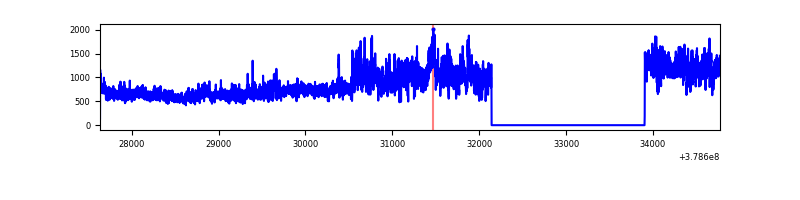 |
| B | 7137 | 5375 | 217 | 217 | 3.04% | 4.04% | 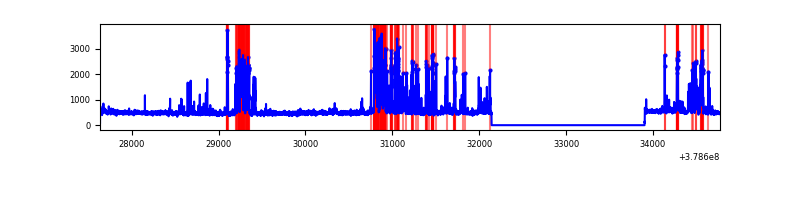 |
| C | 7137 | 5375 | 35 | 35 | 0.49% | 0.65% | 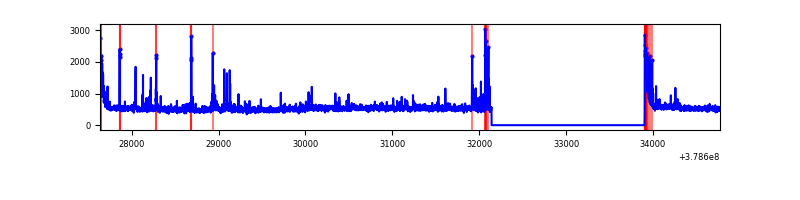 |
| D | 7137 | 5375 | 567 | 567 | 7.94% | 10.55% | 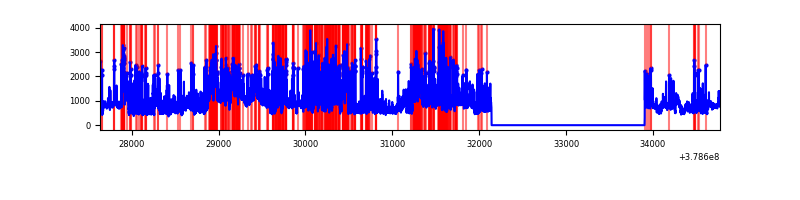 |
Top three noisy pixels from each quadrant. If the there are fewer than three noisy pixels in the level2.evt file, extra rows are filled as -1
| Pixel properties | Quadrant properties | ||||||
|---|---|---|---|---|---|---|---|
| Quadrant | DetID | PixID | Counts | Sigma | Mean | Median | Sigma |
| A | 15 | 169 | 2134251 | 16414.2 | 651 | 640 | 130.0 |
| A | 13 | 6 | 18422 | 136.8 | 651 | 640 | 130.0 |
| A | 10 | 83 | 10698 | 77.38 | 651 | 640 | 130.0 |
| B | 5 | 172 | 878649 | 7305.89 | 631 | 616 | 120.2 |
| B | 4 | 251 | 68478 | 564.66 | 631 | 616 | 120.2 |
| B | 0 | 190 | 19149 | 154.21 | 631 | 616 | 120.2 |
| C | 15 | 214 | 234249 | 1614.22 | 625 | 630 | 144.7 |
| C | 14 | 254 | 130149 | 894.93 | 625 | 630 | 144.7 |
| C | 0 | 10 | 117833 | 809.83 | 625 | 630 | 144.7 |
| D | 12 | 235 | 1095453 | 7336.49 | 611 | 593 | 149.2 |
| D | 8 | 195 | 989108 | 6623.89 | 611 | 593 | 149.2 |
| D | 13 | 249 | 529533 | 3544.35 | 611 | 593 | 149.2 |
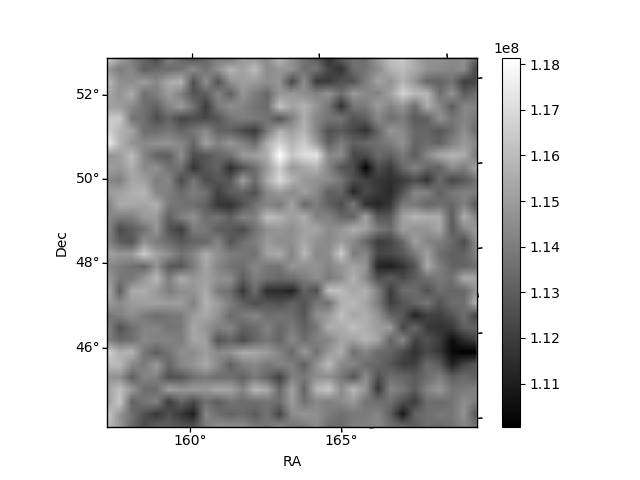
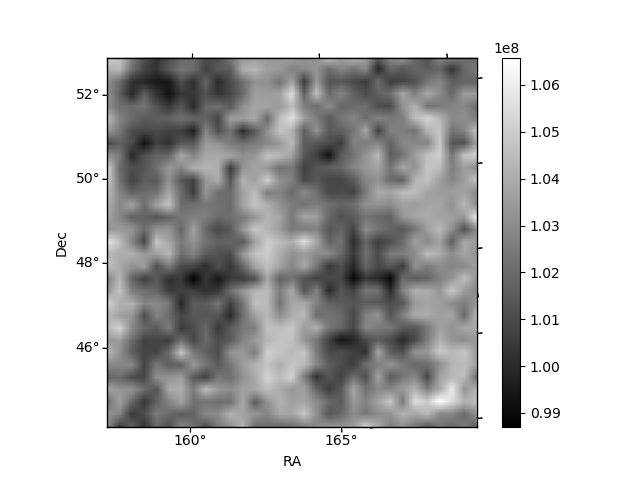
Histogram calculated using DETX and DETY for each event in the final _common_clean file
| Quadrant A | 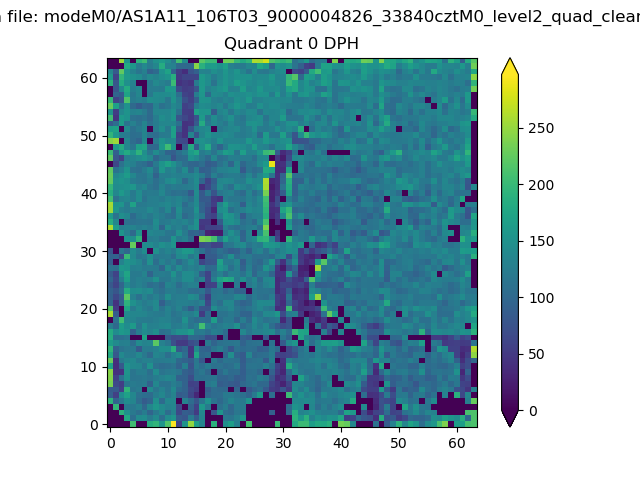 |
 |
Quadrant B |
|---|---|---|---|
| Quadrant D | 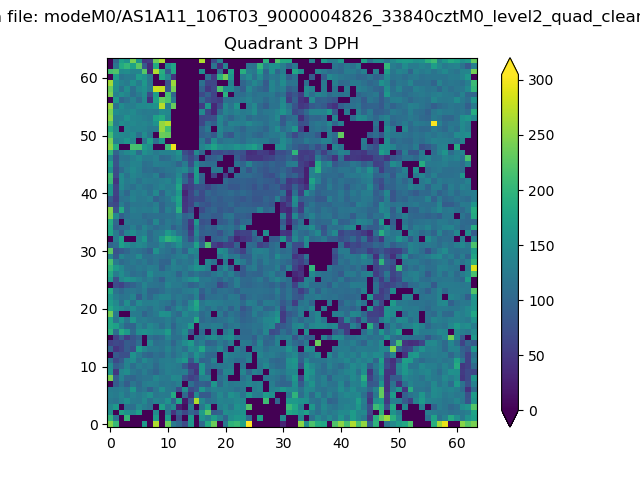 |
 |
Quadrant C |
| Plot type | Count rate plots | Images |
|---|---|---|
| Comparison with Poisson distribution Blue bars denote a histogram of data divided into 1 sec bins. Red curve is a Poisson curve with rate = median count rate of data. |
 |
 |
| Quadrant-wise count rates Data is divided into 100 sec bins |
 |
|
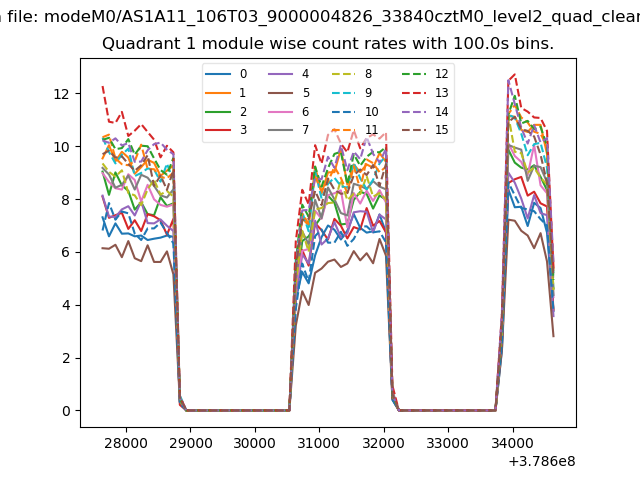
| Module-wise count rates for Quadrant A Data is divided into 100 sec bins |
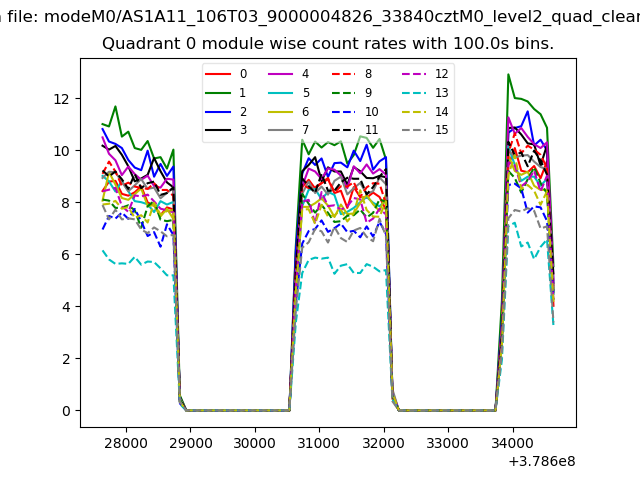 |
 |
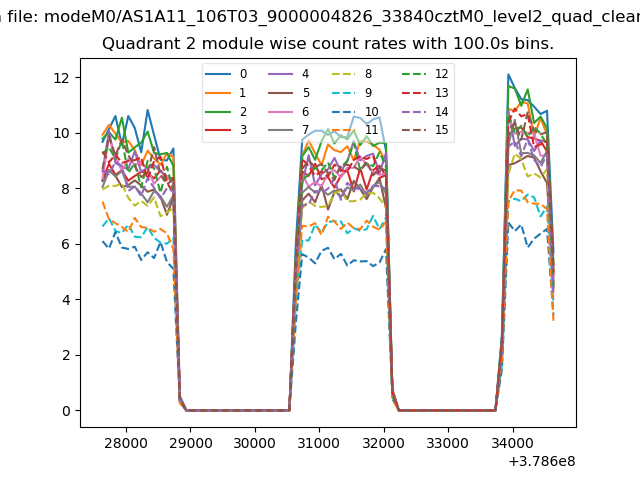
| Module-wise count rates for Quadrant B Data is divided into 100 sec bins |
 |
 |
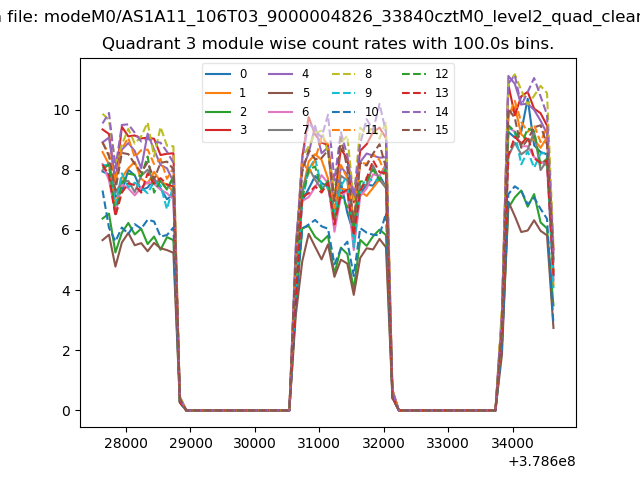
| Module-wise count rates for Quadrant C Data is divided into 100 sec bins |
 |
 |
| Module-wise count rates for Quadrant D Data is divided into 100 sec bins |
 |
 |
| Parameter | Plot |
|---|---|
| CZT HV Monitor |  |
| D_VDD | 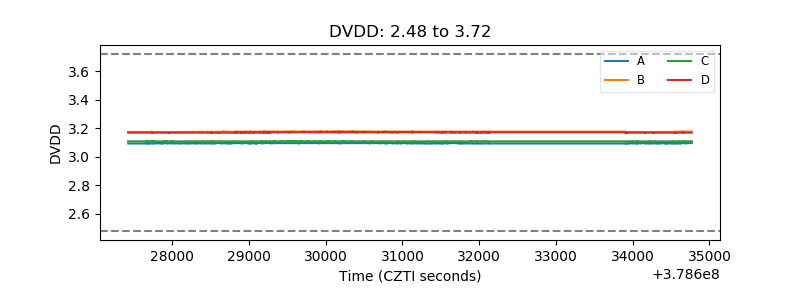 |
| Temperature 1 | 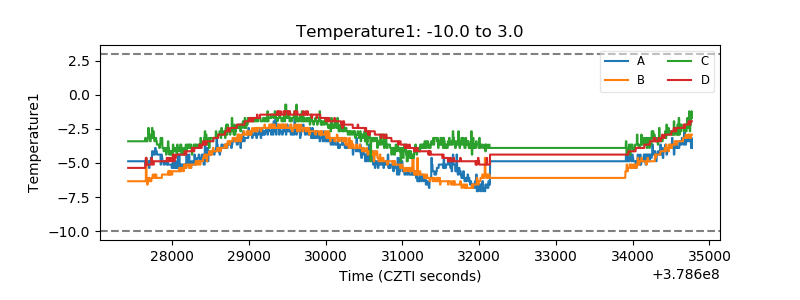 |
| Veto HV Monitor | 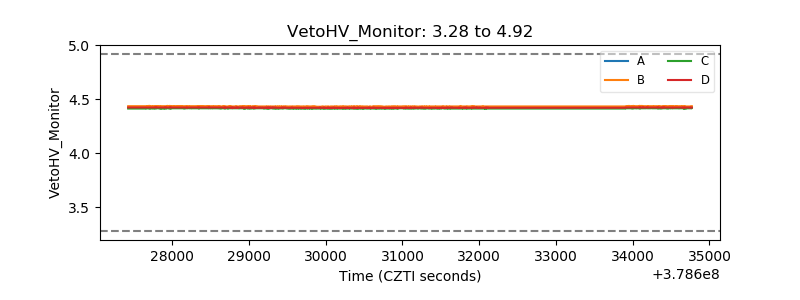 |
| Veto LLD |  |
| Alpha Counter | 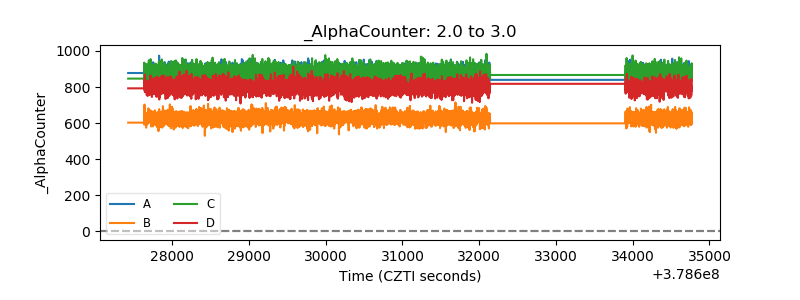 |
| _CPM_Rate | 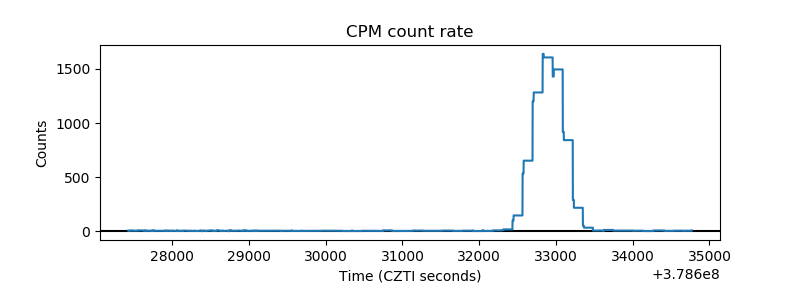 |
| CZT Counter |  |
| +2.5 Volts monitor |  |
| +5 Volts monitor |  |
| _ROLL_ROT | 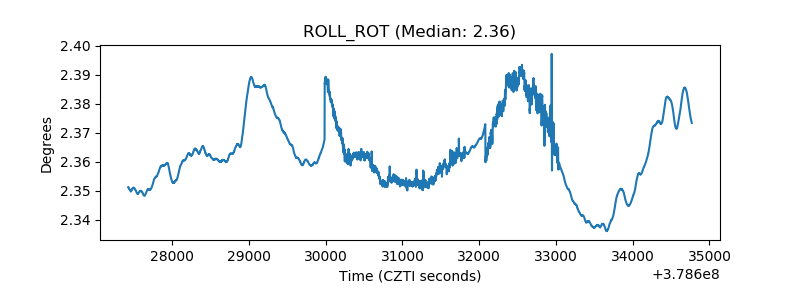 |
| _Roll_DEC | 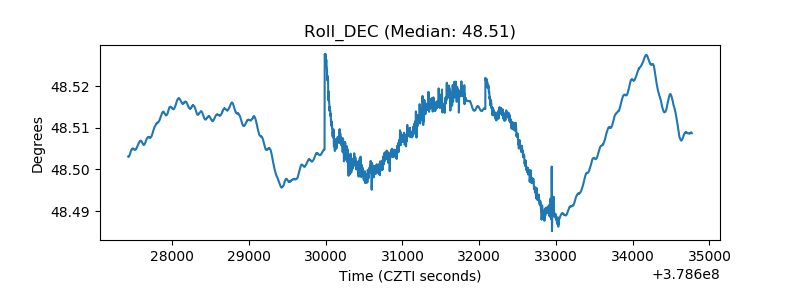 |
| _Roll_RA | 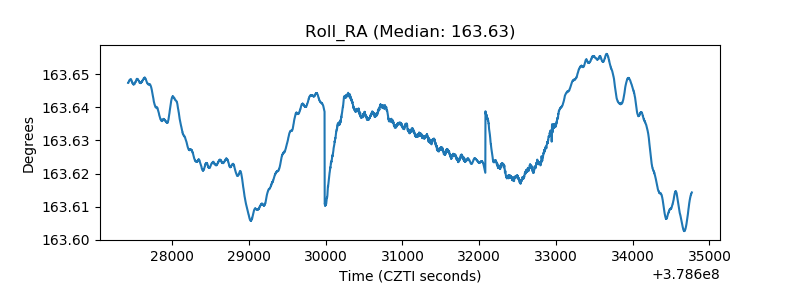 |
| Veto Counter | 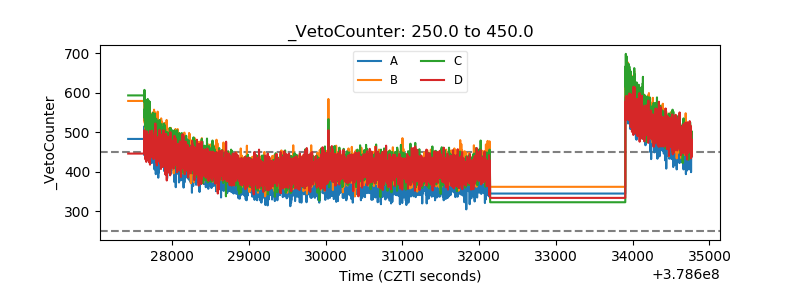 |