| Param | Original file | Final file |
|---|---|---|
| Filename | modeM0/AS1A11_106T03_9000004826_33843cztM0_level2.evt | modeM0/AS1A11_106T03_9000004826_33843cztM0_level2_quad_clean.evt |
| Size (bytes) | 312,053,760 | 33,439,680 |
| Size | 297.6 MB | 31.9 MB |
| Events in quadrant A | 2,071,000 | 203,758 |
| Events in quadrant B | 2,032,639 | 196,012 |
| Events in quadrant C | 2,050,427 | 200,098 |
| Events in quadrant D | 3,083,121 | 189,240 |
| Mode M9 | |||
|---|---|---|---|
| Quadrant | BADHDUFLAG | Total packets | Discarded packets |
| A | 0 | 6 | 0 |
| B | 0 | 6 | 0 |
| C | 0 | 6 | 0 |
| D | 0 | 7 | 0 |
| Mode SS | |||
|---|---|---|---|
| Quadrant | BADHDUFLAG | Total packets | Discarded packets |
| A | 0 | 62 | 0 |
| B | 0 | 62 | 0 |
| C | 0 | 62 | 0 |
| D | 0 | 62 | 0 |
| Mode M0 | |||
|---|---|---|---|
| Quadrant | BADHDUFLAG | Total packets | Discarded packets |
| A | 0 | 8362 | 1 |
| B | 0 | 8064 | 1 |
| C | 0 | 8074 | 1 |
| D | 0 | 11496 | 1 |
| Quadrant | Total seconds | Saturated seconds | Saturation percentage |
|---|---|---|---|
| A | 3137 | 41 | 1.306981% |
| B | 3137 | 91 | 2.900861% |
| C | 3137 | 58 | 1.848900% |
| D | 3137 | 112 | 3.570290% |
Noise dominated data is calculated using 1-second bins in cleaned event files. If a bin has >2000 counts, and if more than 50% of those come from <1% of pixels, then it is considered to be noise-dominated and hence unusable.
| Quadrant | # 1 sec bins | Bins with >0 counts | Bins with >2000 counts | High rate bins dominated by noise | Noise dominated (total time) | Noise dominated (detector-on time) | Marked lightcurve |
|---|---|---|---|---|---|---|---|
| A | 3137 | 3137 | 15 | 15 | 0.48% | 0.48% | 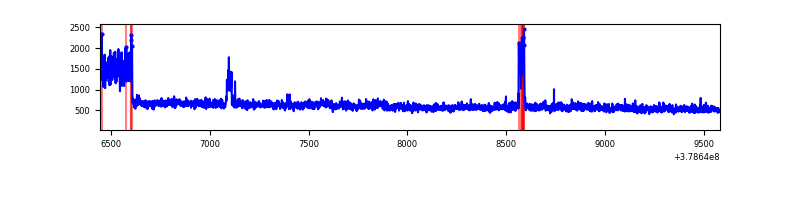 |
| B | 3137 | 3137 | 66 | 66 | 2.10% | 2.10% | 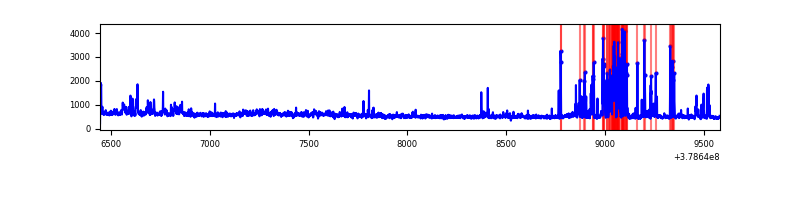 |
| C | 3137 | 3137 | 49 | 49 | 1.56% | 1.56% | 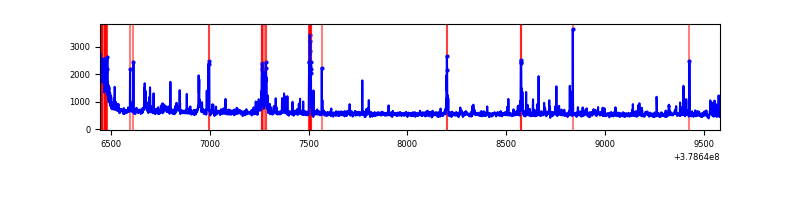 |
| D | 3137 | 3137 | 92 | 92 | 2.93% | 2.93% | 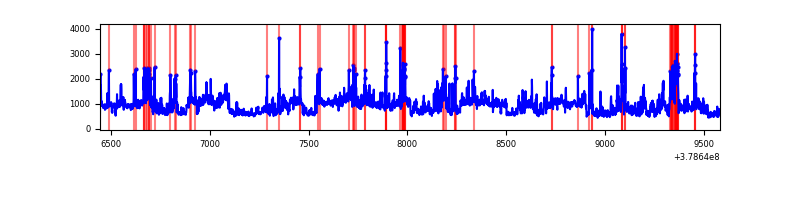 |
Top three noisy pixels from each quadrant. If the there are fewer than three noisy pixels in the level2.evt file, extra rows are filled as -1
| Pixel properties | Quadrant properties | ||||||
|---|---|---|---|---|---|---|---|
| Quadrant | DetID | PixID | Counts | Sigma | Mean | Median | Sigma |
| A | 15 | 169 | 421395 | 5054.79 | 417 | 410 | 83.3 |
| A | 7 | 16 | 16399 | 191.98 | 417 | 410 | 83.3 |
| A | 13 | 6 | 11540 | 133.64 | 417 | 410 | 83.3 |
| B | 5 | 172 | 335767 | 4374.85 | 408 | 400 | 76.7 |
| B | 0 | 199 | 34426 | 443.87 | 408 | 400 | 76.7 |
| B | 0 | 219 | 23099 | 296.11 | 408 | 400 | 76.7 |
| C | 14 | 254 | 183965 | 1987.75 | 405 | 409 | 92.3 |
| C | 15 | 214 | 136277 | 1471.33 | 405 | 409 | 92.3 |
| C | 0 | 10 | 73797 | 794.72 | 405 | 409 | 92.3 |
| D | 8 | 195 | 698182 | 6321.6 | 404 | 394 | 110.4 |
| D | 12 | 235 | 272180 | 2462.24 | 404 | 394 | 110.4 |
| D | 2 | 250 | 206955 | 1871.34 | 404 | 394 | 110.4 |
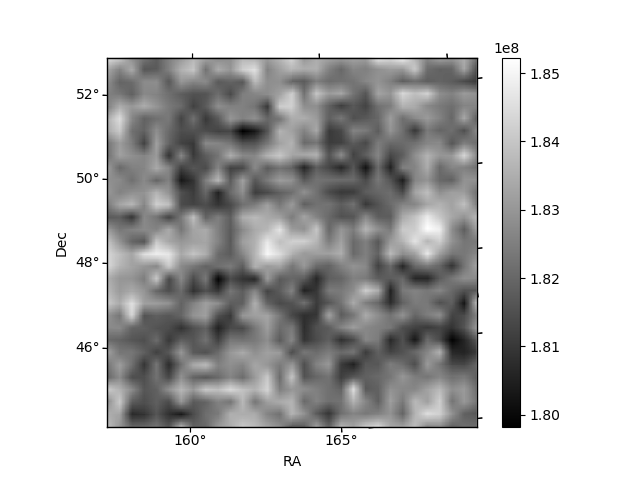
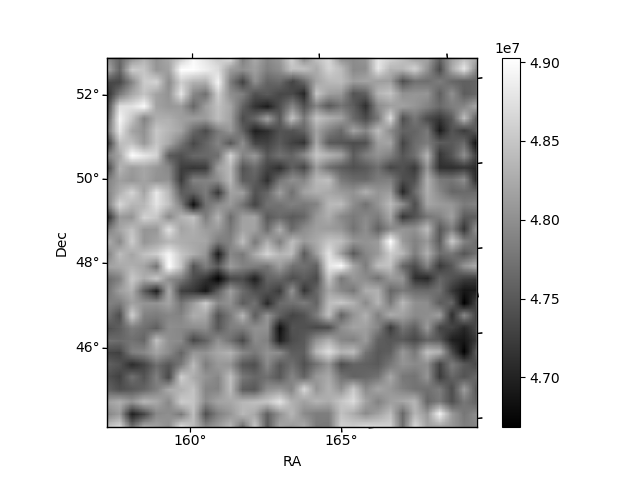
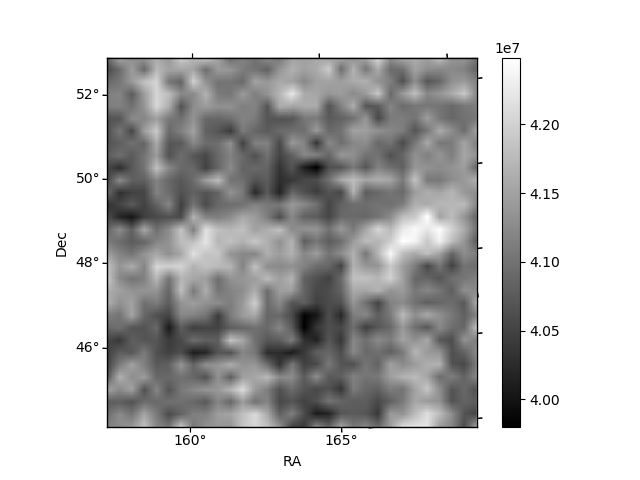
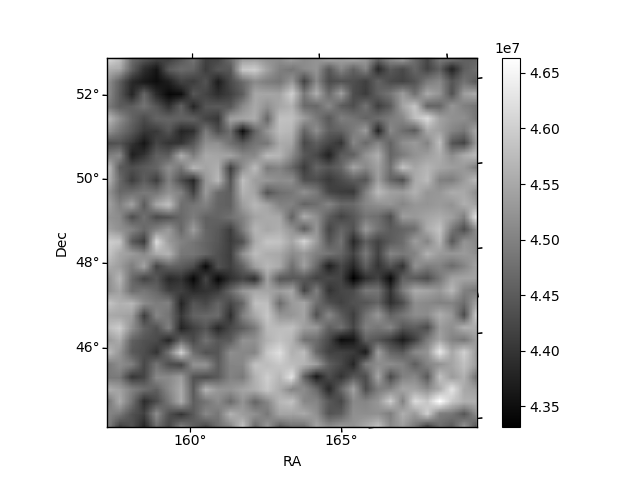
Histogram calculated using DETX and DETY for each event in the final _common_clean file
| Quadrant A | 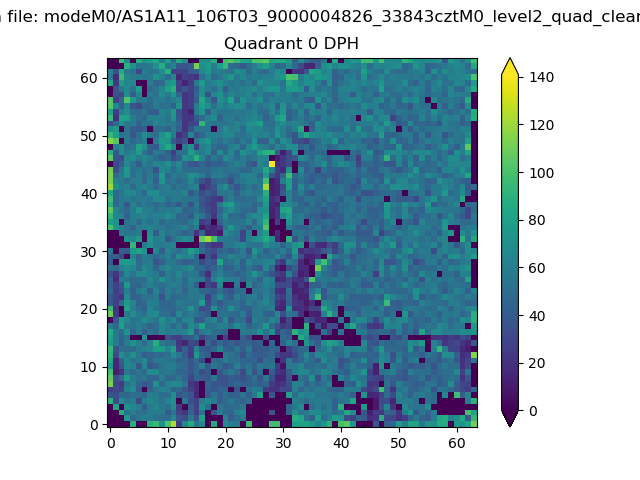 |
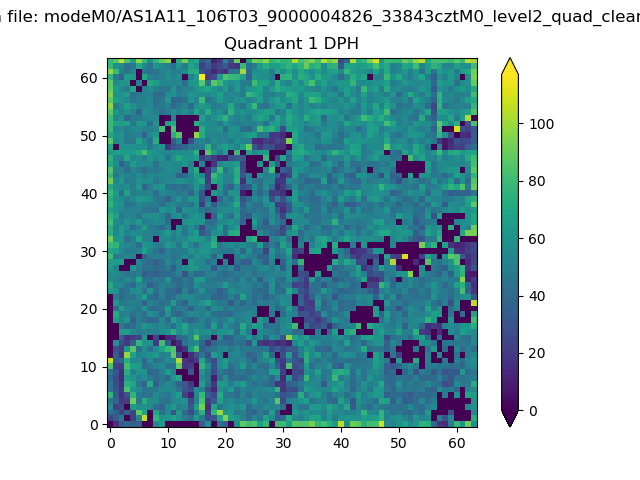 |
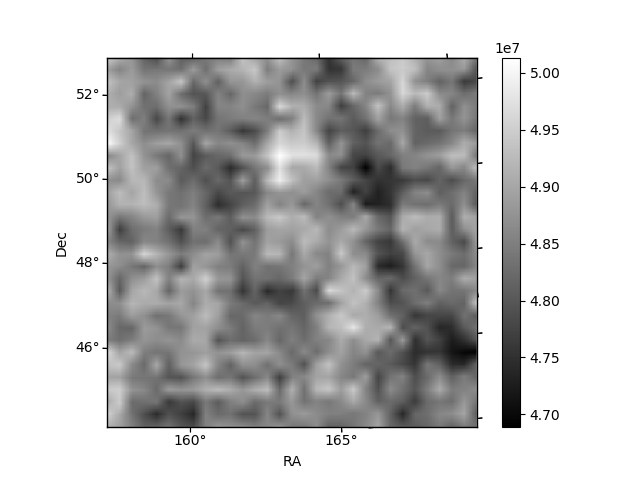
Quadrant B |
|---|---|---|---|
| Quadrant D | 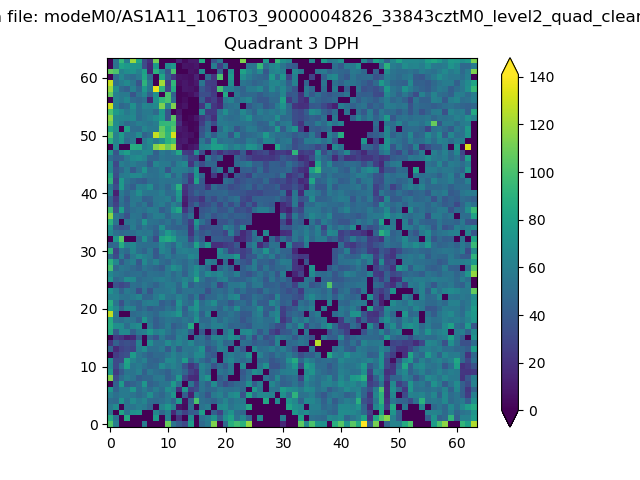 |
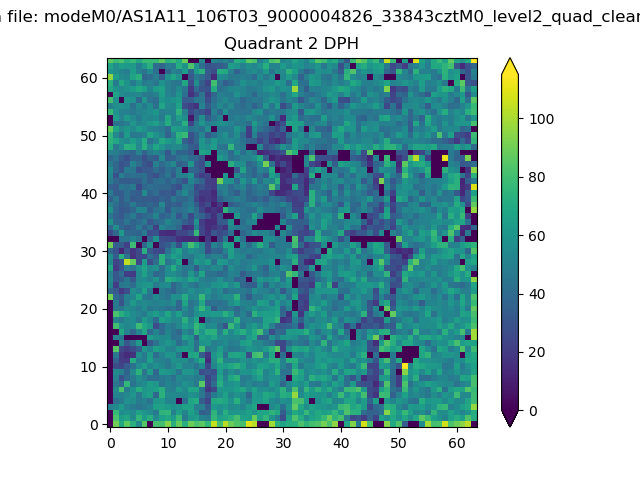 |
Quadrant C |
| Plot type | Count rate plots | Images |
|---|---|---|
| Comparison with Poisson distribution Blue bars denote a histogram of data divided into 1 sec bins. Red curve is a Poisson curve with rate = median count rate of data. |
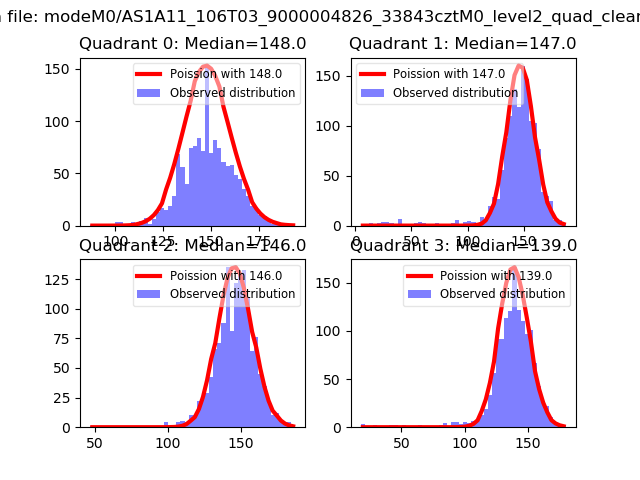 |
 |
| Quadrant-wise count rates Data is divided into 100 sec bins |
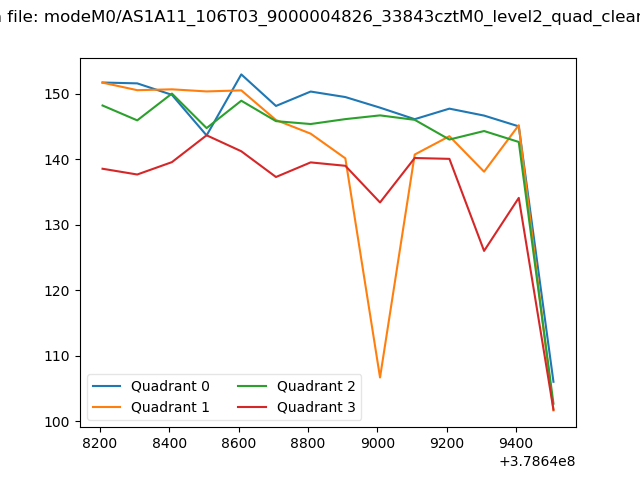 |
|
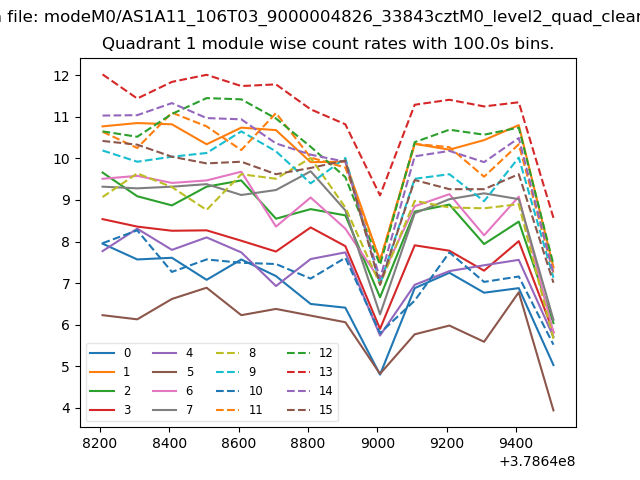
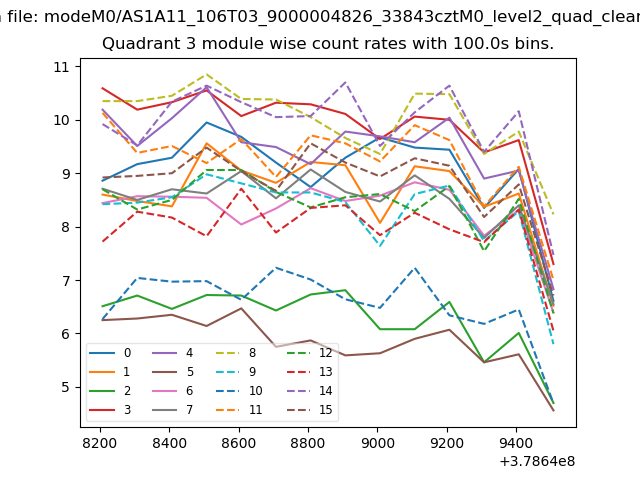
| Module-wise count rates for Quadrant A Data is divided into 100 sec bins |
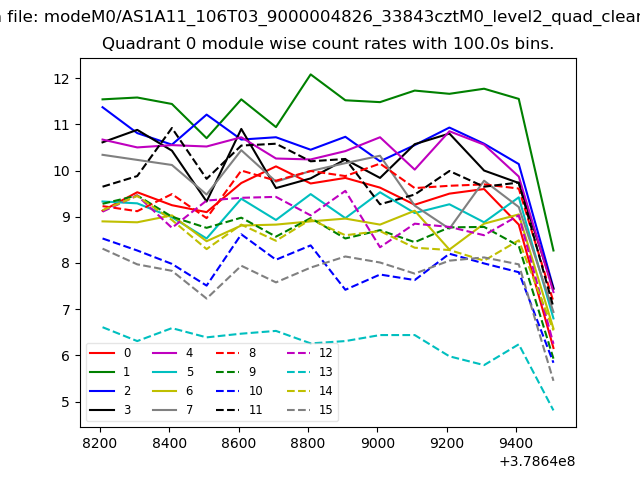 |
 |
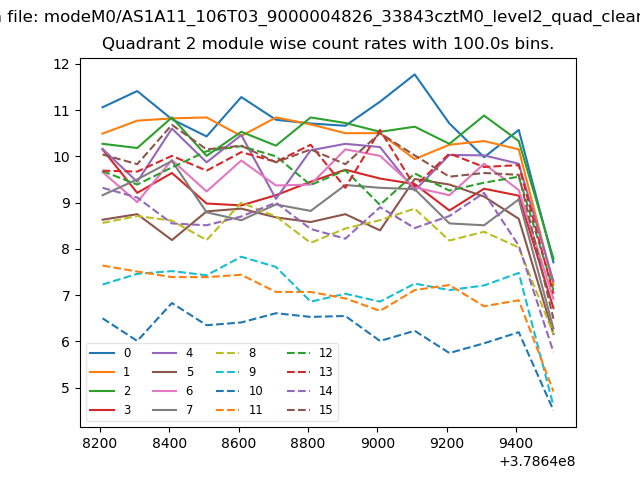
| Module-wise count rates for Quadrant B Data is divided into 100 sec bins |
 |
 |
| Module-wise count rates for Quadrant C Data is divided into 100 sec bins |
 |
 |
| Module-wise count rates for Quadrant D Data is divided into 100 sec bins |
 |
 |
| Parameter | Plot |
|---|---|
| CZT HV Monitor | 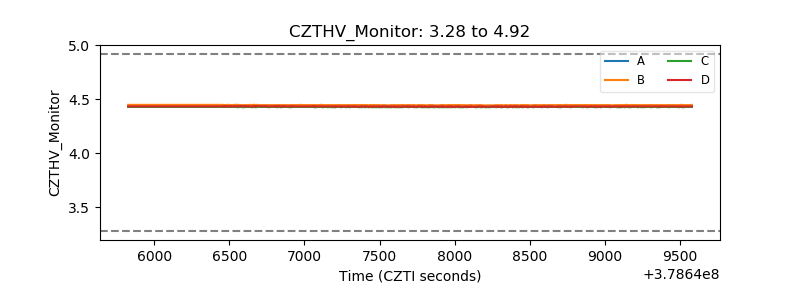 |
| D_VDD |  |
| Temperature 1 | 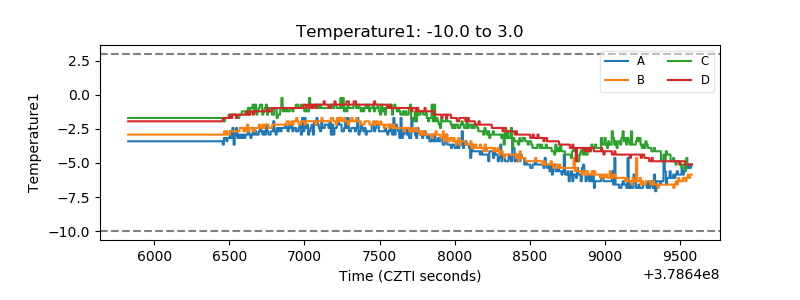 |
| Veto HV Monitor | 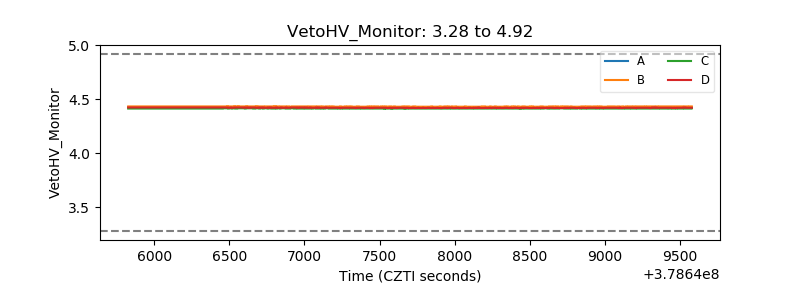 |
| Veto LLD | 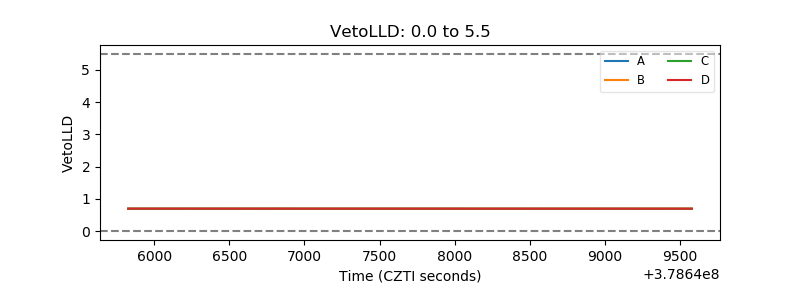 |
| Alpha Counter | 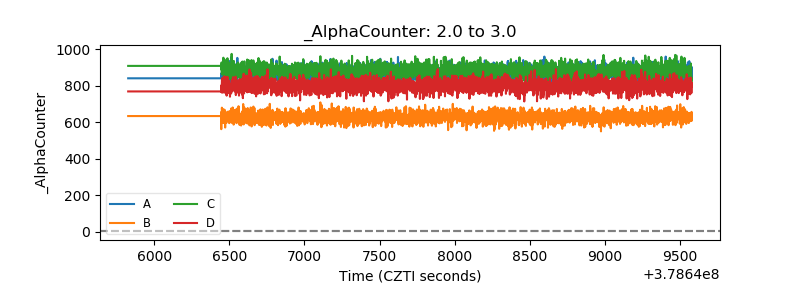 |
| _CPM_Rate | 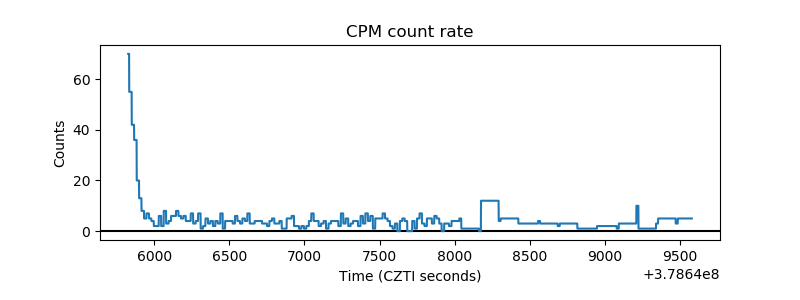 |
| CZT Counter | 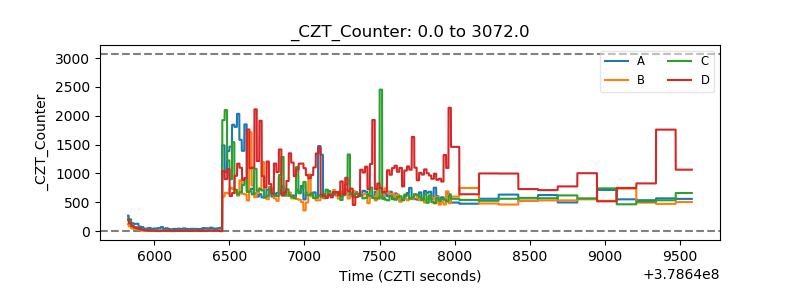 |
| +2.5 Volts monitor | 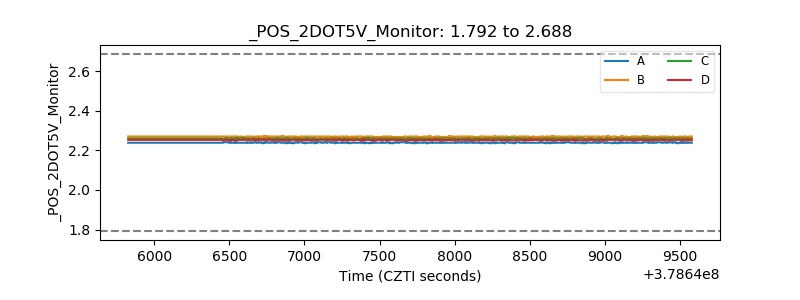 |
| +5 Volts monitor |  |
| _ROLL_ROT | 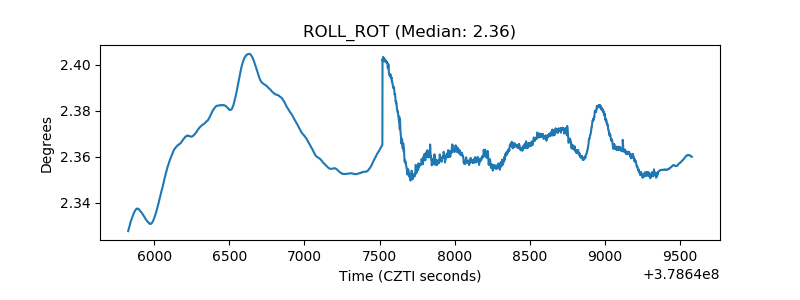 |
| _Roll_DEC | 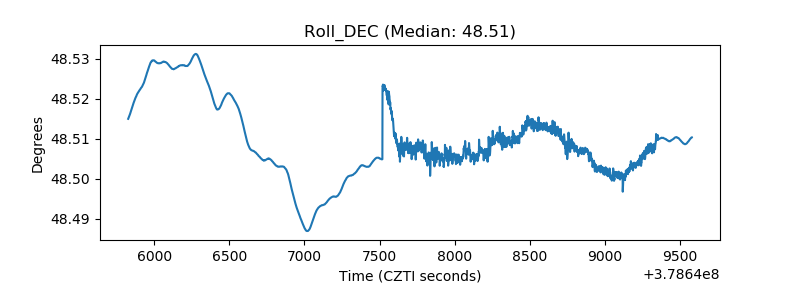 |
| _Roll_RA | 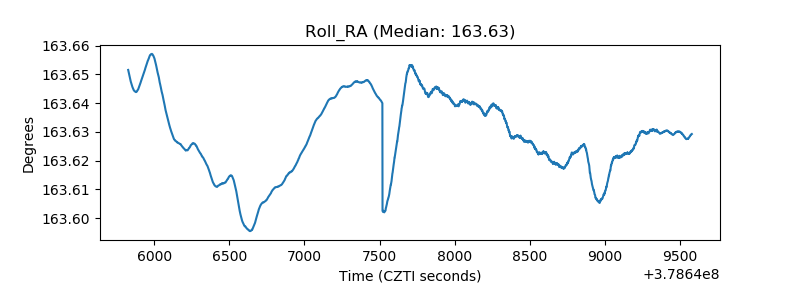 |
| Veto Counter | 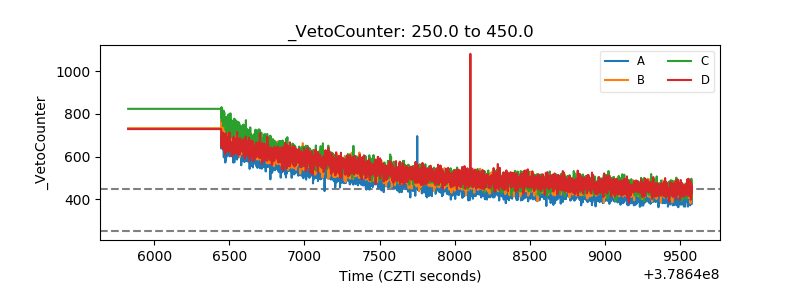 |