| Param | Original file | Final file |
|---|---|---|
| Filename | modeM0/AS1A11_065T07_9000004828cztM0_level2.fits | modeM0/AS1A11_065T07_9000004828cztM0_level2_quad_clean.evt |
| Size (bytes) | 146,764,800 | 152,340,480 |
| Size | 140.0 MB | 145.3 MB |
| Events in quadrant A | 897,528 | 958,255 |
| Events in quadrant B | 875,904 | 928,513 |
| Events in quadrant C | 909,114 | 912,686 |
| Events in quadrant D | 762,992 | 814,654 |
| Mode M9 | |||
|---|---|---|---|
| Quadrant | BADHDUFLAG | Total packets | Discarded packets |
| A | 0 | 82 | 0 |
| B | 0 | 82 | 0 |
| C | 0 | 82 | 0 |
| D | 0 | 82 | 0 |
| Mode M0 | |||
|---|---|---|---|
| Quadrant | BADHDUFLAG | Total packets | Discarded packets |
| A | 0 | 34206 | 0 |
| B | 0 | 35261 | 0 |
| C | 0 | 35857 | 0 |
| D | 0 | 55283 | 0 |
| Mode SS | |||
|---|---|---|---|
| Quadrant | BADHDUFLAG | Total packets | Discarded packets |
| A | 0 | 296 | 0 |
| B | 0 | 296 | 0 |
| C | 0 | 296 | 0 |
| D | 0 | 296 | 0 |
| Quadrant | Total seconds | Saturated seconds | Saturation percentage |
|---|---|---|---|
| A | 14471 | 595 | 4.111672% |
| B | 14471 | 442 | 3.054385% |
| C | 14471 | 267 | 1.845069% |
| D | 14471 | 996 | 6.882731% |
Noise dominated data is calculated using 1-second bins in cleaned event files. If a bin has >2000 counts, and if more than 50% of those come from <1% of pixels, then it is considered to be noise-dominated and hence unusable.
| Quadrant | # 1 sec bins | Bins with >0 counts | Bins with >2000 counts | High rate bins dominated by noise | Noise dominated (total time) | Noise dominated (detector-on time) | Marked lightcurve |
|---|---|---|---|---|---|---|---|
| A | 22601 | 14437 | 0 | 0 | 0.00% | 0.00% |  |
| B | 22601 | 14470 | 0 | 0 | 0.00% | 0.00% |  |
| C | 22601 | 14471 | 0 | 0 | 0.00% | 0.00% |  |
| D | 22601 | 14469 | 0 | 0 | 0.00% | 0.00% |  |
Top three noisy pixels from each quadrant. If the there are fewer than three noisy pixels in the level2.evt file, extra rows are filled as -1
| Pixel properties | Quadrant properties | ||||||
|---|---|---|---|---|---|---|---|
| Quadrant | DetID | PixID | Counts | Sigma | Mean | Median | Sigma |
| A | 0 | 29 | 736 | 8.82 | 234 | 222 | 58.3 |
| A | 9 | 19 | 714 | 8.44 | 234 | 222 | 58.3 |
| A | 7 | 110 | 693 | 8.08 | 234 | 222 | 58.3 |
| B | 3 | 80 | 701 | 10.07 | 232 | 222 | 47.6 |
| B | 2 | 9 | 694 | 9.92 | 232 | 222 | 47.6 |
| B | 2 | 8 | 598 | 7.9 | 232 | 222 | 47.6 |
| C | 1 | 81 | 746 | 8.2 | 240 | 228 | 63.2 |
| C | 1 | 80 | 722 | 7.82 | 240 | 228 | 63.2 |
| C | 3 | 203 | 698 | 7.44 | 240 | 228 | 63.2 |
| D | 12 | 17 | 657 | 7.88 | 218 | 200 | 58.0 |
| D | 6 | 67 | 578 | 6.51 | 218 | 200 | 58.0 |
| D | 6 | 38 | 571 | 6.39 | 218 | 200 | 58.0 |
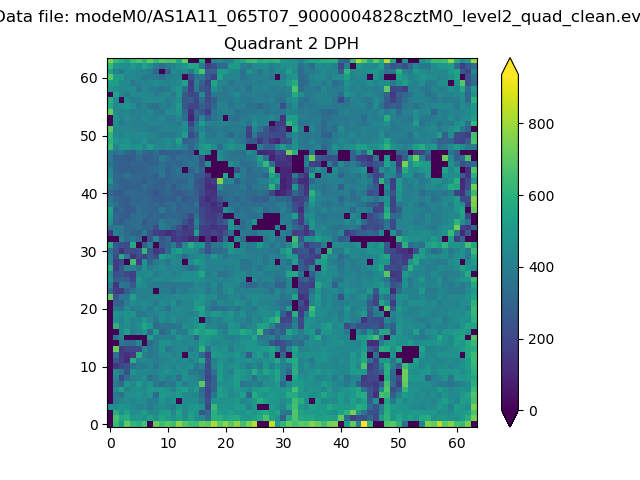
Histogram calculated using DETX and DETY for each event in the final _common_clean file
| Quadrant A |  |
 |
Quadrant B |
|---|---|---|---|
| Quadrant D | 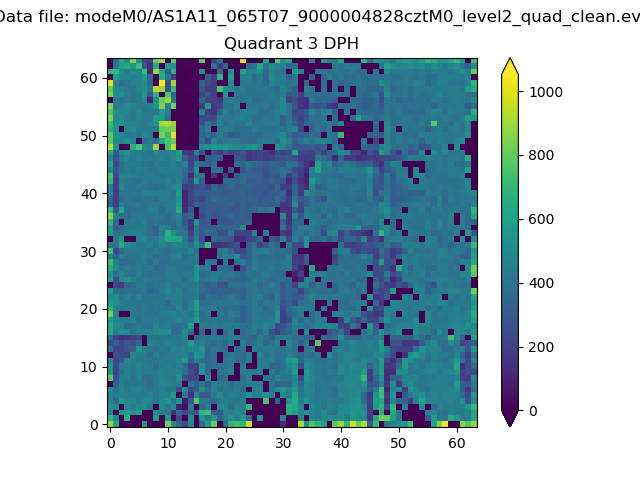 |
 |
Quadrant C |
| Plot type | Count rate plots | Images |
|---|---|---|
| Comparison with Poisson distribution Blue bars denote a histogram of data divided into 1 sec bins. Red curve is a Poisson curve with rate = median count rate of data. |
 |
 |
| Quadrant-wise count rates Data is divided into 100 sec bins |
 |
|
| Module-wise count rates for Quadrant A Data is divided into 100 sec bins |
 |
 |
| Module-wise count rates for Quadrant B Data is divided into 100 sec bins |
 |
 |
| Module-wise count rates for Quadrant C Data is divided into 100 sec bins |
 |
 |
| Module-wise count rates for Quadrant D Data is divided into 100 sec bins |
 |
 |
| Parameter | Plot |
|---|---|
| CZT HV Monitor |  |
| D_VDD | 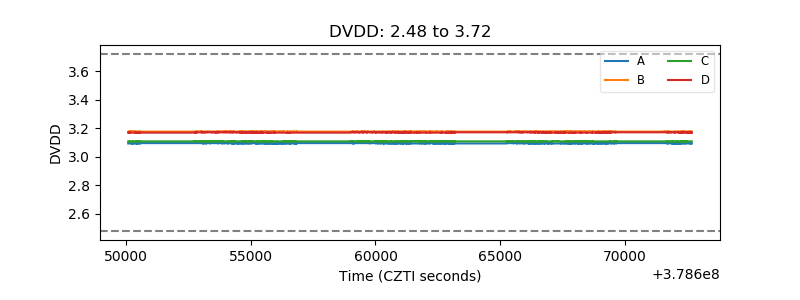 |
| Temperature 1 |  |
| Veto HV Monitor |  |
| Veto LLD |  |
| Alpha Counter |  |
| _CPM_Rate |  |
| CZT Counter |  |
| +2.5 Volts monitor |  |
| +5 Volts monitor |  |
| _ROLL_ROT |  |
| _Roll_DEC |  |
| _Roll_RA |  |
| Veto Counter |  |