| Param | Original file | Final file |
|---|---|---|
| Filename | modeM0/AS1A11_065T07_9000004828_33843cztM0_level2.evt | modeM0/AS1A11_065T07_9000004828_33843cztM0_level2_quad_clean.evt |
| Size (bytes) | 183,421,440 | 11,859,840 |
| Size | 174.9 MB | 11.3 MB |
| Events in quadrant A | 1,869,349 | 13,856 |
| Events in quadrant B | 974,002 | 77,040 |
| Events in quadrant C | 1,110,021 | 77,466 |
| Events in quadrant D | 1,495,716 | 76,833 |
| Mode M9 | |||
|---|---|---|---|
| Quadrant | BADHDUFLAG | Total packets | Discarded packets |
| A | 0 | 21 | 0 |
| B | 0 | 21 | 0 |
| C | 0 | 21 | 0 |
| D | 0 | 21 | 0 |
| Mode M0 | |||
|---|---|---|---|
| Quadrant | BADHDUFLAG | Total packets | Discarded packets |
| A | 0 | 6591 | 2 |
| B | 0 | 3929 | 1 |
| C | 0 | 4418 | 1 |
| D | 0 | 5572 | 1 |
| Mode SS | |||
|---|---|---|---|
| Quadrant | BADHDUFLAG | Total packets | Discarded packets |
| A | 0 | 32 | 0 |
| B | 0 | 32 | 0 |
| C | 0 | 32 | 0 |
| D | 0 | 32 | 0 |
| Quadrant | Total seconds | Saturated seconds | Saturation percentage |
|---|---|---|---|
| A | 1529 | 530 | 34.663179% |
| B | 1529 | 34 | 2.223676% |
| C | 1529 | 49 | 3.204709% |
| D | 1529 | 99 | 6.474820% |
Noise dominated data is calculated using 1-second bins in cleaned event files. If a bin has >2000 counts, and if more than 50% of those come from <1% of pixels, then it is considered to be noise-dominated and hence unusable.
| Quadrant | # 1 sec bins | Bins with >0 counts | Bins with >2000 counts | High rate bins dominated by noise | Noise dominated (total time) | Noise dominated (detector-on time) | Marked lightcurve |
|---|---|---|---|---|---|---|---|
| A | 3622 | 1530 | 381 | 381 | 10.52% | 24.90% | 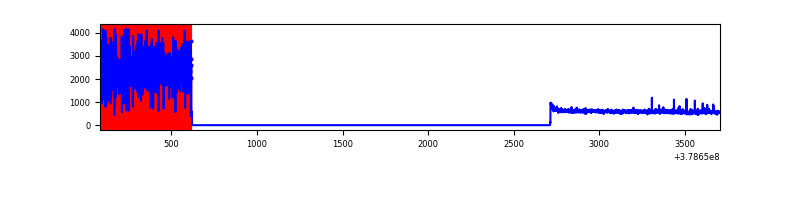 |
| B | 3622 | 1530 | 24 | 24 | 0.66% | 1.57% | 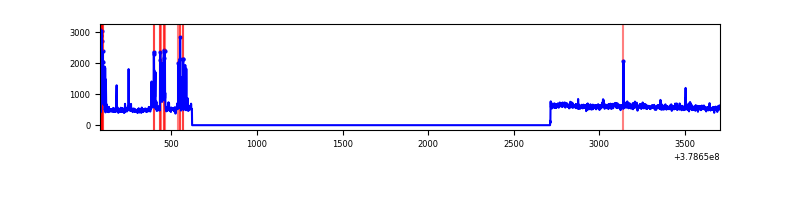 |
| C | 3622 | 1530 | 40 | 40 | 1.10% | 2.61% | 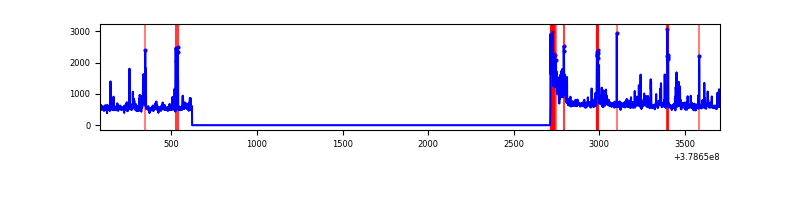 |
| D | 3622 | 1530 | 66 | 66 | 1.82% | 4.31% |  |
Top three noisy pixels from each quadrant. If the there are fewer than three noisy pixels in the level2.evt file, extra rows are filled as -1
| Pixel properties | Quadrant properties | ||||||
|---|---|---|---|---|---|---|---|
| Quadrant | DetID | PixID | Counts | Sigma | Mean | Median | Sigma |
| A | 15 | 169 | 1228582 | 36397.78 | 164 | 161 | 33.7 |
| A | 10 | 83 | 5081 | 145.78 | 164 | 161 | 33.7 |
| A | 13 | 254 | 1974 | 53.72 | 164 | 161 | 33.7 |
| B | 5 | 172 | 121486 | 2993.38 | 211 | 207 | 40.5 |
| B | 0 | 199 | 15436 | 375.88 | 211 | 207 | 40.5 |
| B | 12 | 111 | 4484 | 105.56 | 211 | 207 | 40.5 |
| C | 14 | 254 | 98555 | 2024.37 | 206 | 208 | 48.6 |
| C | 0 | 10 | 85212 | 1749.72 | 206 | 208 | 48.6 |
| C | 15 | 214 | 68738 | 1410.62 | 206 | 208 | 48.6 |
| D | 8 | 195 | 205361 | 3730.45 | 207 | 202 | 55.0 |
| D | 10 | 118 | 158960 | 2886.73 | 207 | 202 | 55.0 |
| D | 2 | 249 | 82434 | 1495.24 | 207 | 202 | 55.0 |
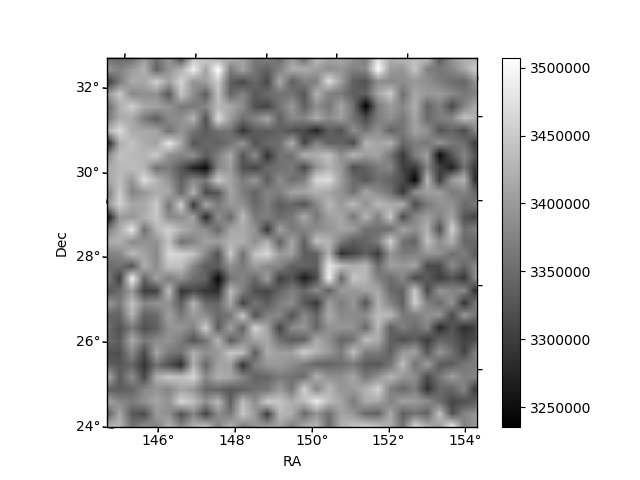
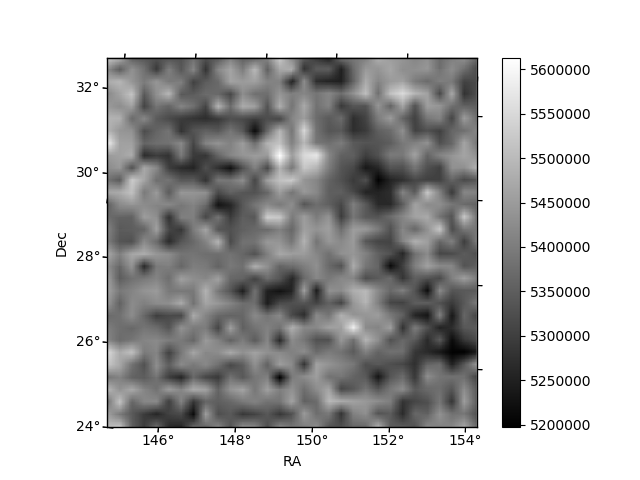
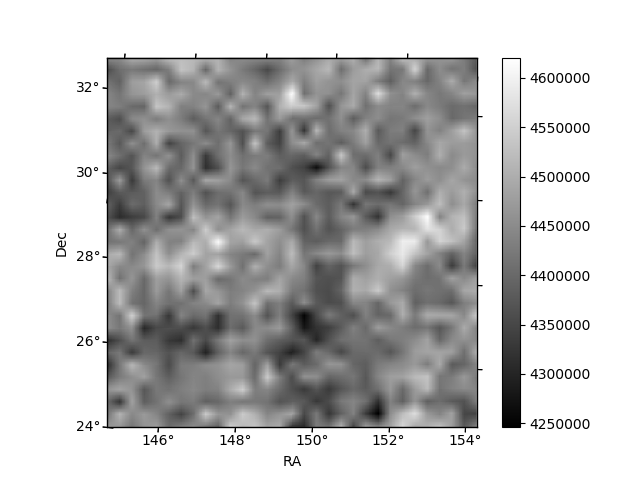
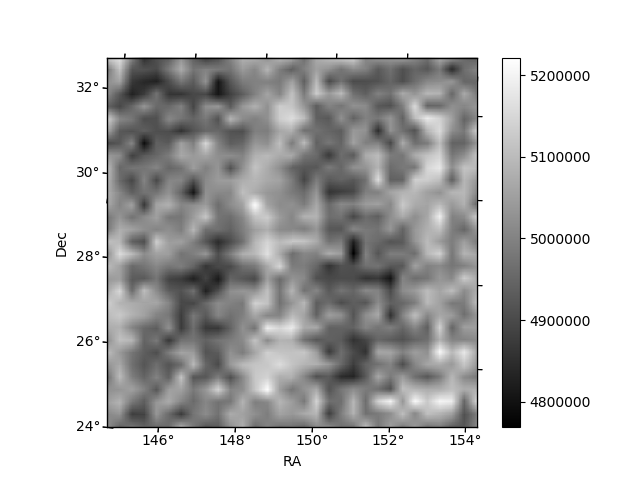
Histogram calculated using DETX and DETY for each event in the final _common_clean file
| Quadrant A |  |
 |
Quadrant B |
|---|---|---|---|
| Quadrant D | 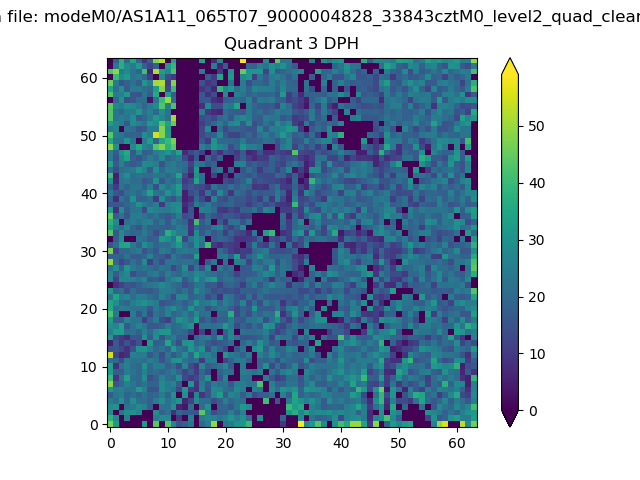 |
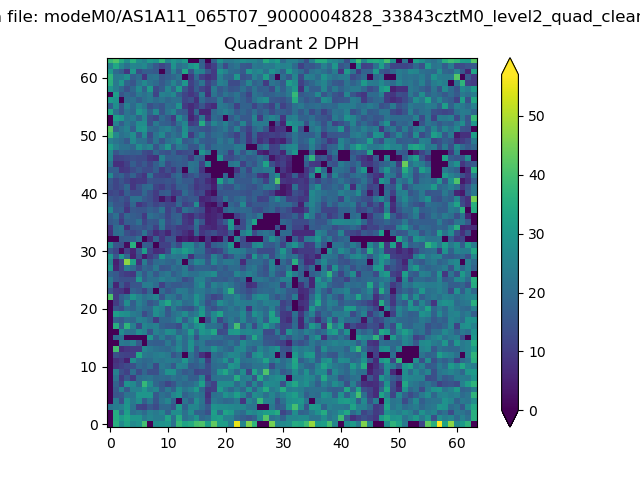 |
Quadrant C |
| Plot type | Count rate plots | Images |
|---|---|---|
| Comparison with Poisson distribution Blue bars denote a histogram of data divided into 1 sec bins. Red curve is a Poisson curve with rate = median count rate of data. |
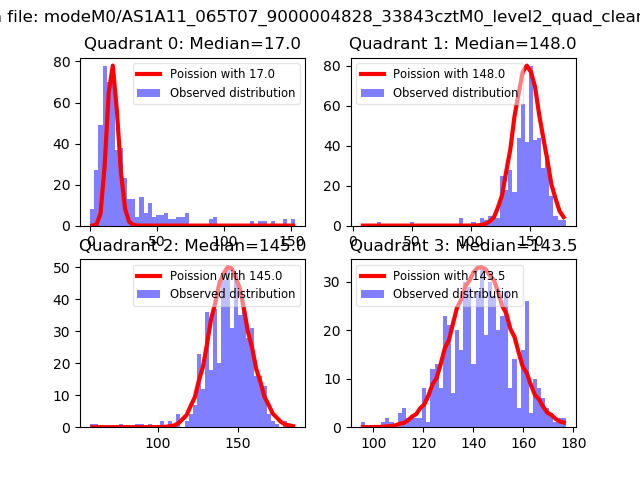 |
 |
| Quadrant-wise count rates Data is divided into 100 sec bins |
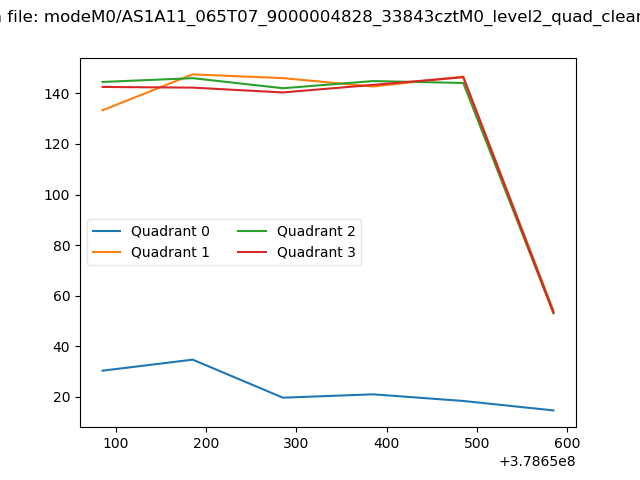 |
|
| Module-wise count rates for Quadrant A Data is divided into 100 sec bins |
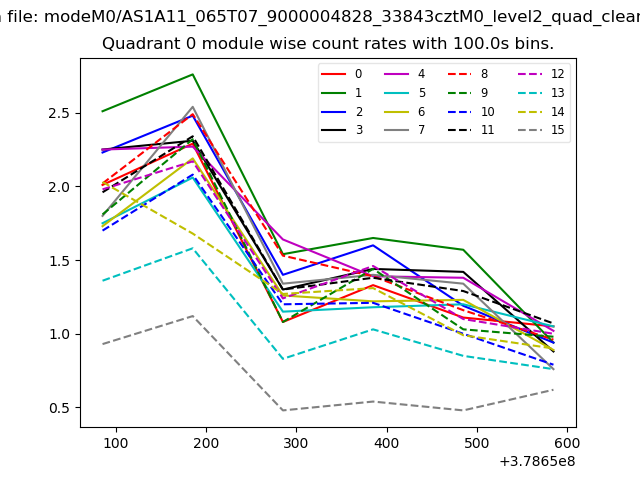 |
 |
| Module-wise count rates for Quadrant B Data is divided into 100 sec bins |
 |
 |
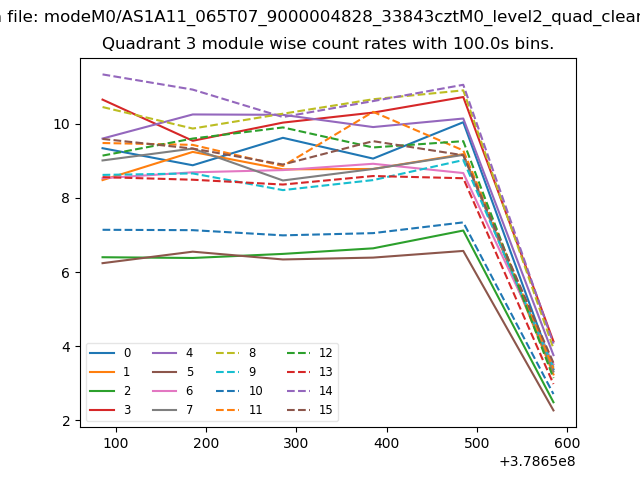
| Module-wise count rates for Quadrant C Data is divided into 100 sec bins |
 |
 |
| Module-wise count rates for Quadrant D Data is divided into 100 sec bins |
 |
 |
| Parameter | Plot |
|---|---|
| CZT HV Monitor |  |
| D_VDD | 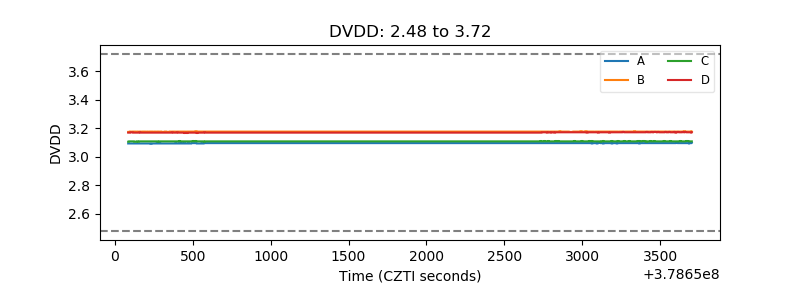 |
| Temperature 1 | 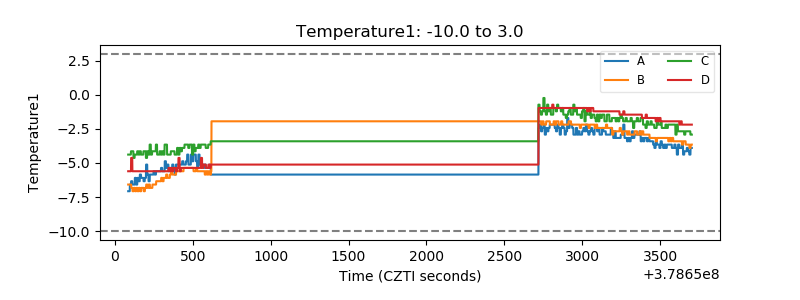 |
| Veto HV Monitor | 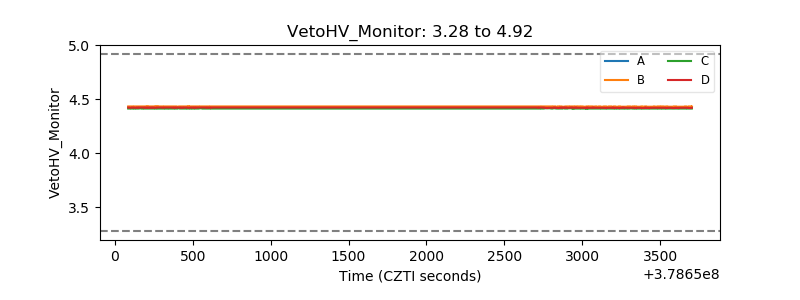 |
| Veto LLD | 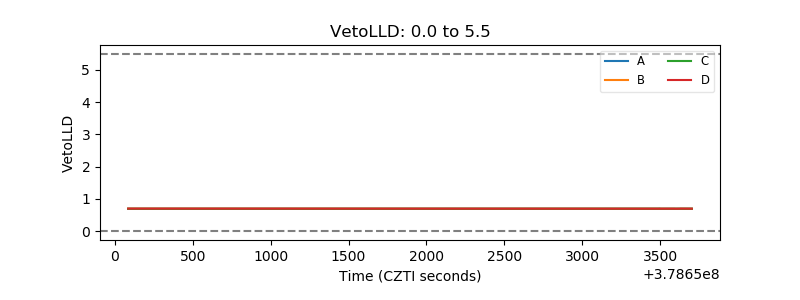 |
| Alpha Counter |  |
| _CPM_Rate | 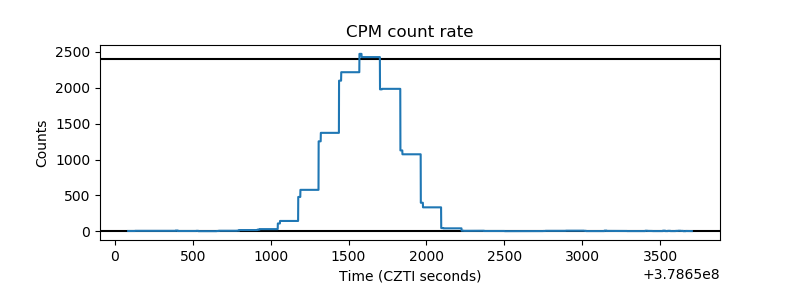 |
| CZT Counter | 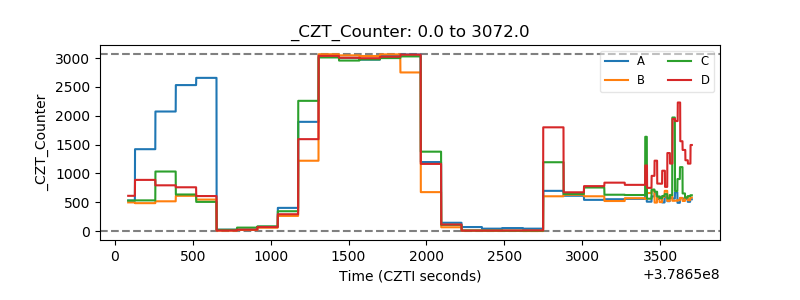 |
| +2.5 Volts monitor |  |
| +5 Volts monitor | 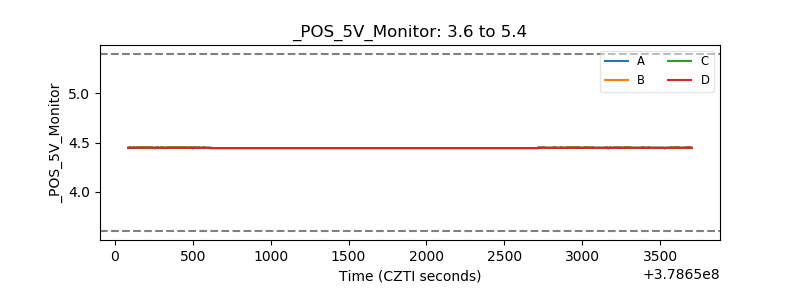 |
| _ROLL_ROT | 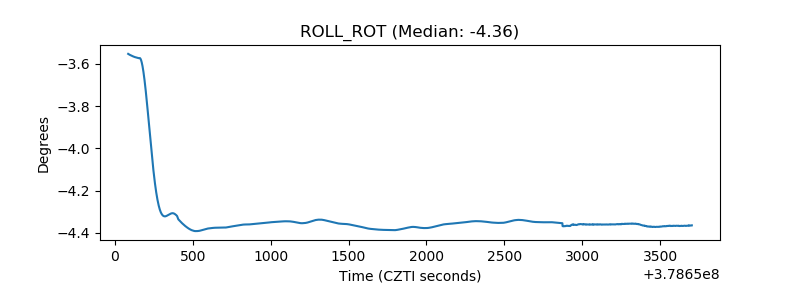 |
| _Roll_DEC | 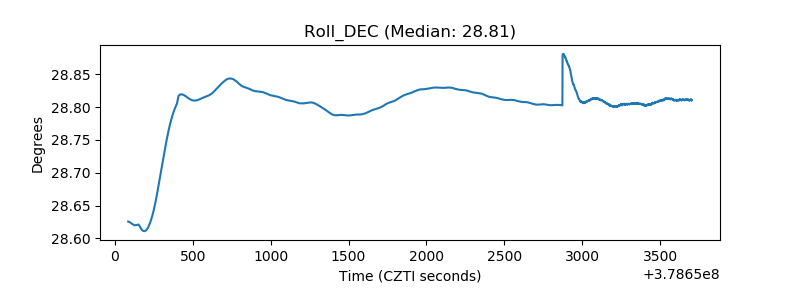 |
| _Roll_RA | 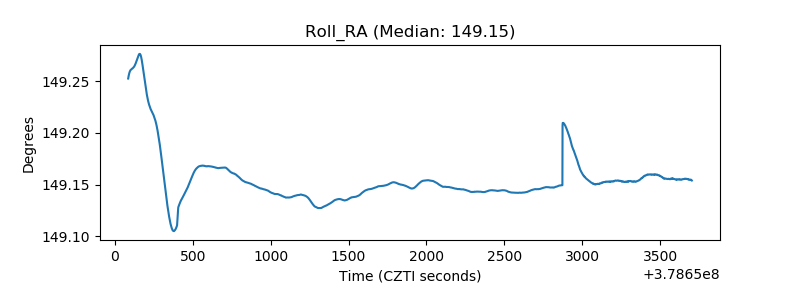 |
| Veto Counter | 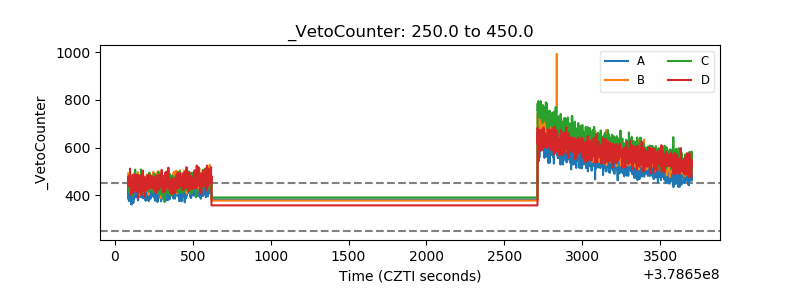 |