| Param | Original file | Final file |
|---|---|---|
| Filename | modeM0/AS1A11_065T07_9000004828_33845cztM0_level2.evt | modeM0/AS1A11_065T07_9000004828_33845cztM0_level2_quad_clean.evt |
| Size (bytes) | 495,083,520 | 78,603,840 |
| Size | 472.1 MB | 75.0 MB |
| Events in quadrant A | 2,858,598 | 515,130 |
| Events in quadrant B | 3,027,564 | 512,378 |
| Events in quadrant C | 3,402,249 | 510,325 |
| Events in quadrant D | 5,363,773 | 488,911 |
| Mode M9 | |||
|---|---|---|---|
| Quadrant | BADHDUFLAG | Total packets | Discarded packets |
| A | 0 | 39 | 0 |
| B | 0 | 39 | 0 |
| C | 0 | 39 | 0 |
| D | 0 | 40 | 0 |
| Mode M0 | |||
|---|---|---|---|
| Quadrant | BADHDUFLAG | Total packets | Discarded packets |
| A | 0 | 11427 | 3 |
| B | 0 | 12063 | 2 |
| C | 0 | 13403 | 2 |
| D | 0 | 19403 | 2 |
| Mode SS | |||
|---|---|---|---|
| Quadrant | BADHDUFLAG | Total packets | Discarded packets |
| A | 0 | 102 | 0 |
| B | 0 | 102 | 0 |
| C | 0 | 102 | 0 |
| D | 0 | 102 | 0 |
| Quadrant | Total seconds | Saturated seconds | Saturation percentage |
|---|---|---|---|
| A | 5045 | 56 | 1.110010% |
| B | 5045 | 144 | 2.854311% |
| C | 5045 | 136 | 2.695738% |
| D | 5045 | 464 | 9.197225% |
Noise dominated data is calculated using 1-second bins in cleaned event files. If a bin has >2000 counts, and if more than 50% of those come from <1% of pixels, then it is considered to be noise-dominated and hence unusable.
| Quadrant | # 1 sec bins | Bins with >0 counts | Bins with >2000 counts | High rate bins dominated by noise | Noise dominated (total time) | Noise dominated (detector-on time) | Marked lightcurve |
|---|---|---|---|---|---|---|---|
| A | 7107 | 5046 | 60 | 60 | 0.84% | 1.19% | 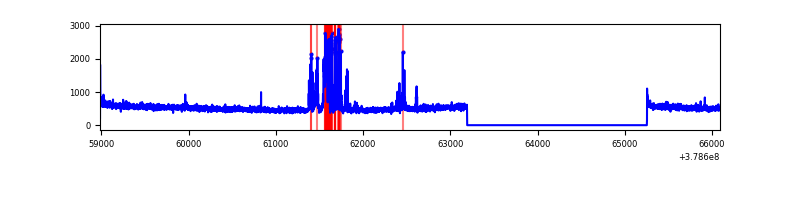 |
| B | 7107 | 5046 | 107 | 107 | 1.51% | 2.12% | 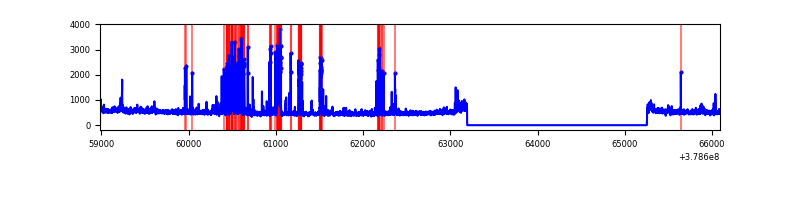 |
| C | 7107 | 5046 | 115 | 115 | 1.62% | 2.28% | 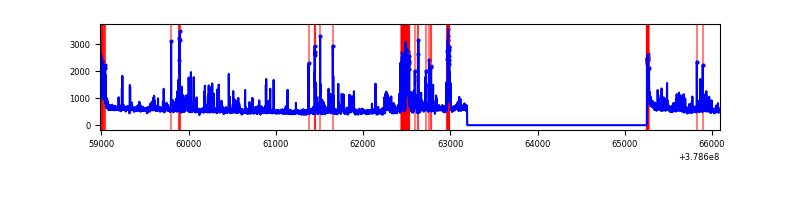 |
| D | 7107 | 5046 | 390 | 390 | 5.49% | 7.73% | 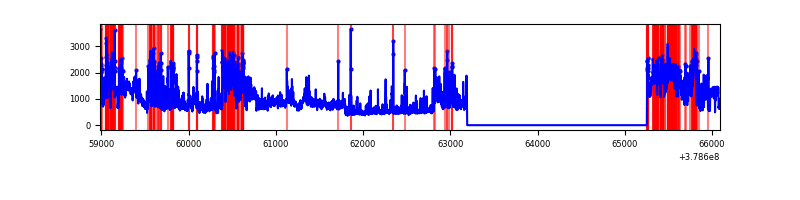 |
Top three noisy pixels from each quadrant. If the there are fewer than three noisy pixels in the level2.evt file, extra rows are filled as -1
| Pixel properties | Quadrant properties | ||||||
|---|---|---|---|---|---|---|---|
| Quadrant | DetID | PixID | Counts | Sigma | Mean | Median | Sigma |
| A | 0 | 254 | 319527 | 2547.35 | 626 | 615 | 125.2 |
| A | 15 | 169 | 89347 | 708.76 | 626 | 615 | 125.2 |
| A | 13 | 6 | 18456 | 142.51 | 626 | 615 | 125.2 |
| B | 5 | 172 | 450344 | 3839.28 | 619 | 604 | 117.1 |
| B | 5 | 200 | 43334 | 364.77 | 619 | 604 | 117.1 |
| B | 0 | 190 | 42842 | 360.57 | 619 | 604 | 117.1 |
| C | 9 | 187 | 292769 | 2076.8 | 610 | 617 | 140.7 |
| C | 15 | 214 | 218725 | 1550.45 | 610 | 617 | 140.7 |
| C | 14 | 254 | 139785 | 989.29 | 610 | 617 | 140.7 |
| D | 12 | 235 | 1278249 | 8696.53 | 600 | 586 | 146.9 |
| D | 8 | 195 | 1077588 | 7330.71 | 600 | 586 | 146.9 |
| D | 12 | 233 | 291201 | 1978.1 | 600 | 586 | 146.9 |
Histogram calculated using DETX and DETY for each event in the final _common_clean file
| Quadrant A |  |
 |
Quadrant B |
|---|---|---|---|
| Quadrant D |  |
 |
Quadrant C |
| Plot type | Count rate plots | Images |
|---|---|---|
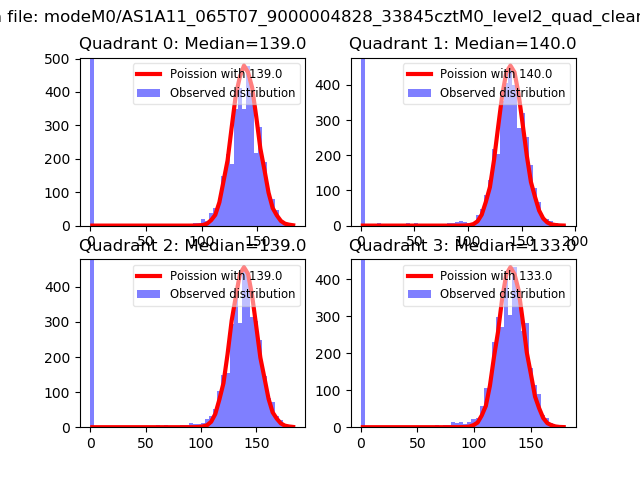
| Comparison with Poisson distribution Blue bars denote a histogram of data divided into 1 sec bins. Red curve is a Poisson curve with rate = median count rate of data. |
 |
 |
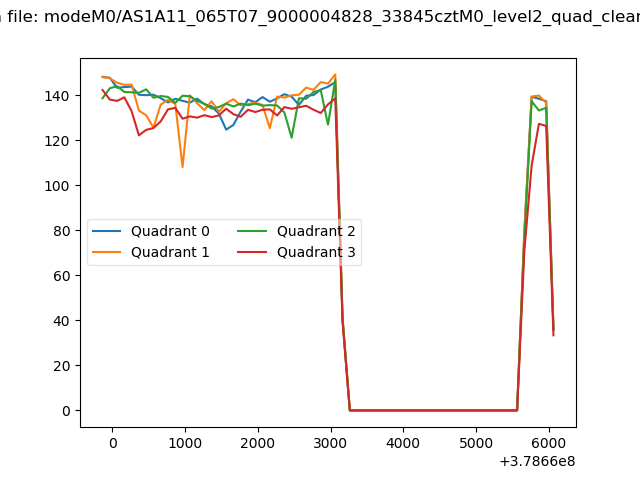
| Quadrant-wise count rates Data is divided into 100 sec bins |
 |
|
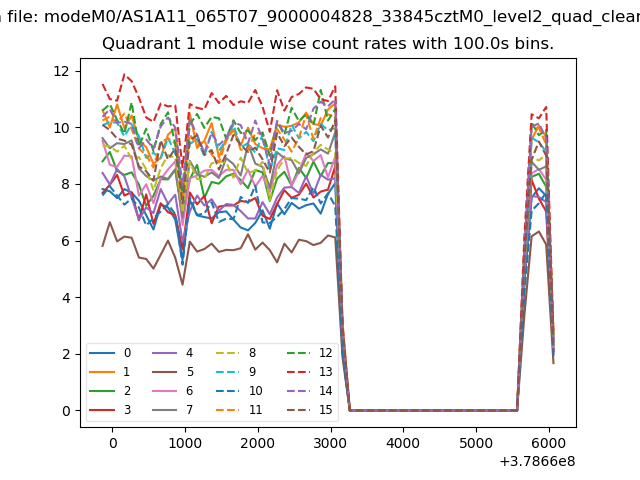
| Module-wise count rates for Quadrant A Data is divided into 100 sec bins |
 |
 |
| Module-wise count rates for Quadrant B Data is divided into 100 sec bins |
 |
 |
| Module-wise count rates for Quadrant C Data is divided into 100 sec bins |
 |
 |
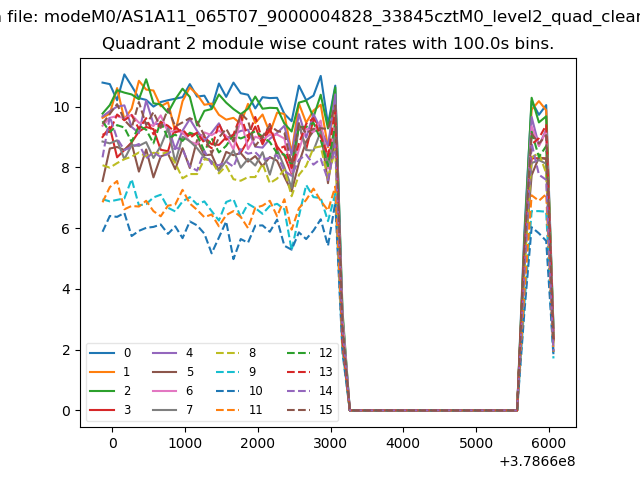
| Module-wise count rates for Quadrant D Data is divided into 100 sec bins |
 |
 |
| Parameter | Plot |
|---|---|
| CZT HV Monitor |  |
| D_VDD |  |
| Temperature 1 |  |
| Veto HV Monitor |  |
| Veto LLD |  |
| Alpha Counter | 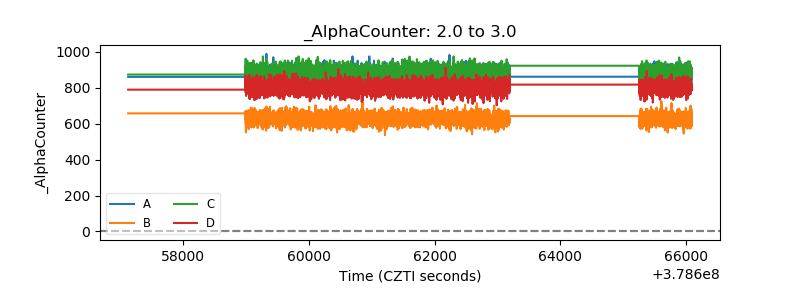 |
| _CPM_Rate | 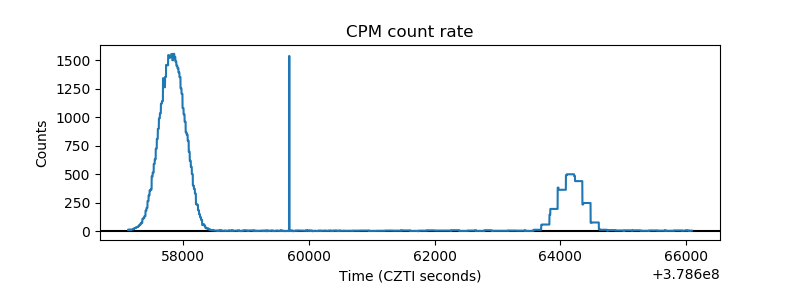 |
| CZT Counter |  |
| +2.5 Volts monitor |  |
| +5 Volts monitor |  |
| _ROLL_ROT |  |
| _Roll_DEC |  |
| _Roll_RA |  |
| Veto Counter |  |