| Param | Original file | Final file |
|---|---|---|
| Filename | modeM0/AS1A11_065T07_9000004828_33846cztM0_level2.evt | modeM0/AS1A11_065T07_9000004828_33846cztM0_level2_quad_clean.evt |
| Size (bytes) | 472,847,040 | 86,846,400 |
| Size | 450.9 MB | 82.8 MB |
| Events in quadrant A | 2,535,549 | 581,444 |
| Events in quadrant B | 3,019,720 | 576,607 |
| Events in quadrant C | 2,912,369 | 578,378 |
| Events in quadrant D | 5,503,975 | 533,233 |
| Mode M9 | |||
|---|---|---|---|
| Quadrant | BADHDUFLAG | Total packets | Discarded packets |
| A | 0 | 36 | 0 |
| B | 0 | 36 | 0 |
| C | 0 | 36 | 0 |
| D | 0 | 37 | 0 |
| Mode M0 | |||
|---|---|---|---|
| Quadrant | BADHDUFLAG | Total packets | Discarded packets |
| A | 0 | 10601 | 2 |
| B | 0 | 12233 | 1 |
| C | 0 | 11691 | 1 |
| D | 0 | 19835 | 1 |
| Mode SS | |||
|---|---|---|---|
| Quadrant | BADHDUFLAG | Total packets | Discarded packets |
| A | 0 | 104 | 0 |
| B | 0 | 104 | 0 |
| C | 0 | 104 | 0 |
| D | 0 | 104 | 0 |
| Quadrant | Total seconds | Saturated seconds | Saturation percentage |
|---|---|---|---|
| A | 5146 | 12 | 0.233191% |
| B | 5146 | 140 | 2.720560% |
| C | 5146 | 50 | 0.971628% |
| D | 5146 | 437 | 8.492033% |
Noise dominated data is calculated using 1-second bins in cleaned event files. If a bin has >2000 counts, and if more than 50% of those come from <1% of pixels, then it is considered to be noise-dominated and hence unusable.
| Quadrant | # 1 sec bins | Bins with >0 counts | Bins with >2000 counts | High rate bins dominated by noise | Noise dominated (total time) | Noise dominated (detector-on time) | Marked lightcurve |
|---|---|---|---|---|---|---|---|
| A | 6998 | 5147 | 5 | 5 | 0.07% | 0.10% | 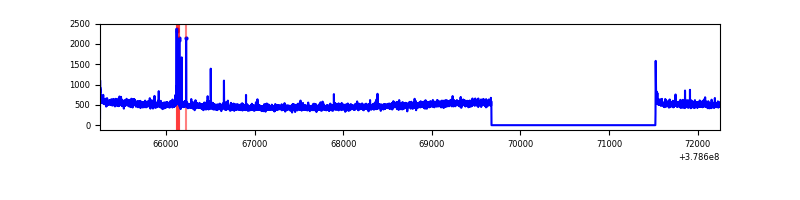 |
| B | 6998 | 5147 | 89 | 89 | 1.27% | 1.73% | 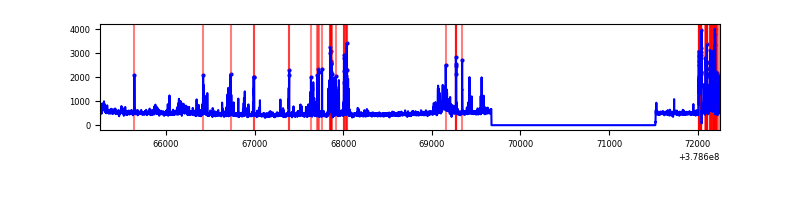 |
| C | 6998 | 5147 | 38 | 38 | 0.54% | 0.74% | 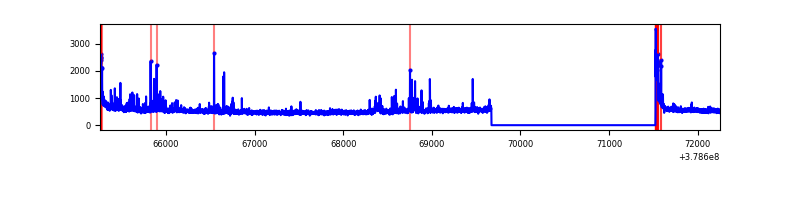 |
| D | 6998 | 5147 | 374 | 374 | 5.34% | 7.27% | 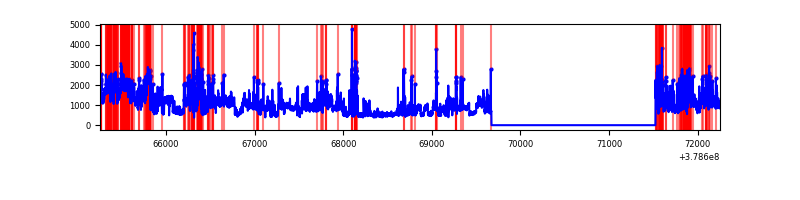 |
Top three noisy pixels from each quadrant. If the there are fewer than three noisy pixels in the level2.evt file, extra rows are filled as -1
| Pixel properties | Quadrant properties | ||||||
|---|---|---|---|---|---|---|---|
| Quadrant | DetID | PixID | Counts | Sigma | Mean | Median | Sigma |
| A | 15 | 169 | 110347 | 887.43 | 612 | 600 | 123.7 |
| A | 7 | 16 | 28482 | 225.46 | 612 | 600 | 123.7 |
| A | 13 | 6 | 18639 | 145.87 | 612 | 600 | 123.7 |
| B | 5 | 172 | 494540 | 4234.9 | 605 | 590 | 116.6 |
| B | 0 | 190 | 41863 | 353.86 | 605 | 590 | 116.6 |
| B | 0 | 199 | 27866 | 233.85 | 605 | 590 | 116.6 |
| C | 15 | 214 | 222901 | 1603.78 | 597 | 603 | 138.6 |
| C | 0 | 10 | 121284 | 870.66 | 597 | 603 | 138.6 |
| C | 14 | 254 | 93980 | 673.67 | 597 | 603 | 138.6 |
| D | 8 | 195 | 1303427 | 8997.91 | 583 | 566 | 144.8 |
| D | 12 | 235 | 967671 | 6679.09 | 583 | 566 | 144.8 |
| D | 2 | 250 | 564687 | 3895.97 | 583 | 566 | 144.8 |
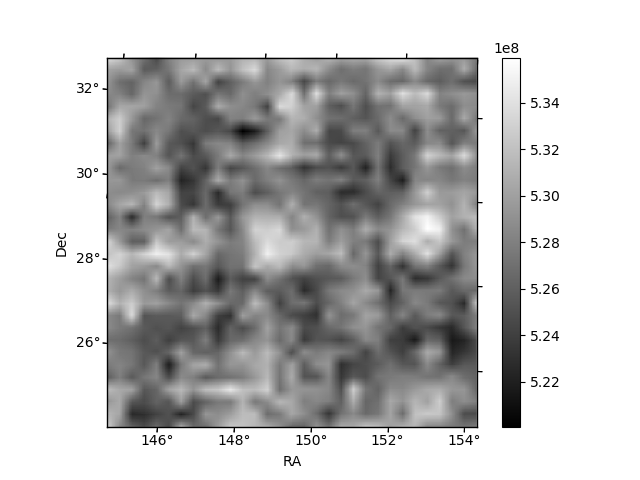
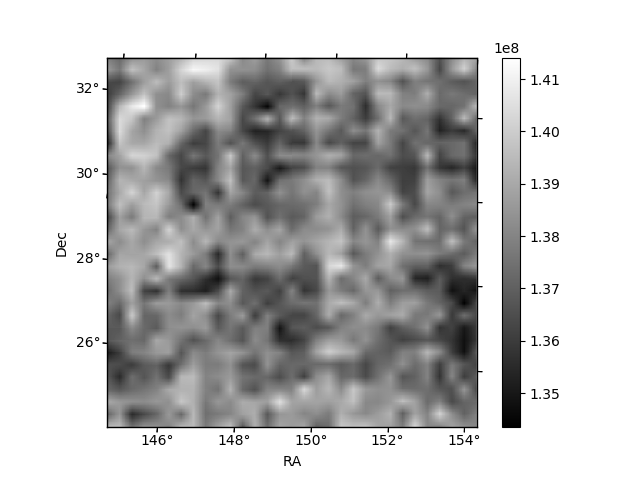
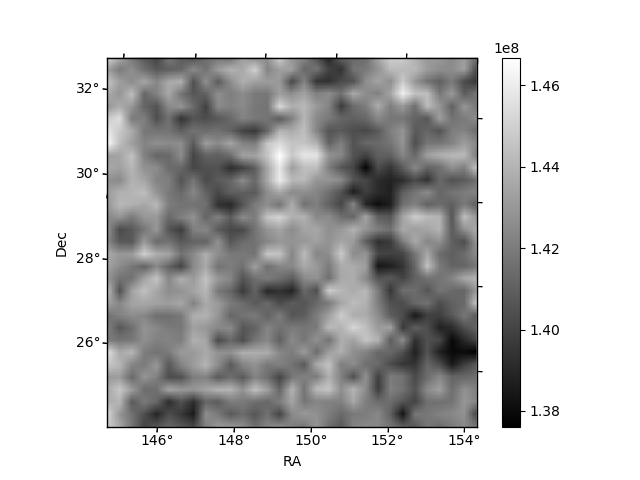
Histogram calculated using DETX and DETY for each event in the final _common_clean file
| Quadrant A | 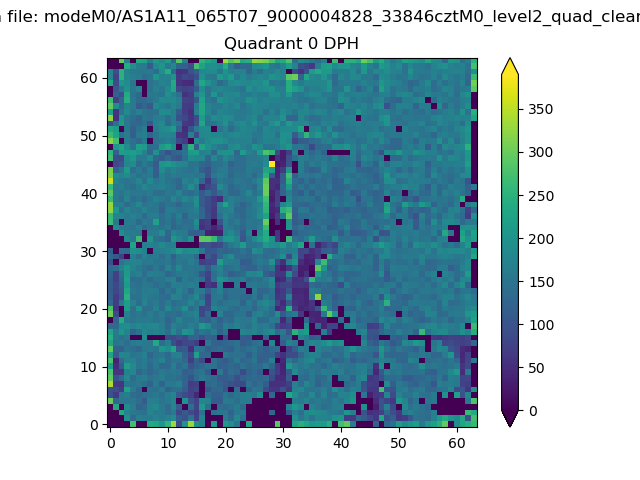 |
 |
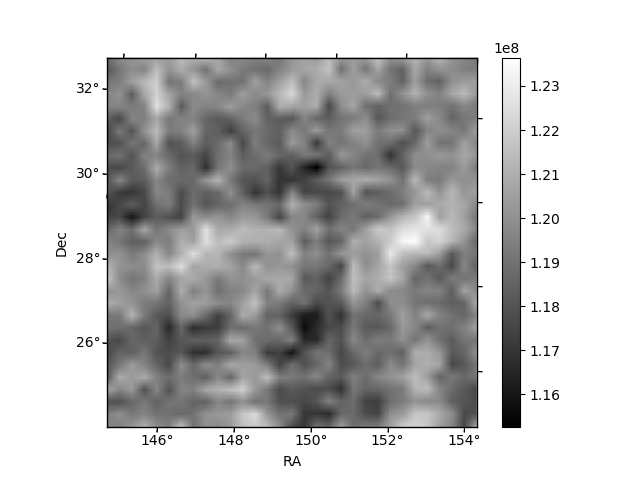
Quadrant B |
|---|---|---|---|
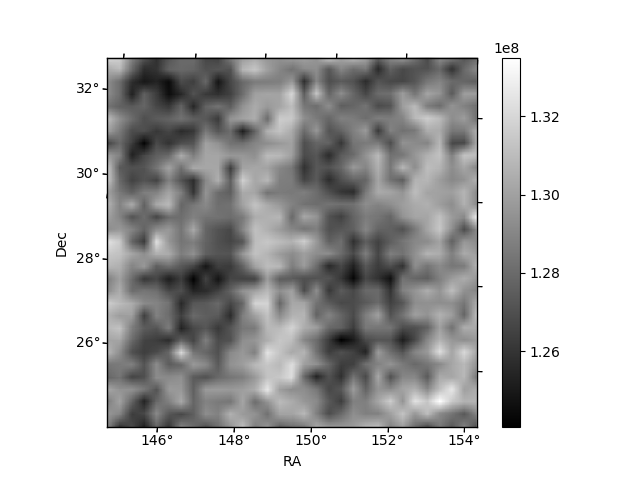
| Quadrant D | 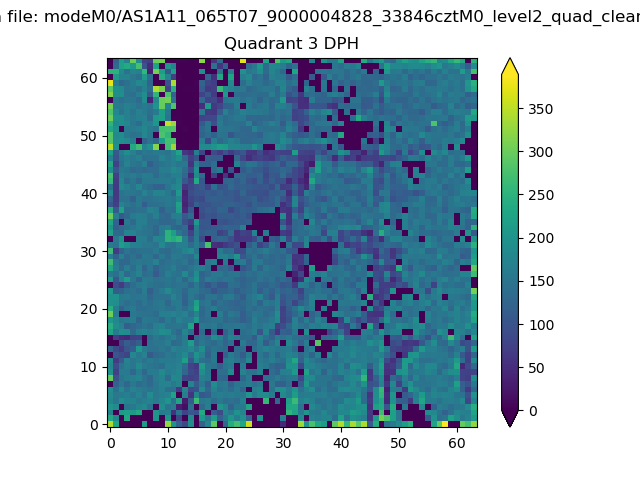 |
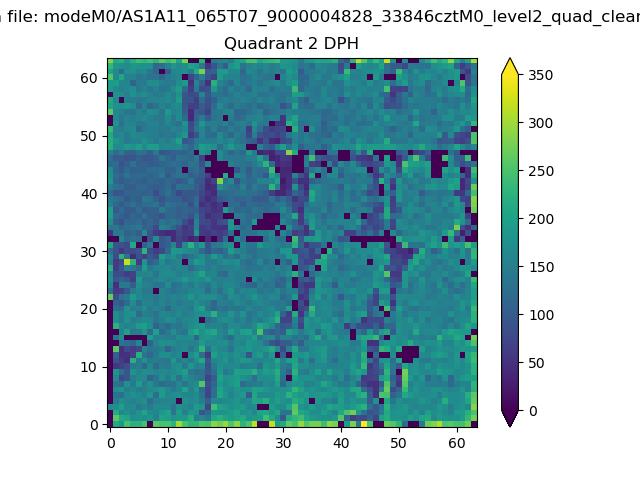 |
Quadrant C |
| Plot type | Count rate plots | Images |
|---|---|---|
| Comparison with Poisson distribution Blue bars denote a histogram of data divided into 1 sec bins. Red curve is a Poisson curve with rate = median count rate of data. |
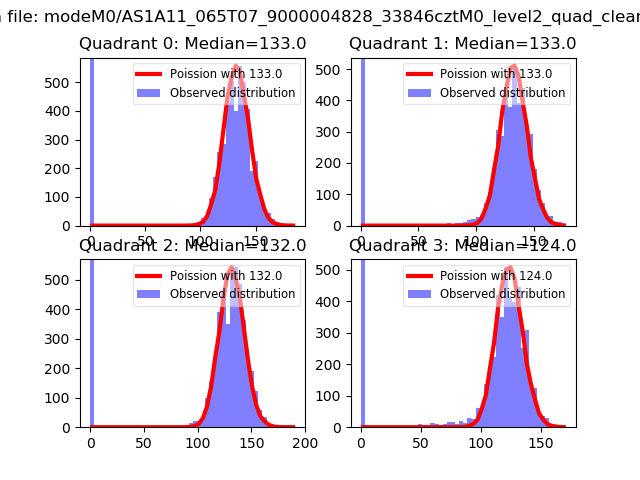 |
 |
| Quadrant-wise count rates Data is divided into 100 sec bins |
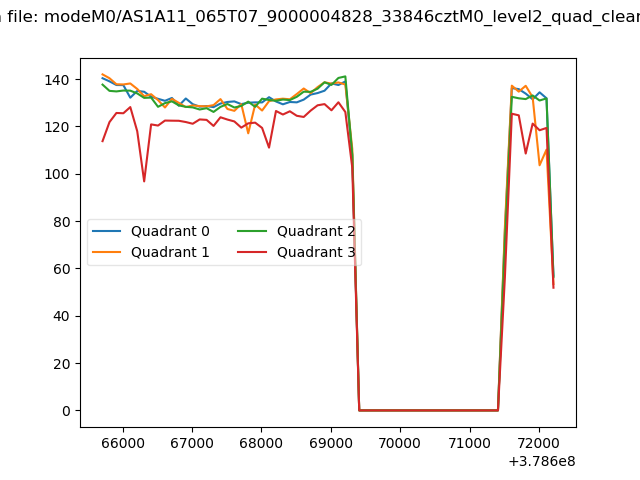 |
|
| Module-wise count rates for Quadrant A Data is divided into 100 sec bins |
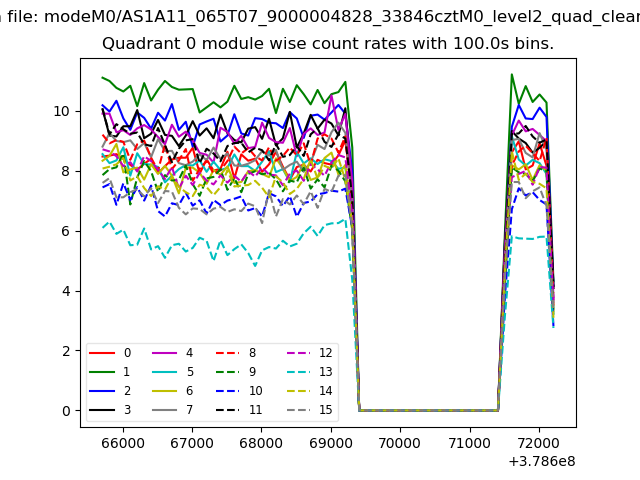 |
 |
| Module-wise count rates for Quadrant B Data is divided into 100 sec bins |
 |
 |
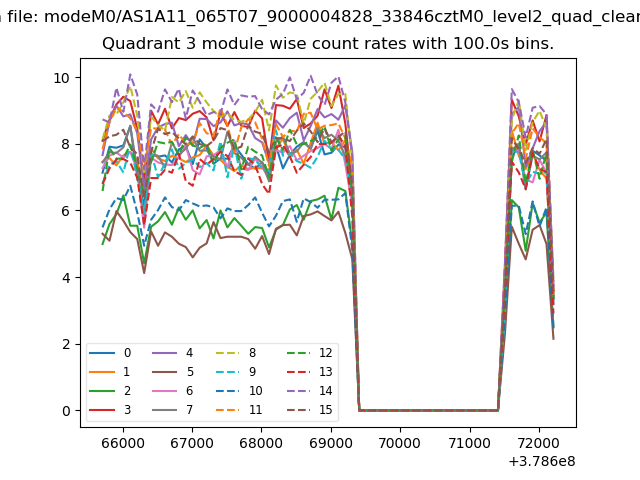
| Module-wise count rates for Quadrant C Data is divided into 100 sec bins |
 |
 |
| Module-wise count rates for Quadrant D Data is divided into 100 sec bins |
 |
 |
| Parameter | Plot |
|---|---|
| CZT HV Monitor |  |
| D_VDD | 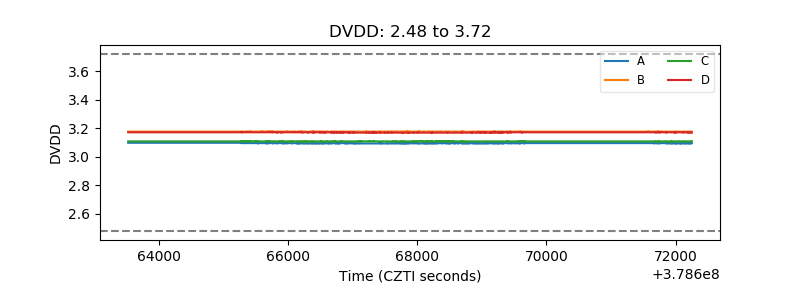 |
| Temperature 1 | 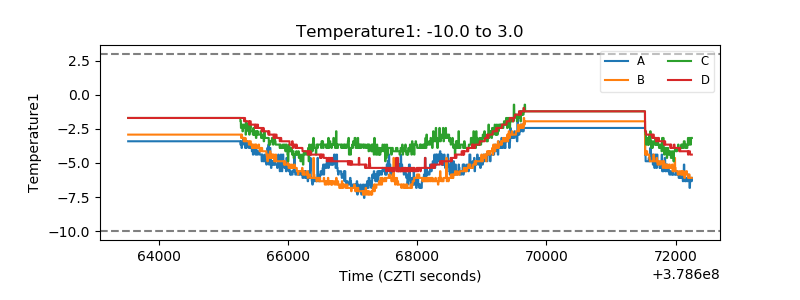 |
| Veto HV Monitor | 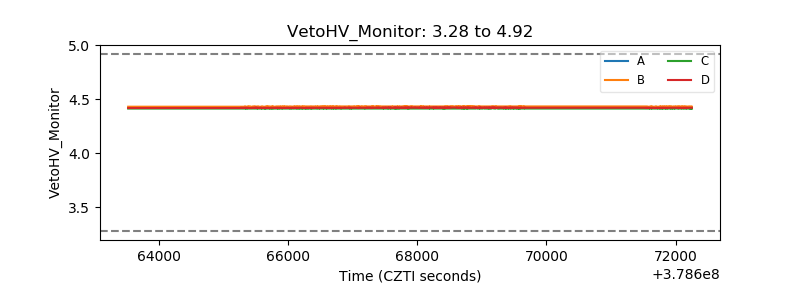 |
| Veto LLD | 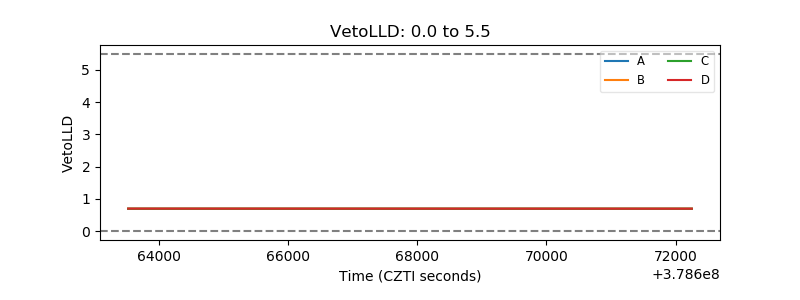 |
| Alpha Counter |  |
| _CPM_Rate | 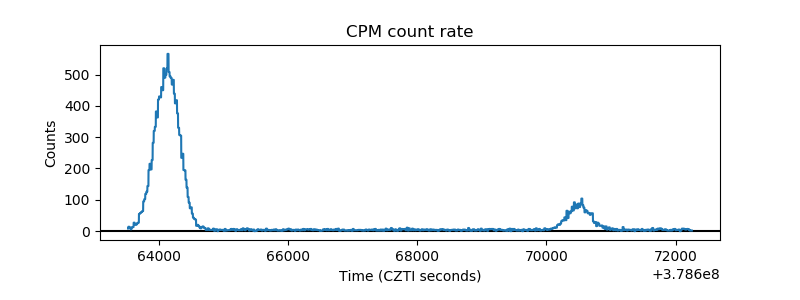 |
| CZT Counter | 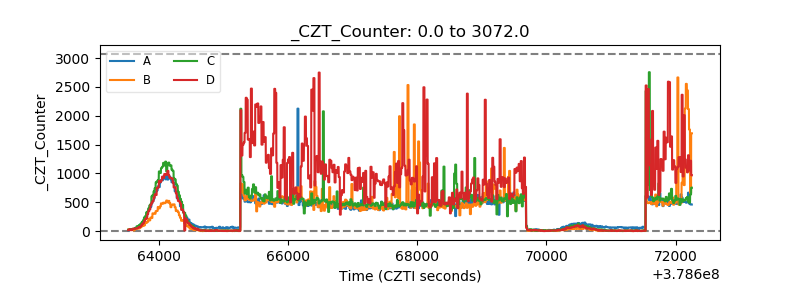 |
| +2.5 Volts monitor |  |
| +5 Volts monitor | 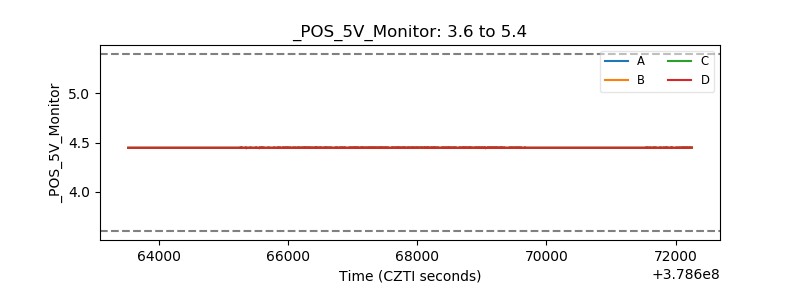 |
| _ROLL_ROT | 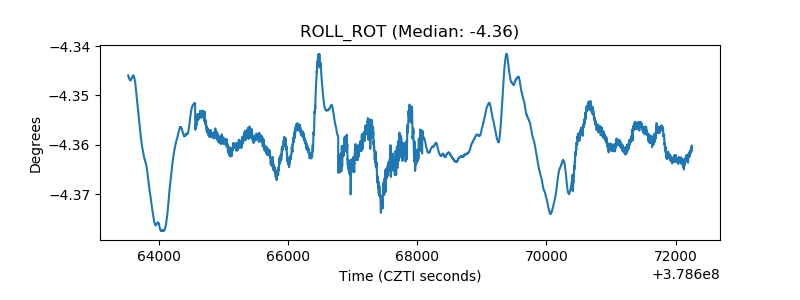 |
| _Roll_DEC | 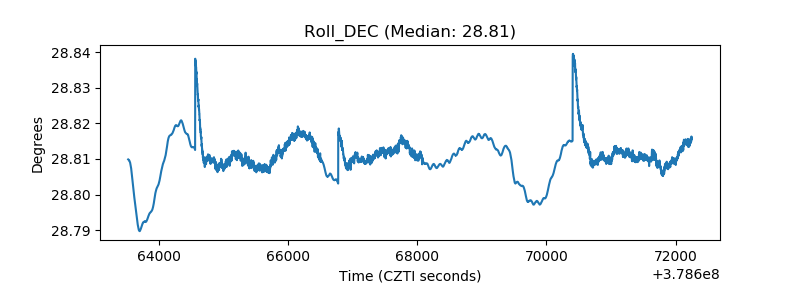 |
| _Roll_RA | 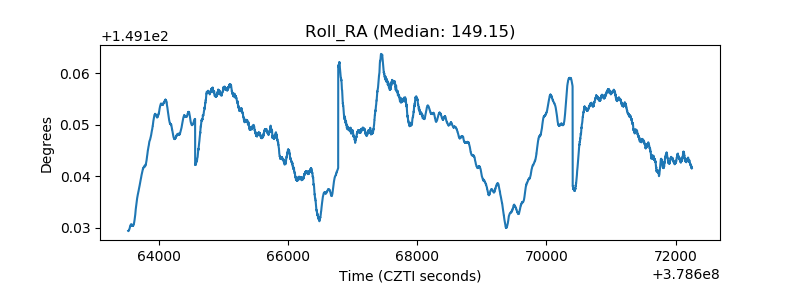 |
| Veto Counter | 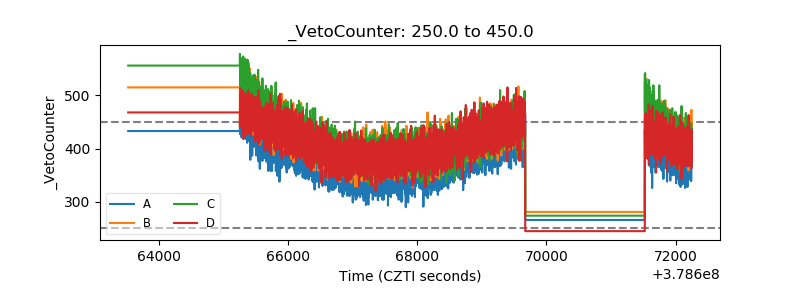 |