| Param | Original file | Final file |
|---|---|---|
| Filename | modeM0/AS1A11_065T07_9000004828_33847cztM0_level2.evt | modeM0/AS1A11_065T07_9000004828_33847cztM0_level2_quad_clean.evt |
| Size (bytes) | 167,042,880 | 27,743,040 |
| Size | 159.3 MB | 26.5 MB |
| Events in quadrant A | 877,859 | 185,141 |
| Events in quadrant B | 1,201,776 | 179,165 |
| Events in quadrant C | 1,005,695 | 183,113 |
| Events in quadrant D | 1,856,159 | 167,479 |
| Mode M9 | |||
|---|---|---|---|
| Quadrant | BADHDUFLAG | Total packets | Discarded packets |
| A | 0 | 19 | 0 |
| B | 0 | 19 | 0 |
| C | 0 | 19 | 0 |
| D | 0 | 19 | 0 |
| Mode M0 | |||
|---|---|---|---|
| Quadrant | BADHDUFLAG | Total packets | Discarded packets |
| A | 0 | 3532 | 0 |
| B | 0 | 4598 | 0 |
| C | 0 | 3927 | 0 |
| D | 0 | 6705 | 0 |
| Mode SS | |||
|---|---|---|---|
| Quadrant | BADHDUFLAG | Total packets | Discarded packets |
| A | 0 | 34 | 0 |
| B | 0 | 34 | 0 |
| C | 0 | 34 | 0 |
| D | 0 | 34 | 0 |
| Quadrant | Total seconds | Saturated seconds | Saturation percentage |
|---|---|---|---|
| A | 1705 | 4 | 0.234604% |
| B | 1705 | 116 | 6.803519% |
| C | 1705 | 29 | 1.700880% |
| D | 1705 | 135 | 7.917889% |
Noise dominated data is calculated using 1-second bins in cleaned event files. If a bin has >2000 counts, and if more than 50% of those come from <1% of pixels, then it is considered to be noise-dominated and hence unusable.
| Quadrant | # 1 sec bins | Bins with >0 counts | Bins with >2000 counts | High rate bins dominated by noise | Noise dominated (total time) | Noise dominated (detector-on time) | Marked lightcurve |
|---|---|---|---|---|---|---|---|
| A | 3557 | 1706 | 0 | 0 | 0.00% | 0.00% | 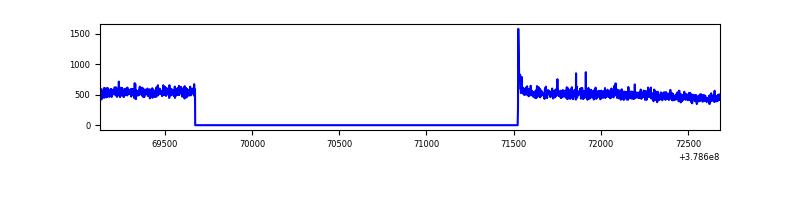 |
| B | 3557 | 1706 | 64 | 64 | 1.80% | 3.75% | 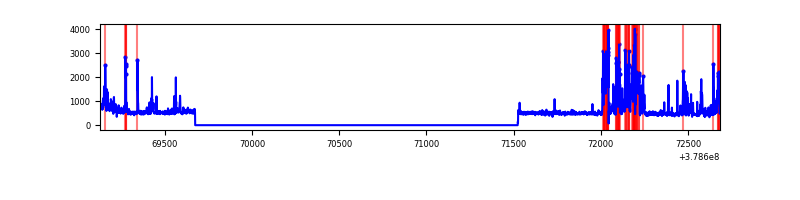 |
| C | 3557 | 1706 | 23 | 23 | 0.65% | 1.35% | 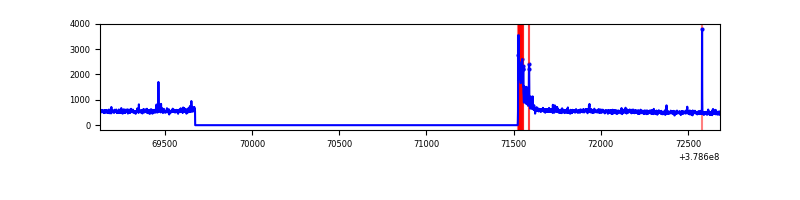 |
| D | 3557 | 1706 | 113 | 113 | 3.18% | 6.62% | 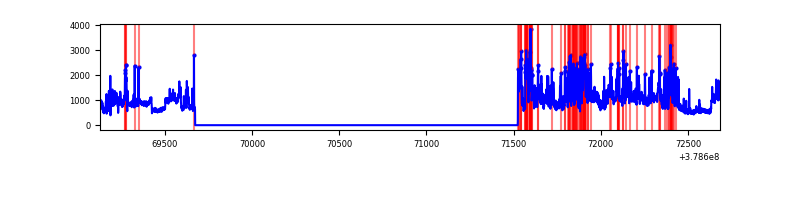 |
Top three noisy pixels from each quadrant. If the there are fewer than three noisy pixels in the level2.evt file, extra rows are filled as -1
| Pixel properties | Quadrant properties | ||||||
|---|---|---|---|---|---|---|---|
| Quadrant | DetID | PixID | Counts | Sigma | Mean | Median | Sigma |
| A | 15 | 169 | 40962 | 917.28 | 212 | 208 | 44.4 |
| A | 13 | 6 | 7766 | 170.11 | 212 | 208 | 44.4 |
| A | 10 | 83 | 5197 | 112.29 | 212 | 208 | 44.4 |
| B | 5 | 172 | 353075 | 8405.4 | 206 | 200 | 42.0 |
| B | 0 | 190 | 20275 | 478.18 | 206 | 200 | 42.0 |
| B | 12 | 111 | 4755 | 108.5 | 206 | 200 | 42.0 |
| C | 15 | 214 | 75859 | 1527.27 | 206 | 208 | 49.5 |
| C | 0 | 10 | 75745 | 1524.96 | 206 | 208 | 49.5 |
| C | 14 | 254 | 23655 | 473.36 | 206 | 208 | 49.5 |
| D | 8 | 195 | 363201 | 7042.75 | 202 | 196 | 51.5 |
| D | 2 | 250 | 346153 | 6712.0 | 202 | 196 | 51.5 |
| D | 12 | 235 | 208247 | 4036.45 | 202 | 196 | 51.5 |
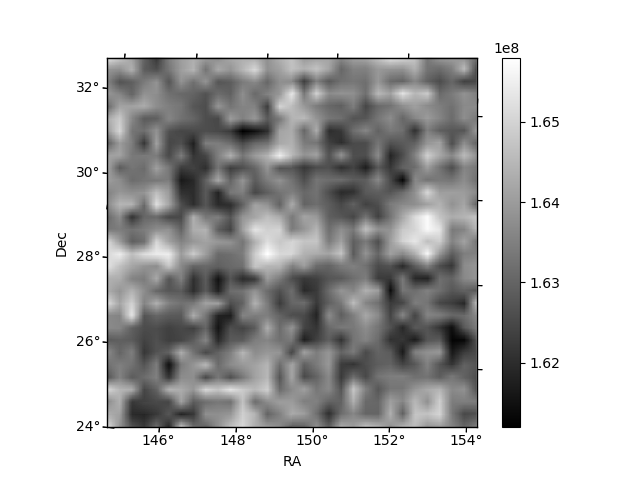
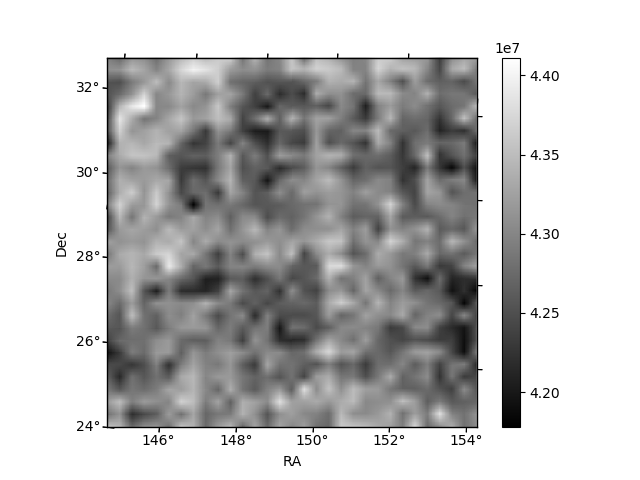
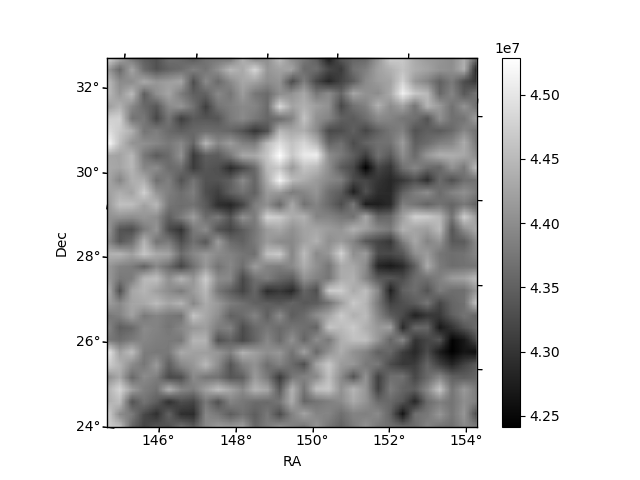
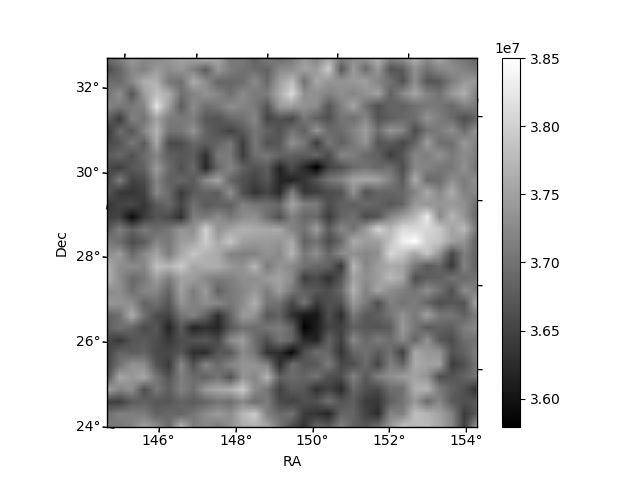
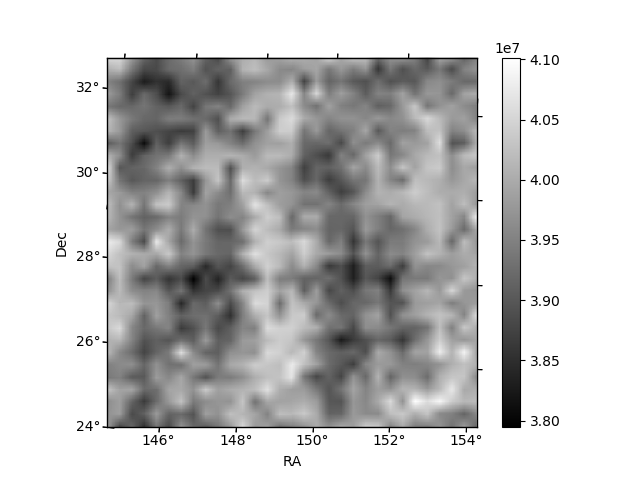
Histogram calculated using DETX and DETY for each event in the final _common_clean file
| Quadrant A | 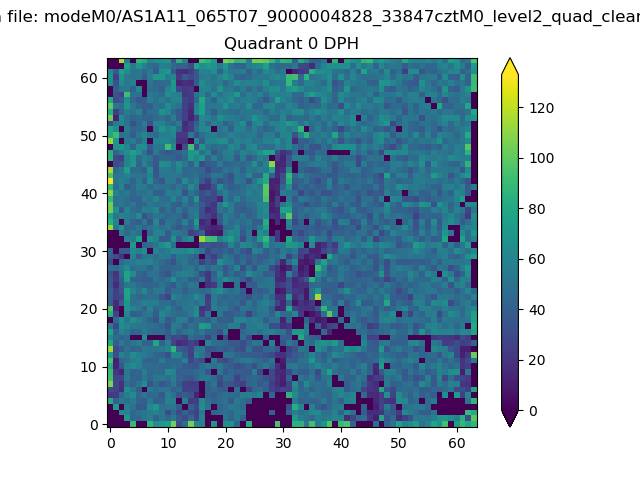 |
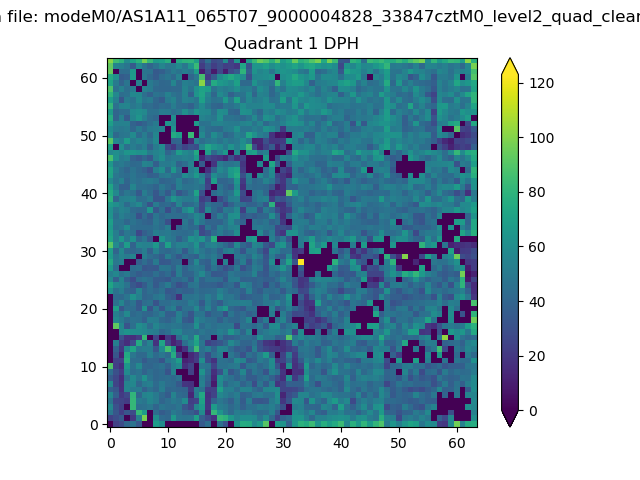 |
Quadrant B |
|---|---|---|---|
| Quadrant D | 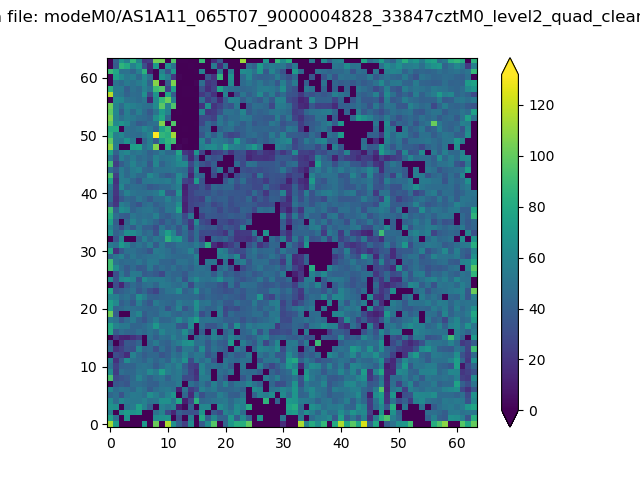 |
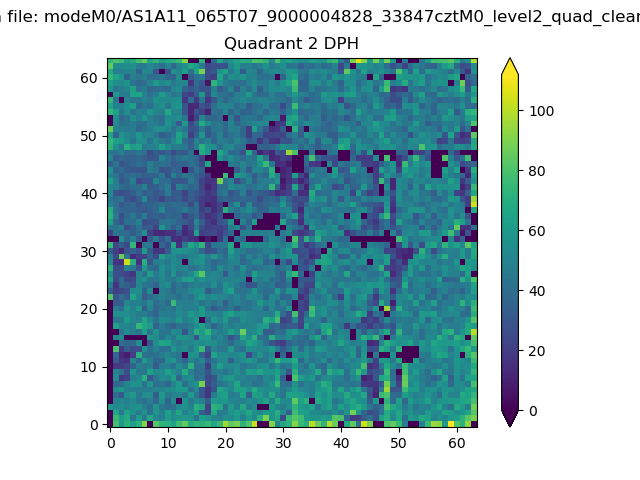 |
Quadrant C |
| Plot type | Count rate plots | Images |
|---|---|---|
| Comparison with Poisson distribution Blue bars denote a histogram of data divided into 1 sec bins. Red curve is a Poisson curve with rate = median count rate of data. |
 |
 |
| Quadrant-wise count rates Data is divided into 100 sec bins |
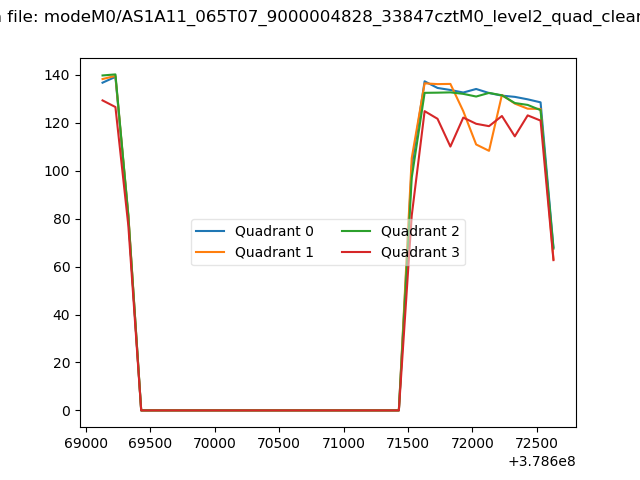 |
|
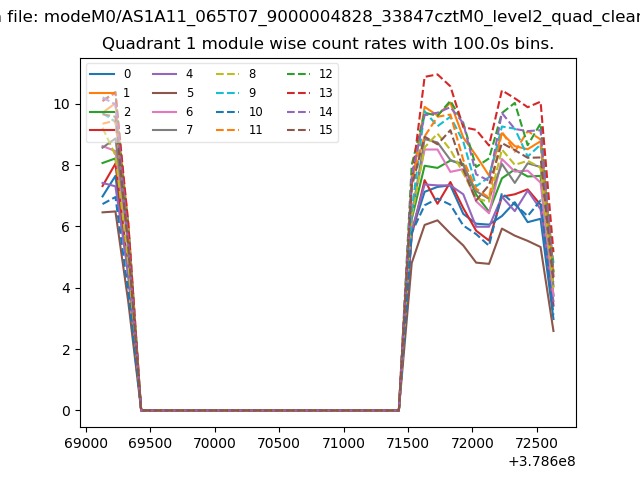
| Module-wise count rates for Quadrant A Data is divided into 100 sec bins |
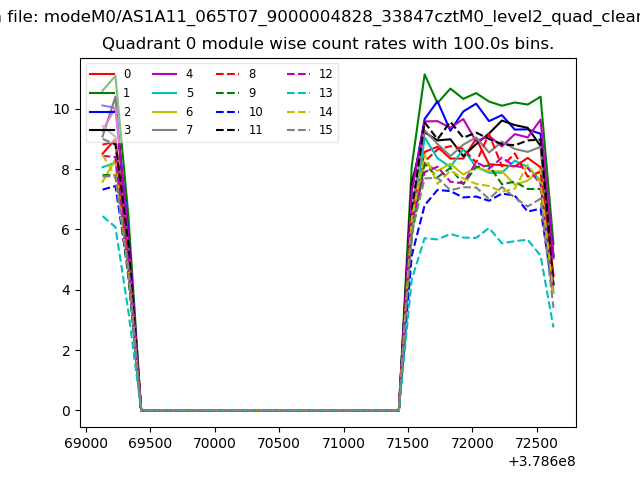 |
 |
| Module-wise count rates for Quadrant B Data is divided into 100 sec bins |
 |
 |
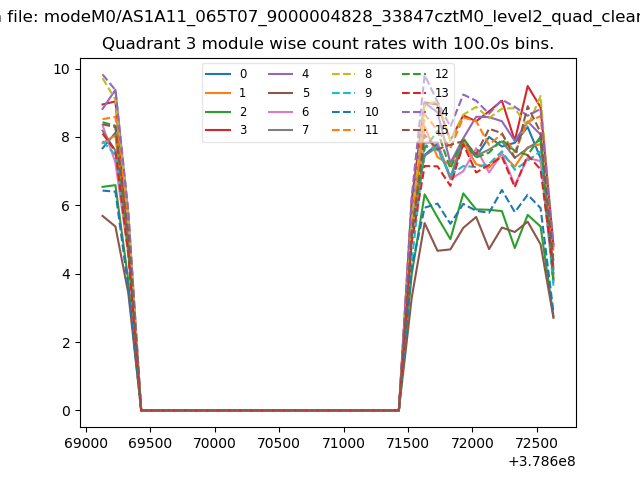
| Module-wise count rates for Quadrant C Data is divided into 100 sec bins |
 |
 |
| Module-wise count rates for Quadrant D Data is divided into 100 sec bins |
 |
 |
| Parameter | Plot |
|---|---|
| CZT HV Monitor | 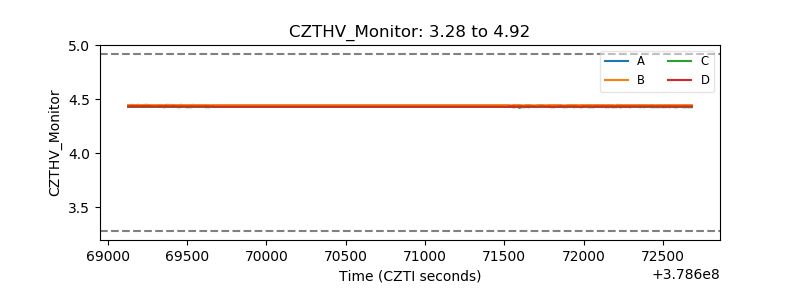 |
| D_VDD | 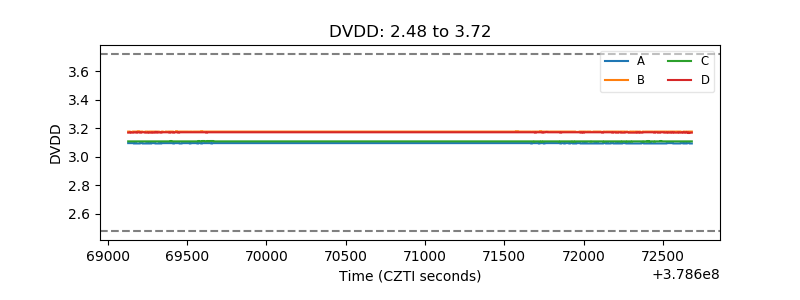 |
| Temperature 1 | 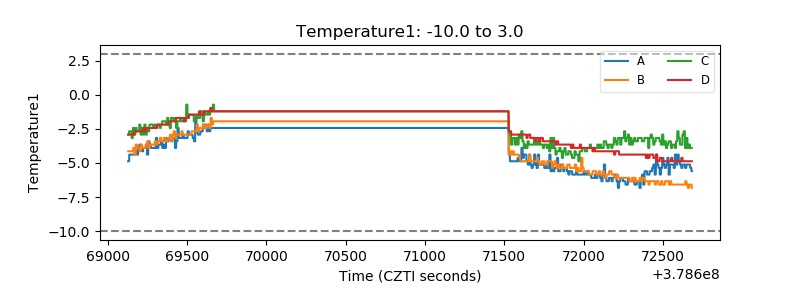 |
| Veto HV Monitor |  |
| Veto LLD | 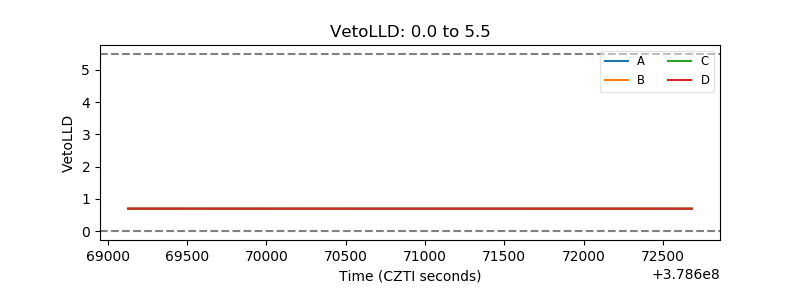 |
| Alpha Counter |  |
| _CPM_Rate | 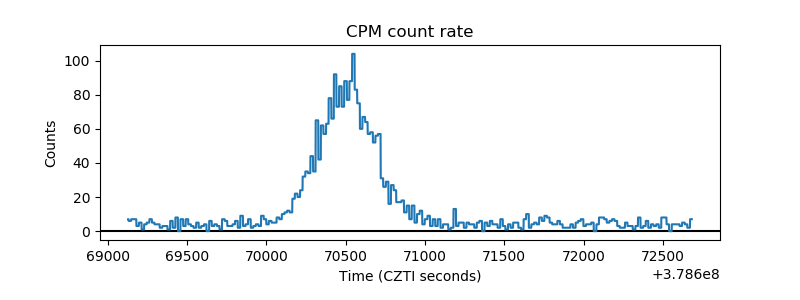 |
| CZT Counter | 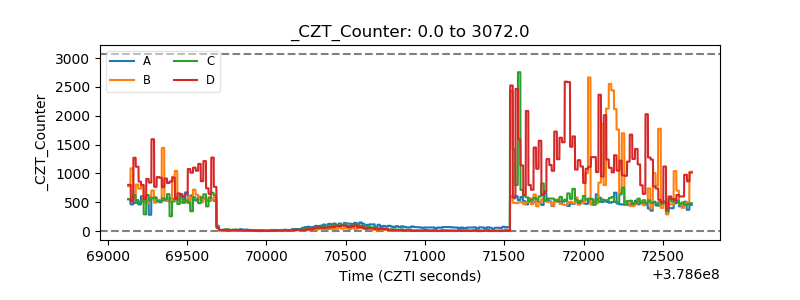 |
| +2.5 Volts monitor |  |
| +5 Volts monitor |  |
| _ROLL_ROT | 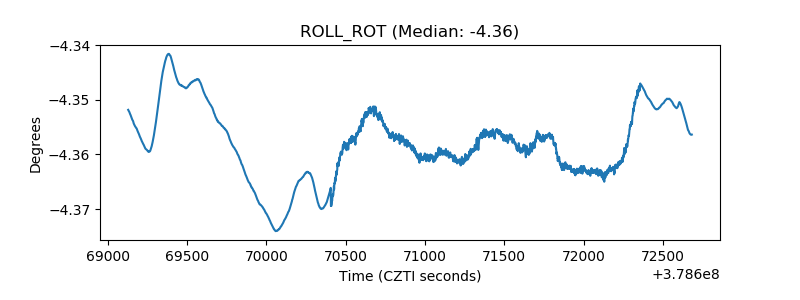 |
| _Roll_DEC | 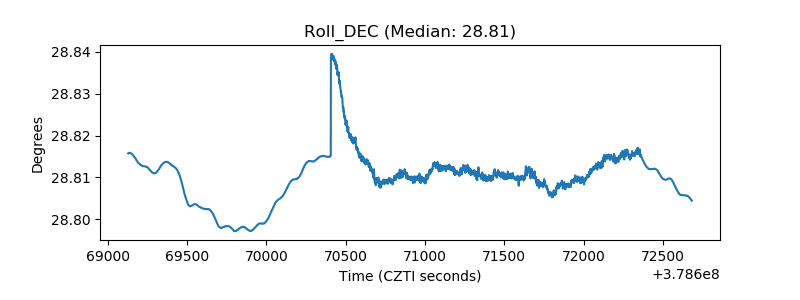 |
| _Roll_RA | 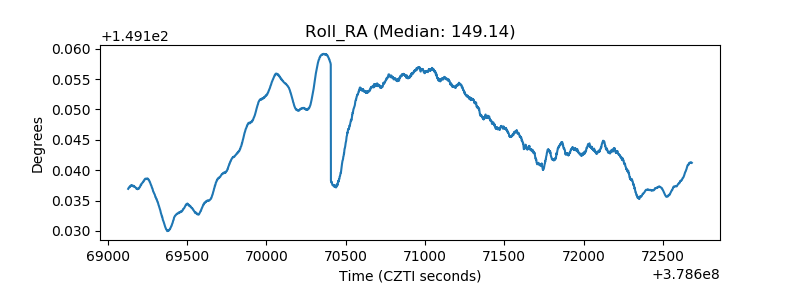 |
| Veto Counter | 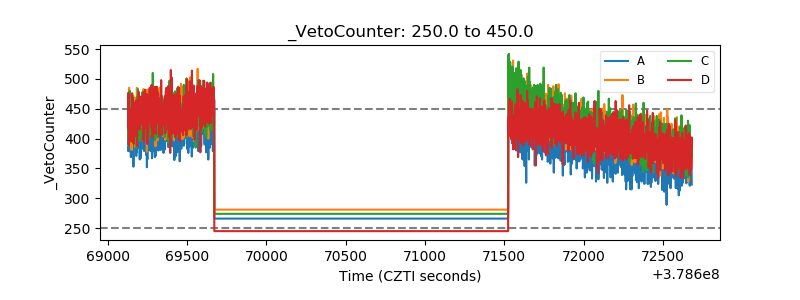 |