| Param | Original file | Final file |
|---|---|---|
| Filename | modeM0/AS1A11_065T11_9000004830cztM0_level2.fits | modeM0/AS1A11_065T11_9000004830cztM0_level2_quad_clean.evt |
| Size (bytes) | 276,128,640 | 238,034,880 |
| Size | 263.3 MB | 227.0 MB |
| Events in quadrant A | 1,718,764 | 1,398,830 |
| Events in quadrant B | 1,570,740 | 1,281,275 |
| Events in quadrant C | 1,669,578 | 1,338,313 |
| Events in quadrant D | 1,369,984 | 1,157,720 |
| Mode SS | |||
|---|---|---|---|
| Quadrant | BADHDUFLAG | Total packets | Discarded packets |
| A | 0 | 606 | 0 |
| B | 0 | 602 | 0 |
| C | 0 | 602 | 0 |
| D | 0 | 602 | 0 |
| Mode M0 | |||
|---|---|---|---|
| Quadrant | BADHDUFLAG | Total packets | Discarded packets |
| A | 0 | 61036 | 0 |
| B | 0 | 80999 | 0 |
| C | 0 | 64328 | 0 |
| D | 0 | 110498 | 0 |
| Mode M9 | |||
|---|---|---|---|
| Quadrant | BADHDUFLAG | Total packets | Discarded packets |
| A | 0 | 99 | 0 |
| B | 0 | 99 | 0 |
| C | 0 | 99 | 0 |
| D | 0 | 99 | 0 |
| Quadrant | Total seconds | Saturated seconds | Saturation percentage |
|---|---|---|---|
| A | 29573 | 54 | 0.182599% |
| B | 29557 | 2179 | 7.372196% |
| C | 29577 | 148 | 0.500389% |
| D | 29544 | 2979 | 10.083266% |
Noise dominated data is calculated using 1-second bins in cleaned event files. If a bin has >2000 counts, and if more than 50% of those come from <1% of pixels, then it is considered to be noise-dominated and hence unusable.
| Quadrant | # 1 sec bins | Bins with >0 counts | Bins with >2000 counts | High rate bins dominated by noise | Noise dominated (total time) | Noise dominated (detector-on time) | Marked lightcurve |
|---|---|---|---|---|---|---|---|
| A | 45787 | 29623 | 0 | 0 | 0.00% | 0.00% |  |
| B | 45787 | 29580 | 0 | 0 | 0.00% | 0.00% |  |
| C | 45787 | 29614 | 0 | 0 | 0.00% | 0.00% |  |
| D | 45787 | 29487 | 0 | 0 | 0.00% | 0.00% | 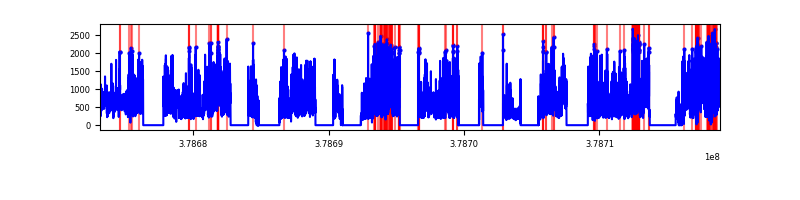 |
Top three noisy pixels from each quadrant. If the there are fewer than three noisy pixels in the level2.evt file, extra rows are filled as -1
| Pixel properties | Quadrant properties | ||||||
|---|---|---|---|---|---|---|---|
| Quadrant | DetID | PixID | Counts | Sigma | Mean | Median | Sigma |
| A | 9 | 19 | 1403 | 8.8 | 447 | 420 | 111.7 |
| A | 7 | 110 | 1395 | 8.73 | 447 | 420 | 111.7 |
| A | 0 | 29 | 1351 | 8.34 | 447 | 420 | 111.7 |
| B | 2 | 9 | 1397 | 12.11 | 416 | 397 | 82.6 |
| B | 3 | 80 | 1180 | 9.48 | 416 | 397 | 82.6 |
| B | 2 | 8 | 1162 | 9.26 | 416 | 397 | 82.6 |
| C | 1 | 81 | 1375 | 8.49 | 441 | 414 | 113.2 |
| C | 1 | 80 | 1323 | 8.03 | 441 | 414 | 113.2 |
| C | 3 | 187 | 1137 | 6.38 | 441 | 414 | 113.2 |
| D | 10 | 189 | 1012 | 6.22 | 392 | 358 | 105.0 |
| D | 4 | 160 | 1001 | 6.12 | 392 | 358 | 105.0 |
| D | 7 | 3 | 984 | 5.96 | 392 | 358 | 105.0 |
Histogram calculated using DETX and DETY for each event in the final _common_clean file
| Quadrant A |  |
 |
Quadrant B |
|---|---|---|---|
| Quadrant D |  |
 |
Quadrant C |
| Plot type | Count rate plots | Images |
|---|---|---|
| Comparison with Poisson distribution Blue bars denote a histogram of data divided into 1 sec bins. Red curve is a Poisson curve with rate = median count rate of data. |
 |
 |
| Quadrant-wise count rates Data is divided into 100 sec bins |
 |
|
| Module-wise count rates for Quadrant A Data is divided into 100 sec bins |
 |
 |
| Module-wise count rates for Quadrant B Data is divided into 100 sec bins |
 |
 |
| Module-wise count rates for Quadrant C Data is divided into 100 sec bins |
 |
 |
| Module-wise count rates for Quadrant D Data is divided into 100 sec bins |
 |
 |
| Parameter | Plot |
|---|---|
| CZT HV Monitor |  |
| D_VDD |  |
| Temperature 1 | 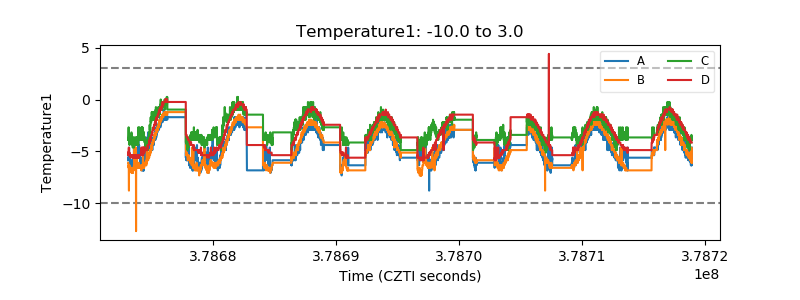 |
| Veto HV Monitor |  |
| Veto LLD |  |
| Alpha Counter |  |
| _CPM_Rate |  |
| CZT Counter | 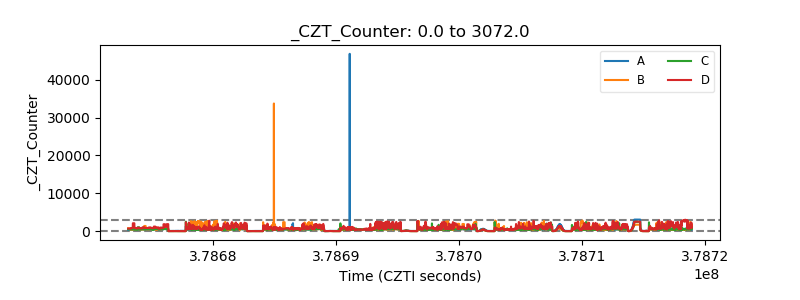 |
| +2.5 Volts monitor |  |
| +5 Volts monitor |  |
| _ROLL_ROT | 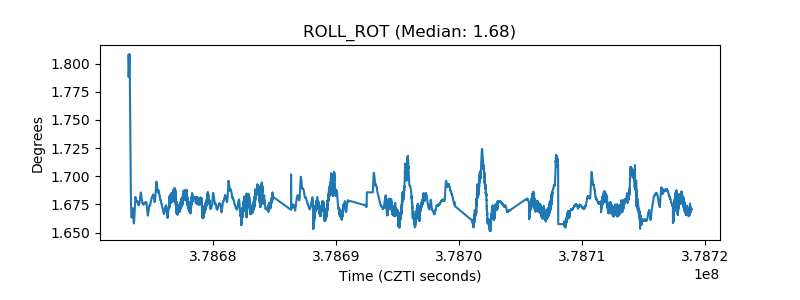 |
| _Roll_DEC |  |
| _Roll_RA | 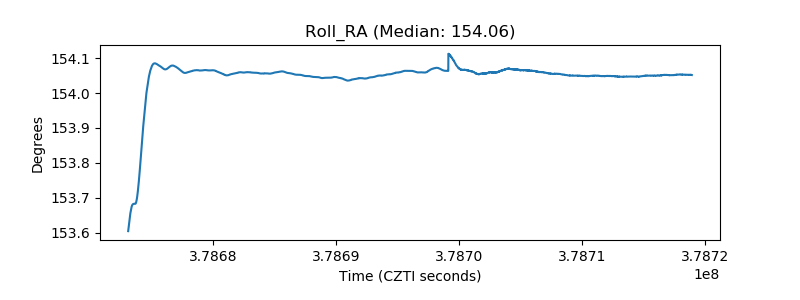 |
| Veto Counter |  |