| Param | Original file | Final file |
|---|---|---|
| Filename | modeM0/AS1A11_065T11_9000004830_33847cztM0_level2.evt | modeM0/AS1A11_065T11_9000004830_33847cztM0_level2_quad_clean.evt |
| Size (bytes) | 353,191,680 | 58,553,280 |
| Size | 336.8 MB | 55.8 MB |
| Events in quadrant A | 1,913,046 | 379,644 |
| Events in quadrant B | 2,532,434 | 373,194 |
| Events in quadrant C | 2,083,034 | 380,814 |
| Events in quadrant D | 3,898,081 | 359,335 |
| Mode SS | |||
|---|---|---|---|
| Quadrant | BADHDUFLAG | Total packets | Discarded packets |
| A | 0 | 82 | 0 |
| B | 0 | 82 | 0 |
| C | 0 | 82 | 0 |
| D | 0 | 82 | 0 |
| Mode M0 | |||
|---|---|---|---|
| Quadrant | BADHDUFLAG | Total packets | Discarded packets |
| A | 0 | 8152 | 2 |
| B | 0 | 10198 | 1 |
| C | 0 | 8525 | 1 |
| D | 0 | 14388 | 1 |
| Mode M9 | |||
|---|---|---|---|
| Quadrant | BADHDUFLAG | Total packets | Discarded packets |
| A | 0 | 15 | 0 |
| B | 0 | 15 | 0 |
| C | 0 | 15 | 0 |
| D | 0 | 15 | 0 |
| Quadrant | Total seconds | Saturated seconds | Saturation percentage |
|---|---|---|---|
| A | 3961 | 9 | 0.227215% |
| B | 3961 | 181 | 4.569553% |
| C | 3961 | 21 | 0.530169% |
| D | 3961 | 186 | 4.695784% |
Noise dominated data is calculated using 1-second bins in cleaned event files. If a bin has >2000 counts, and if more than 50% of those come from <1% of pixels, then it is considered to be noise-dominated and hence unusable.
| Quadrant | # 1 sec bins | Bins with >0 counts | Bins with >2000 counts | High rate bins dominated by noise | Noise dominated (total time) | Noise dominated (detector-on time) | Marked lightcurve |
|---|---|---|---|---|---|---|---|
| A | 5454 | 3962 | 6 | 6 | 0.11% | 0.15% | 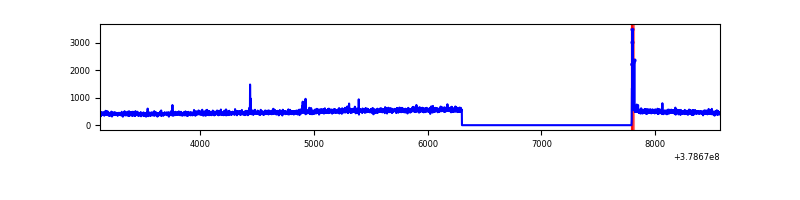 |
| B | 5454 | 3962 | 122 | 122 | 2.24% | 3.08% | 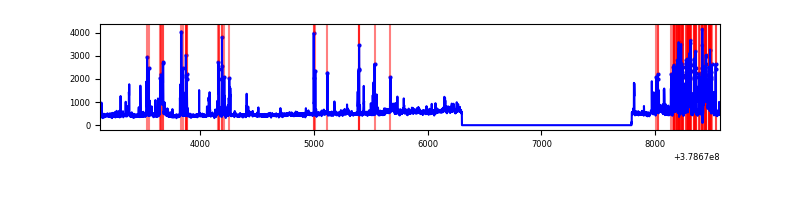 |
| C | 5454 | 3962 | 16 | 16 | 0.29% | 0.40% | 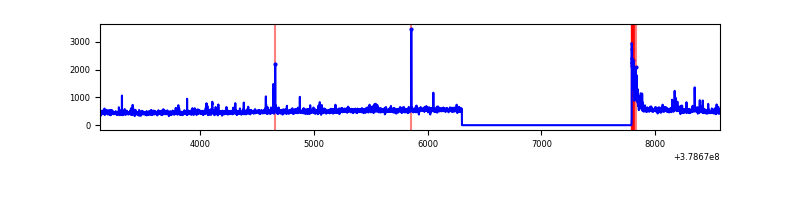 |
| D | 5454 | 3962 | 128 | 128 | 2.35% | 3.23% | 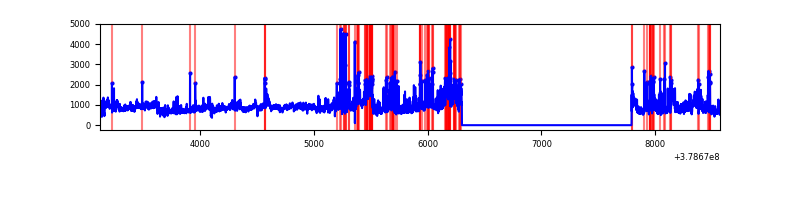 |
Top three noisy pixels from each quadrant. If the there are fewer than three noisy pixels in the level2.evt file, extra rows are filled as -1
| Pixel properties | Quadrant properties | ||||||
|---|---|---|---|---|---|---|---|
| Quadrant | DetID | PixID | Counts | Sigma | Mean | Median | Sigma |
| A | 15 | 169 | 83658 | 883.38 | 462 | 451 | 94.2 |
| A | 7 | 16 | 24326 | 253.47 | 462 | 451 | 94.2 |
| A | 13 | 6 | 12107 | 123.75 | 462 | 451 | 94.2 |
| B | 5 | 172 | 637780 | 7245.93 | 451 | 440 | 88.0 |
| B | 0 | 189 | 16600 | 183.72 | 451 | 440 | 88.0 |
| B | 4 | 232 | 15862 | 175.33 | 451 | 440 | 88.0 |
| C | 15 | 214 | 171882 | 1641.24 | 447 | 451 | 104.5 |
| C | 0 | 10 | 69228 | 658.46 | 447 | 451 | 104.5 |
| C | 3 | 233 | 32505 | 306.88 | 447 | 451 | 104.5 |
| D | 8 | 195 | 1077904 | 9237.57 | 438 | 429 | 116.6 |
| D | 12 | 235 | 401686 | 3440.12 | 438 | 429 | 116.6 |
| D | 2 | 250 | 215033 | 1839.87 | 438 | 429 | 116.6 |
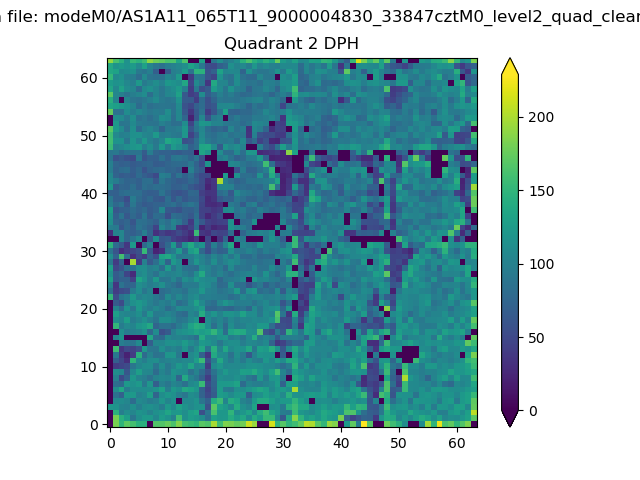
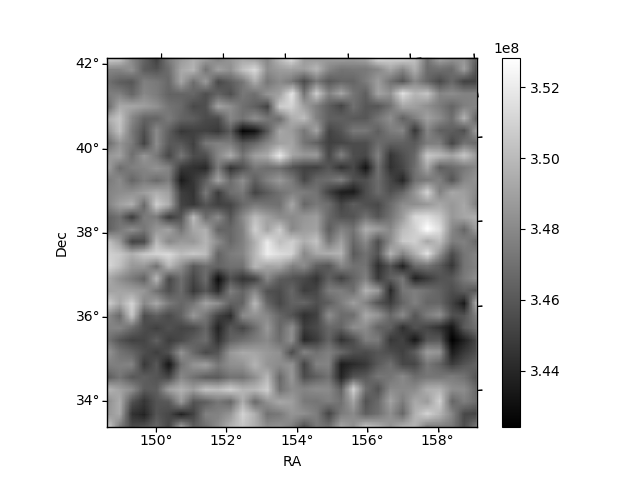
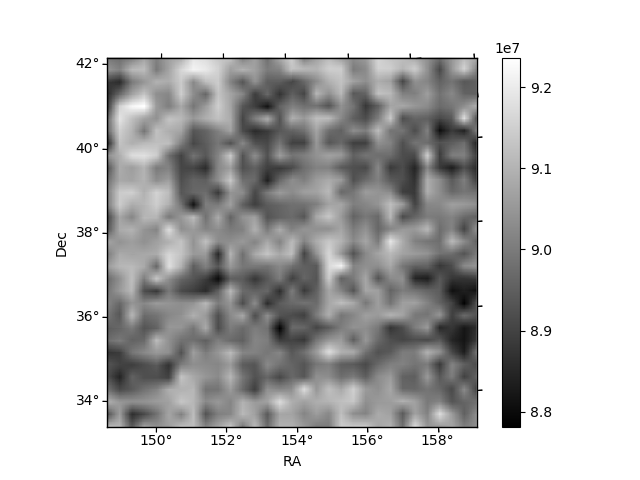
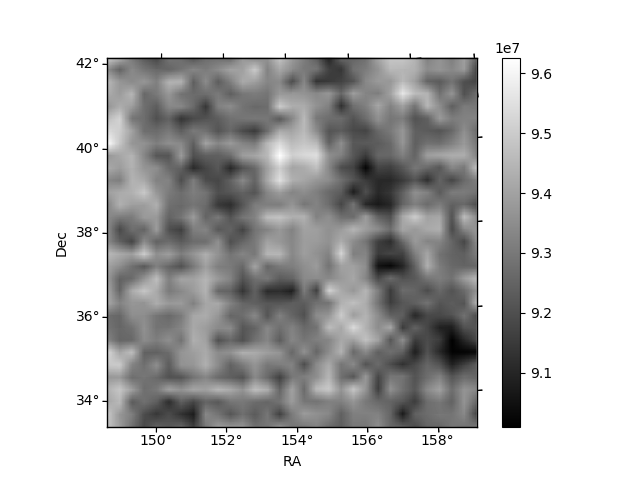
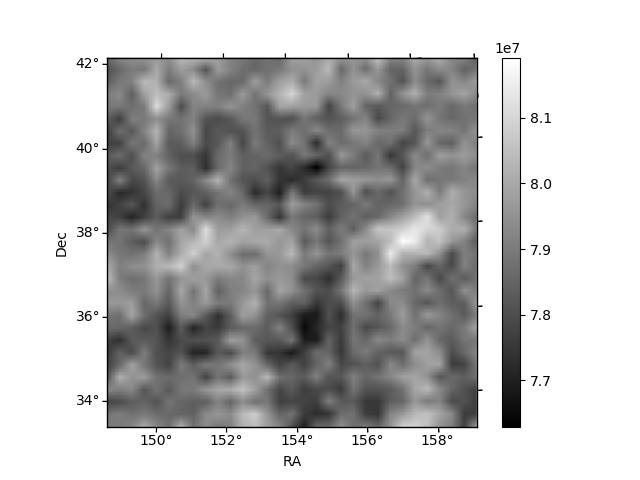
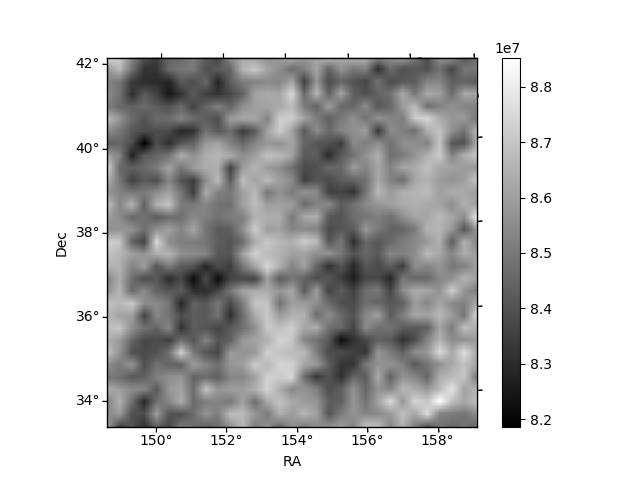
Histogram calculated using DETX and DETY for each event in the final _common_clean file
| Quadrant A | 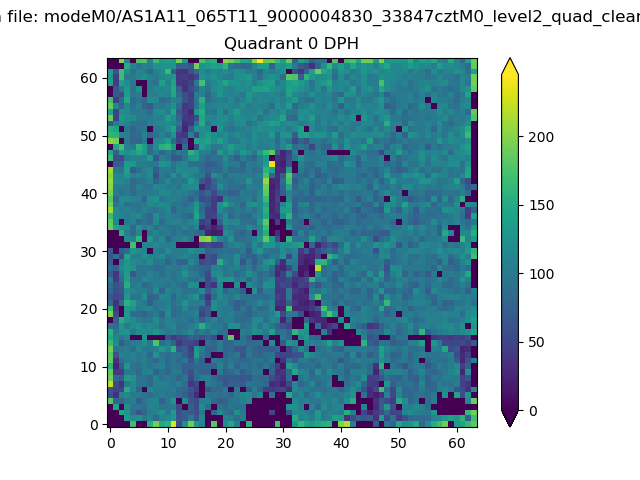 |
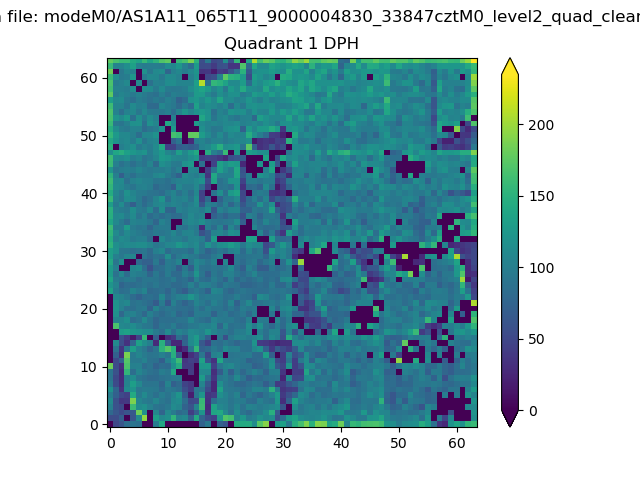 |
Quadrant B |
|---|---|---|---|
| Quadrant D | 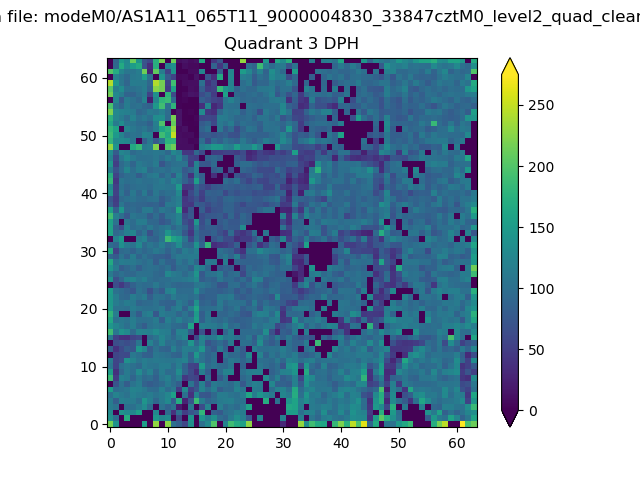 |
 |
Quadrant C |
| Plot type | Count rate plots | Images |
|---|---|---|
| Comparison with Poisson distribution Blue bars denote a histogram of data divided into 1 sec bins. Red curve is a Poisson curve with rate = median count rate of data. |
 |
 |
| Quadrant-wise count rates Data is divided into 100 sec bins |
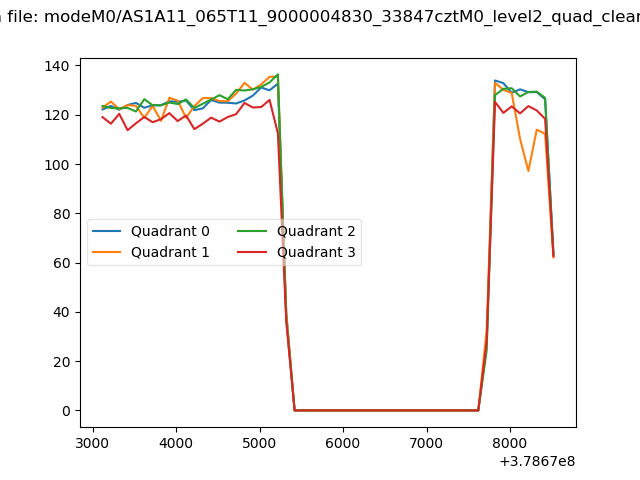 |
|
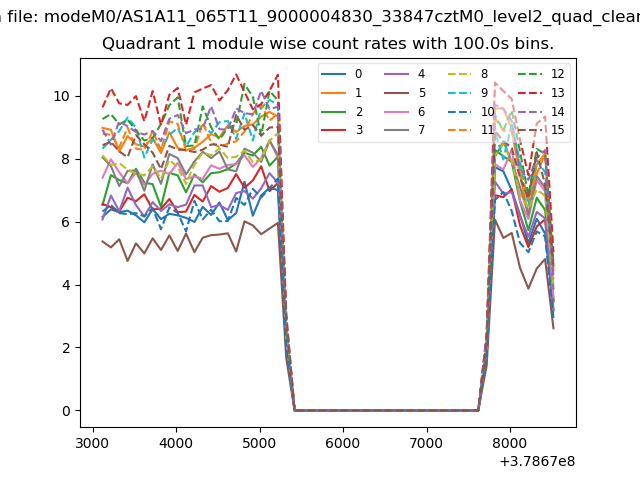
| Module-wise count rates for Quadrant A Data is divided into 100 sec bins |
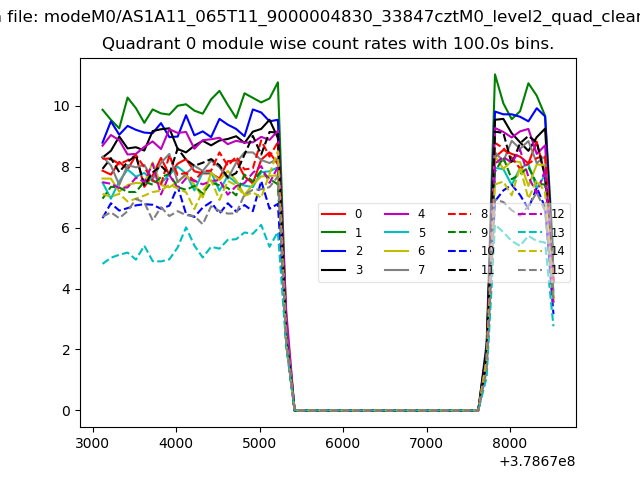 |
 |
| Module-wise count rates for Quadrant B Data is divided into 100 sec bins |
 |
 |
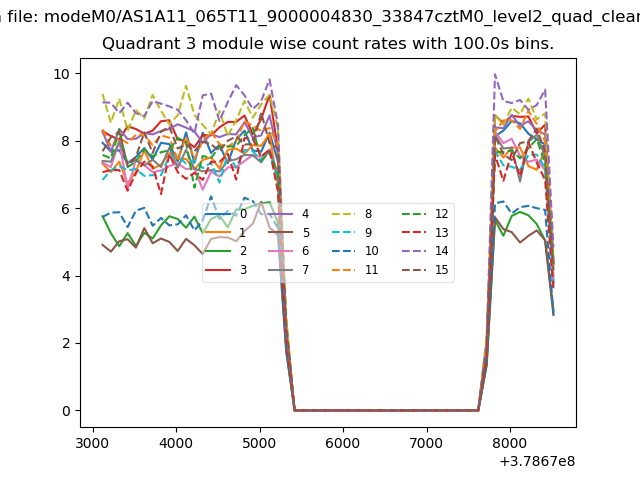
| Module-wise count rates for Quadrant C Data is divided into 100 sec bins |
 |
 |
| Module-wise count rates for Quadrant D Data is divided into 100 sec bins |
 |
 |
| Parameter | Plot |
|---|---|
| CZT HV Monitor | 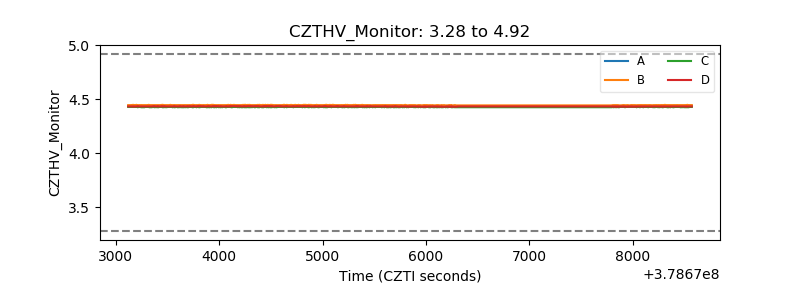 |
| D_VDD | 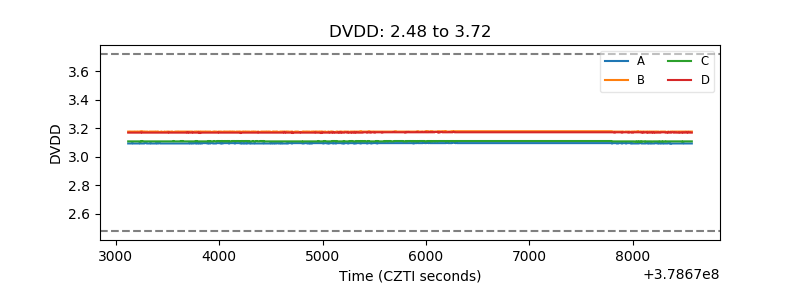 |
| Temperature 1 | 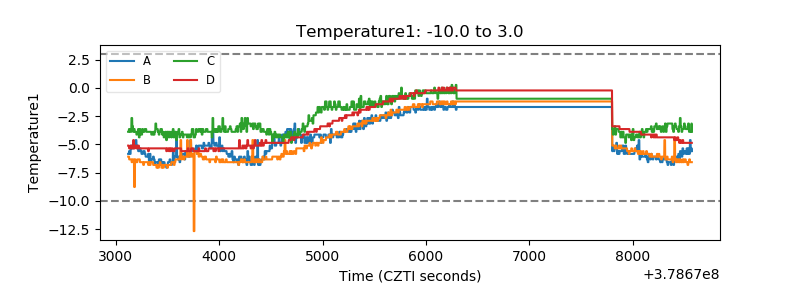 |
| Veto HV Monitor |  |
| Veto LLD | 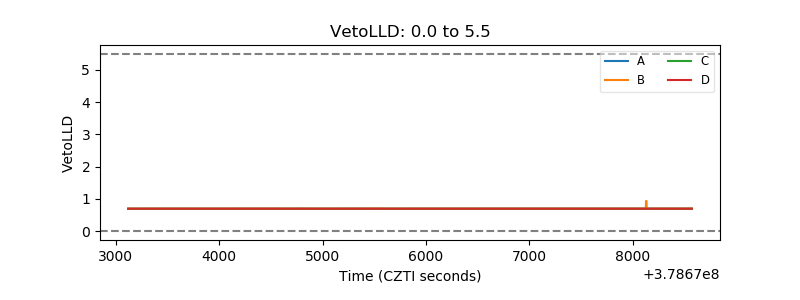 |
| Alpha Counter |  |
| _CPM_Rate | 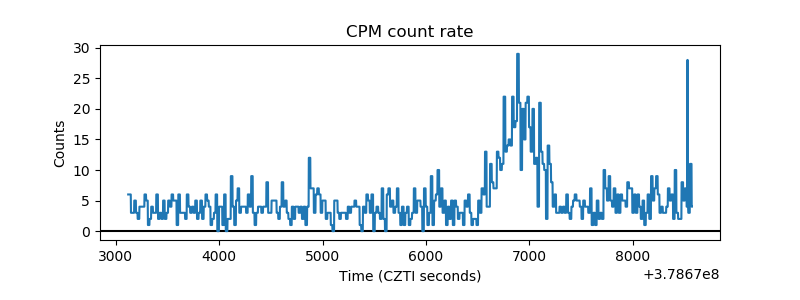 |
| CZT Counter | 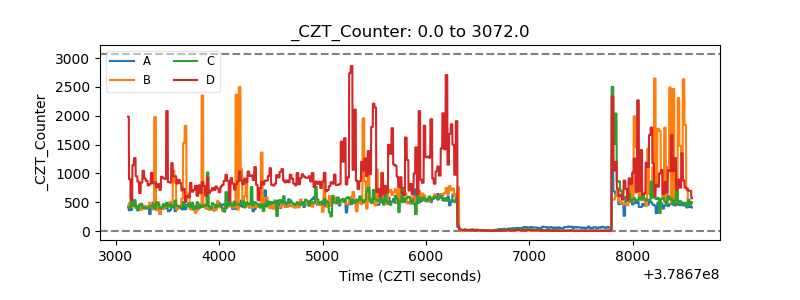 |
| +2.5 Volts monitor | 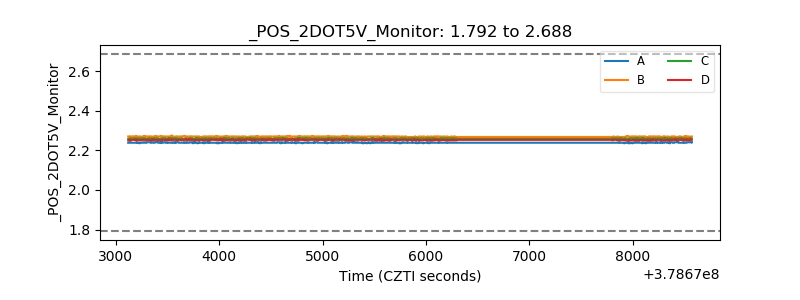 |
| +5 Volts monitor |  |
| _ROLL_ROT | 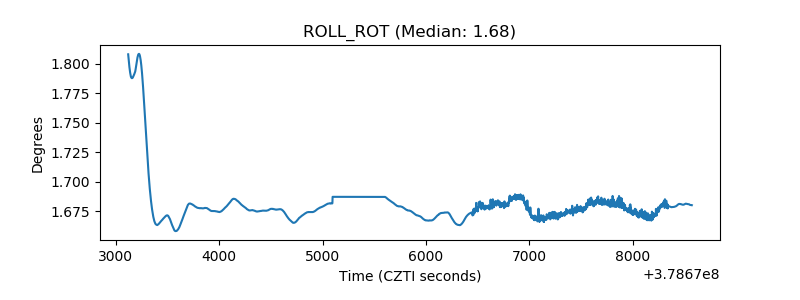 |
| _Roll_DEC | 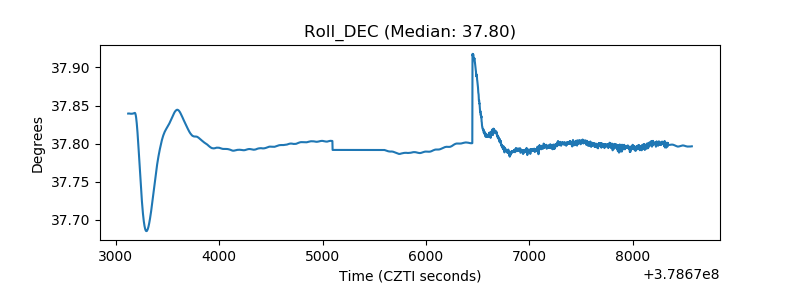 |
| _Roll_RA | 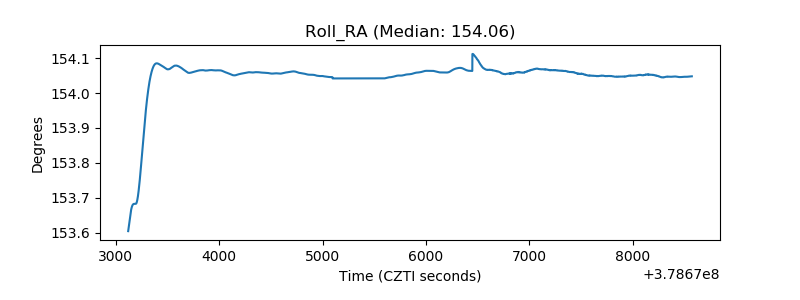 |
| Veto Counter | 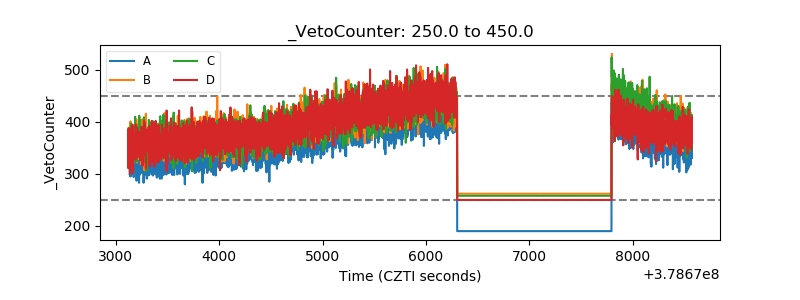 |