| Param | Original file | Final file |
|---|---|---|
| Filename | modeM0/AS1A11_065T11_9000004830_33848cztM0_level2.evt | modeM0/AS1A11_065T11_9000004830_33848cztM0_level2_quad_clean.evt |
| Size (bytes) | 639,002,880 | 83,070,720 |
| Size | 609.4 MB | 79.2 MB |
| Events in quadrant A | 3,169,899 | 534,171 |
| Events in quadrant B | 5,831,662 | 482,491 |
| Events in quadrant C | 3,488,488 | 534,532 |
| Events in quadrant D | 6,417,857 | 505,934 |
| Mode SS | |||
|---|---|---|---|
| Quadrant | BADHDUFLAG | Total packets | Discarded packets |
| A | 0 | 136 | 0 |
| B | 0 | 136 | 0 |
| C | 0 | 136 | 0 |
| D | 0 | 136 | 0 |
| Mode M0 | |||
|---|---|---|---|
| Quadrant | BADHDUFLAG | Total packets | Discarded packets |
| A | 0 | 13565 | 3 |
| B | 0 | 21763 | 2 |
| C | 0 | 14179 | 2 |
| D | 0 | 23653 | 2 |
| Mode M9 | |||
|---|---|---|---|
| Quadrant | BADHDUFLAG | Total packets | Discarded packets |
| A | 0 | 28 | 0 |
| B | 0 | 28 | 0 |
| C | 0 | 28 | 0 |
| D | 0 | 28 | 0 |
| Quadrant | Total seconds | Saturated seconds | Saturation percentage |
|---|---|---|---|
| A | 6567 | 15 | 0.228415% |
| B | 6567 | 928 | 14.131262% |
| C | 6567 | 29 | 0.441602% |
| D | 6567 | 483 | 7.354957% |
Noise dominated data is calculated using 1-second bins in cleaned event files. If a bin has >2000 counts, and if more than 50% of those come from <1% of pixels, then it is considered to be noise-dominated and hence unusable.
| Quadrant | # 1 sec bins | Bins with >0 counts | Bins with >2000 counts | High rate bins dominated by noise | Noise dominated (total time) | Noise dominated (detector-on time) | Marked lightcurve |
|---|---|---|---|---|---|---|---|
| A | 9372 | 6569 | 6 | 6 | 0.06% | 0.09% | 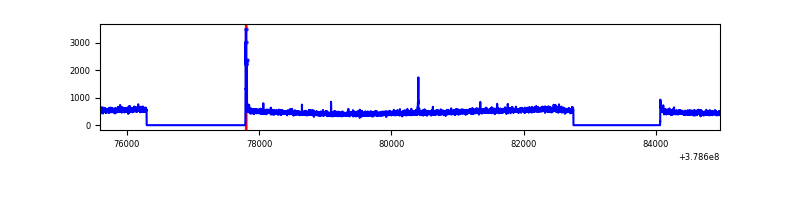 |
| B | 9372 | 6569 | 748 | 748 | 7.98% | 11.39% | 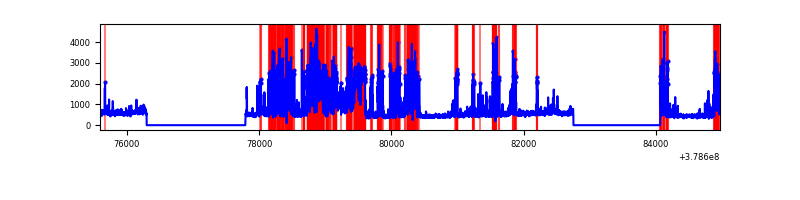 |
| C | 9372 | 6569 | 18 | 18 | 0.19% | 0.27% |  |
| D | 9372 | 6569 | 320 | 320 | 3.41% | 4.87% | 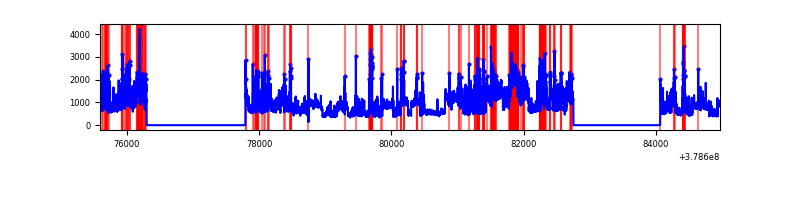 |
Top three noisy pixels from each quadrant. If the there are fewer than three noisy pixels in the level2.evt file, extra rows are filled as -1
| Pixel properties | Quadrant properties | ||||||
|---|---|---|---|---|---|---|---|
| Quadrant | DetID | PixID | Counts | Sigma | Mean | Median | Sigma |
| A | 15 | 169 | 129521 | 830.4 | 771 | 755 | 155.1 |
| A | 13 | 6 | 22000 | 137.01 | 771 | 755 | 155.1 |
| A | 7 | 16 | 21697 | 135.05 | 771 | 755 | 155.1 |
| B | 5 | 172 | 1741685 | 12572.65 | 725 | 705 | 138.5 |
| B | 15 | 222 | 1044783 | 7539.9 | 725 | 705 | 138.5 |
| B | 0 | 190 | 38749 | 274.74 | 725 | 705 | 138.5 |
| C | 15 | 214 | 287887 | 1667.67 | 750 | 756 | 172.2 |
| C | 0 | 10 | 101352 | 584.27 | 750 | 756 | 172.2 |
| C | 3 | 233 | 82069 | 472.27 | 750 | 756 | 172.2 |
| D | 8 | 195 | 1592567 | 8278.82 | 729 | 711 | 192.3 |
| D | 12 | 235 | 670251 | 3482.1 | 729 | 711 | 192.3 |
| D | 2 | 249 | 490181 | 2545.6 | 729 | 711 | 192.3 |
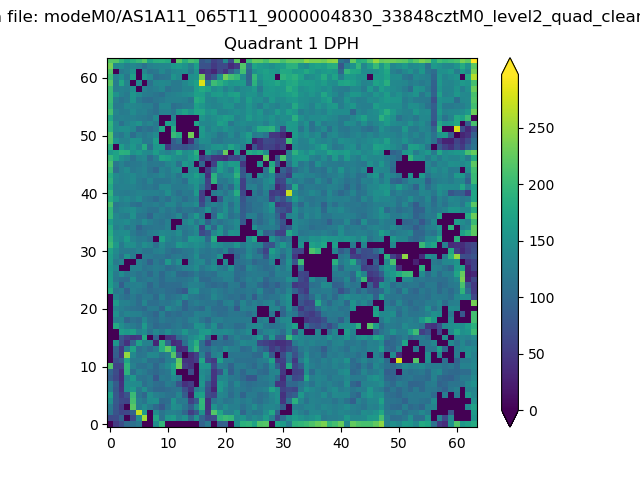
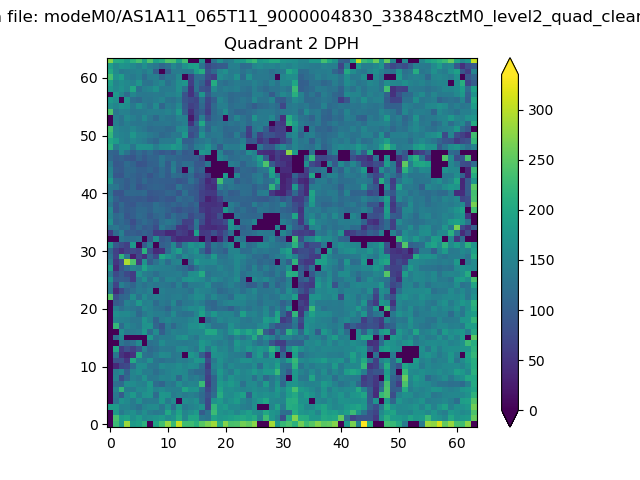
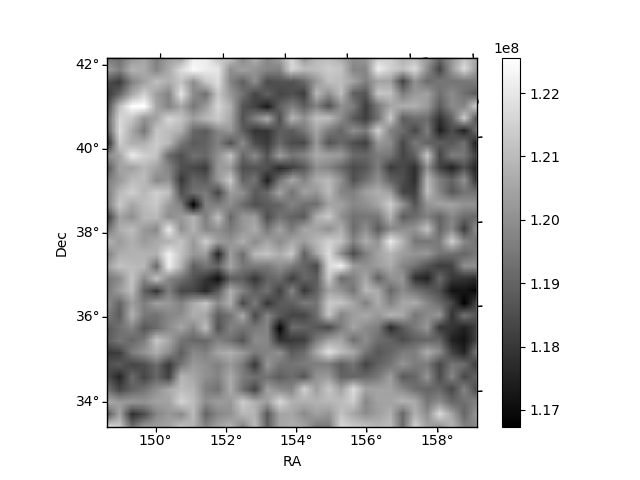
Histogram calculated using DETX and DETY for each event in the final _common_clean file
| Quadrant A |  |
 |
Quadrant B |
|---|---|---|---|
| Quadrant D | 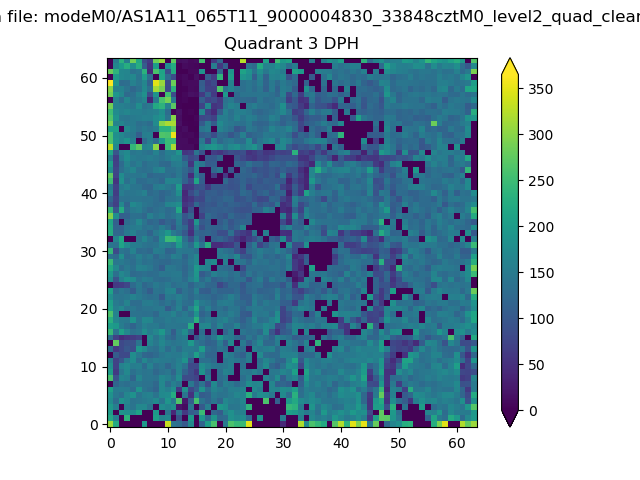 |
 |
Quadrant C |
| Plot type | Count rate plots | Images |
|---|---|---|
| Comparison with Poisson distribution Blue bars denote a histogram of data divided into 1 sec bins. Red curve is a Poisson curve with rate = median count rate of data. |
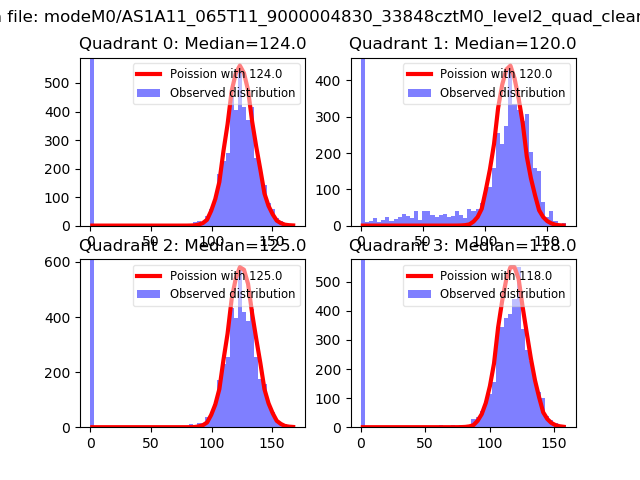 |
 |
| Quadrant-wise count rates Data is divided into 100 sec bins |
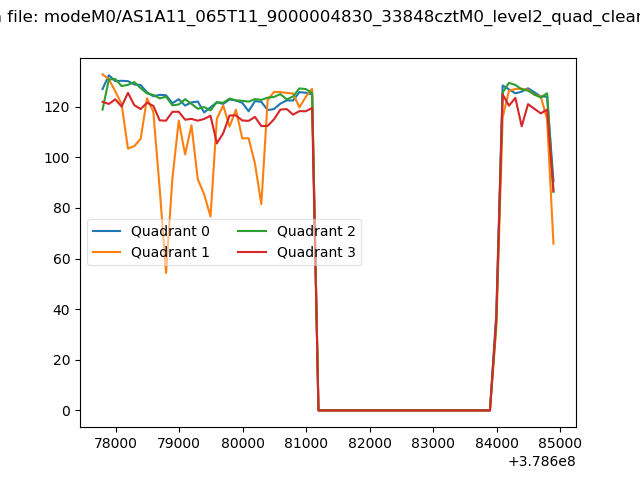 |
|
| Module-wise count rates for Quadrant A Data is divided into 100 sec bins |
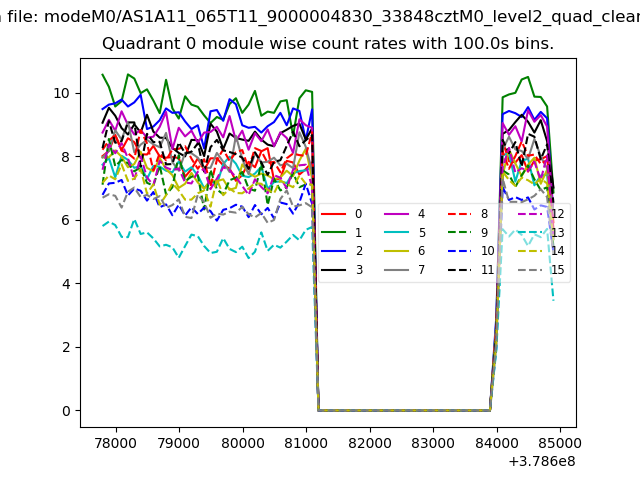 |
 |
| Module-wise count rates for Quadrant B Data is divided into 100 sec bins |
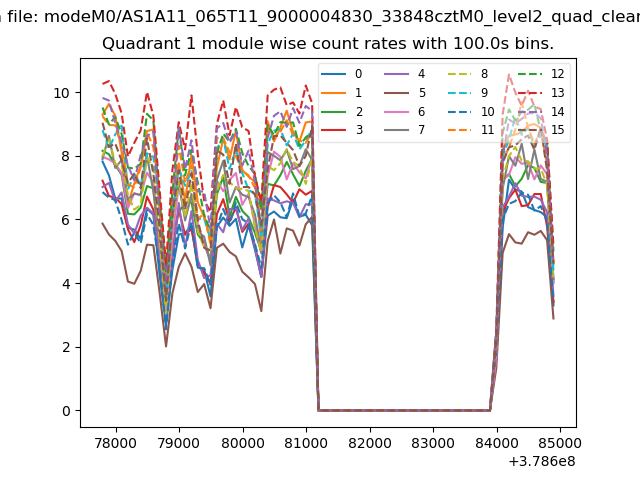 |
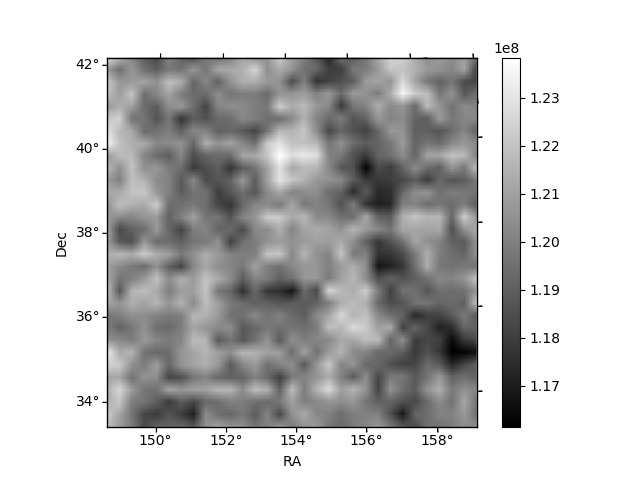 |
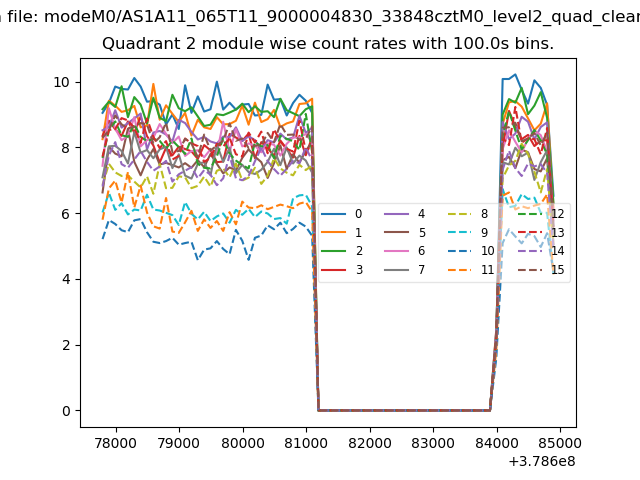
| Module-wise count rates for Quadrant C Data is divided into 100 sec bins |
 |
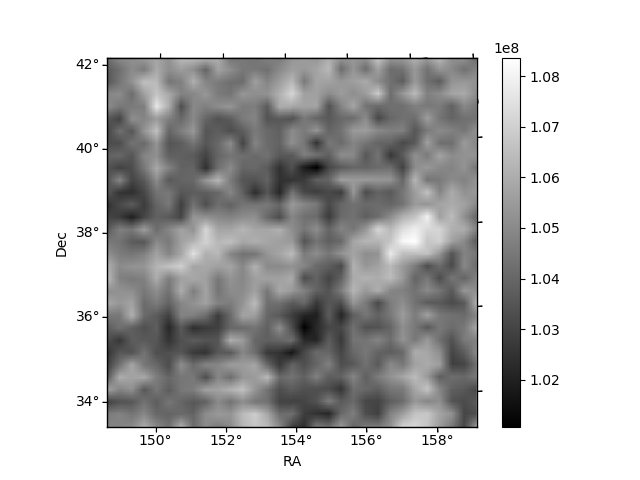 |
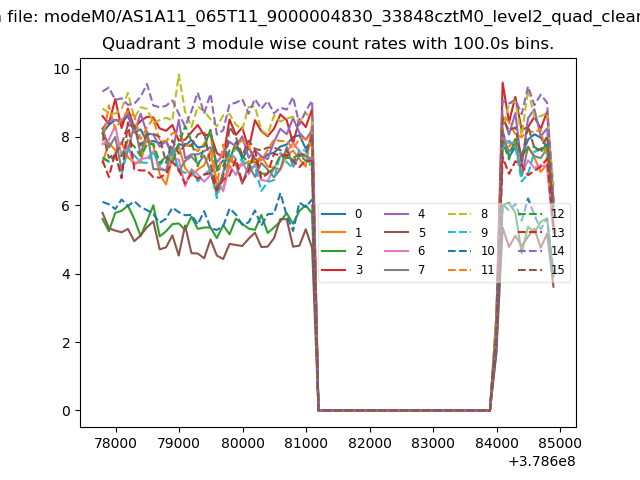
| Module-wise count rates for Quadrant D Data is divided into 100 sec bins |
 |
 |
| Parameter | Plot |
|---|---|
| CZT HV Monitor |  |
| D_VDD | 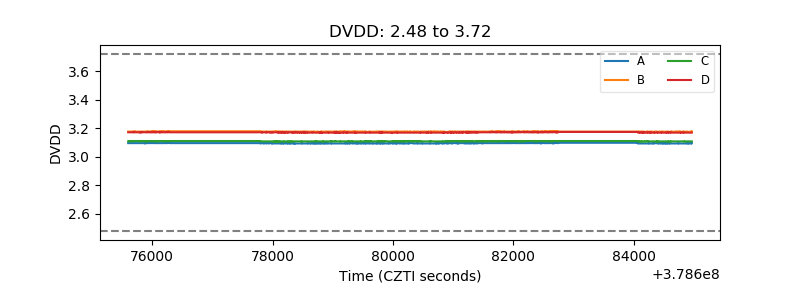 |
| Temperature 1 | 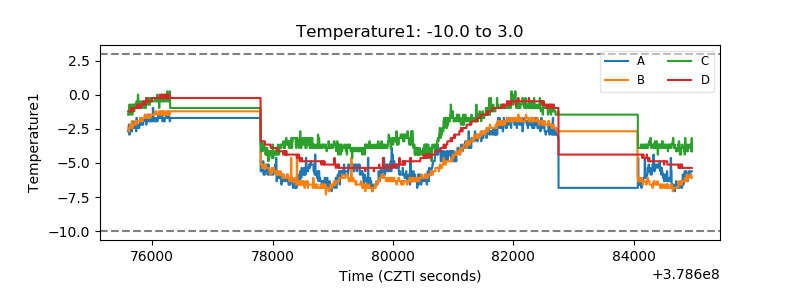 |
| Veto HV Monitor | 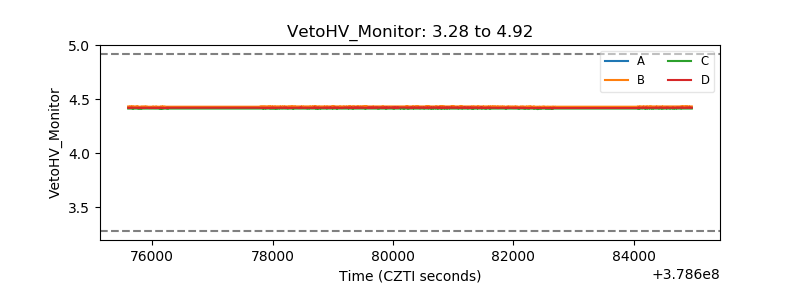 |
| Veto LLD | 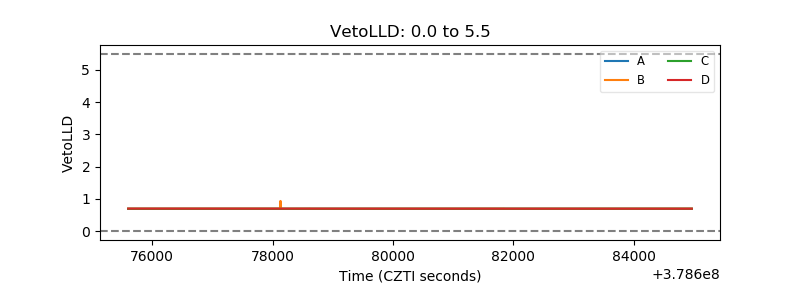 |
| Alpha Counter | 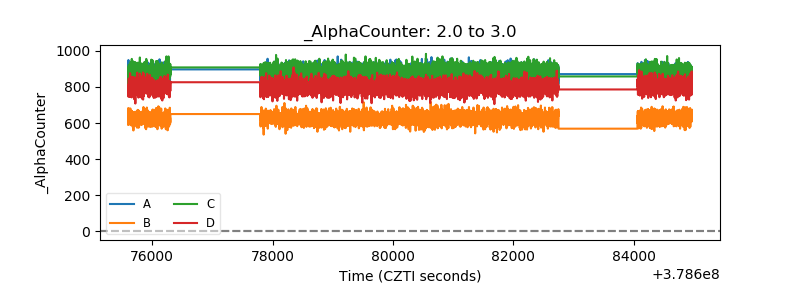 |
| _CPM_Rate | 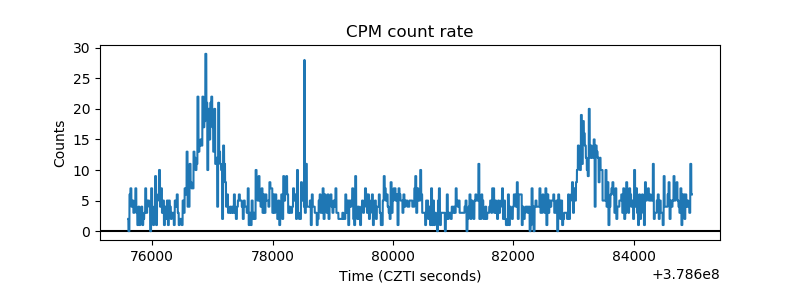 |
| CZT Counter | 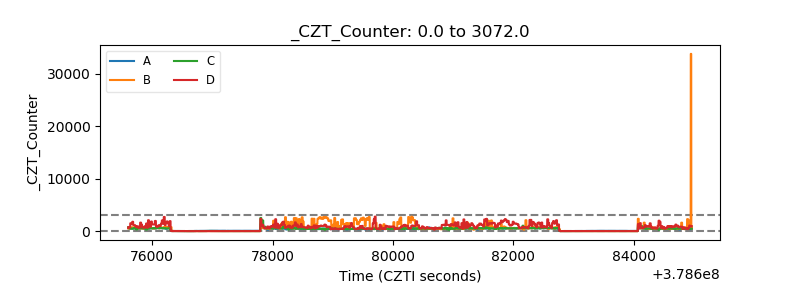 |
| +2.5 Volts monitor |  |
| +5 Volts monitor |  |
| _ROLL_ROT | 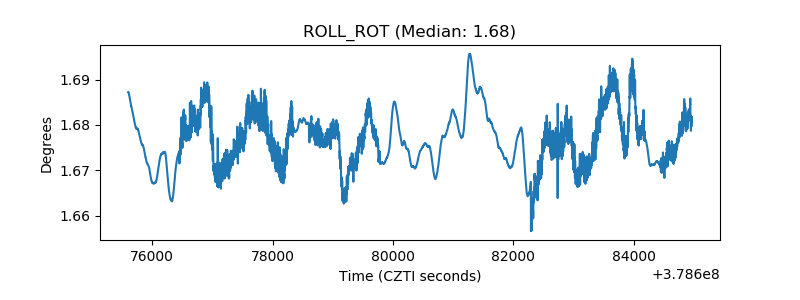 |
| _Roll_DEC | 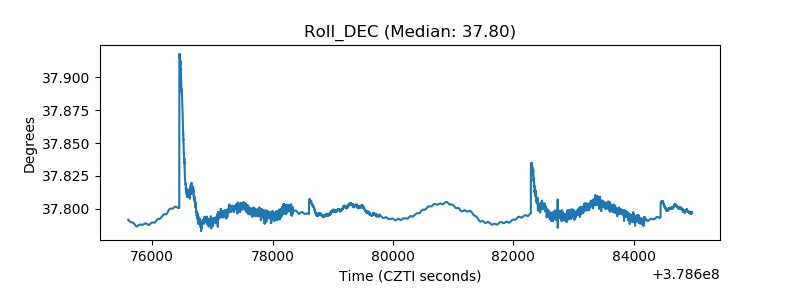 |
| _Roll_RA | 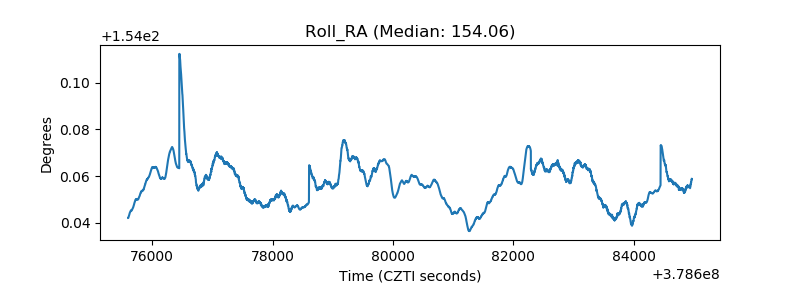 |
| Veto Counter | 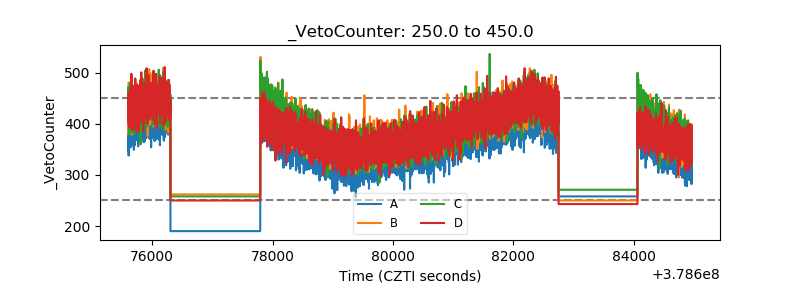 |