| Param | Original file | Final file |
|---|---|---|
| Filename | modeM0/AS1A11_065T11_9000004830_33849cztM0_level2.evt | modeM0/AS1A11_065T11_9000004830_33849cztM0_level2_quad_clean.evt |
| Size (bytes) | 578,134,080 | 75,075,840 |
| Size | 551.4 MB | 71.6 MB |
| Events in quadrant A | 3,369,351 | 464,131 |
| Events in quadrant B | 4,611,396 | 445,364 |
| Events in quadrant C | 3,483,416 | 464,057 |
| Events in quadrant D | 5,599,726 | 441,399 |
| Mode SS | |||
|---|---|---|---|
| Quadrant | BADHDUFLAG | Total packets | Discarded packets |
| A | 0 | 136 | 4 |
| B | 0 | 136 | 4 |
| C | 0 | 136 | 4 |
| D | 0 | 136 | 2 |
| Mode M0 | |||
|---|---|---|---|
| Quadrant | BADHDUFLAG | Total packets | Discarded packets |
| A | 0 | 14390 | 280 |
| B | 0 | 18593 | 403 |
| C | 0 | 14728 | 306 |
| D | 0 | 21754 | 463 |
| Mode M9 | |||
|---|---|---|---|
| Quadrant | BADHDUFLAG | Total packets | Discarded packets |
| A | 0 | 27 | 0 |
| B | 0 | 27 | 0 |
| C | 0 | 27 | 0 |
| D | 0 | 27 | 0 |
| Quadrant | Total seconds | Saturated seconds | Saturation percentage |
|---|---|---|---|
| A | 6594 | 26 | 0.394298% |
| B | 6576 | 544 | 8.272506% |
| C | 6580 | 25 | 0.379939% |
| D | 6563 | 283 | 4.312052% |
Noise dominated data is calculated using 1-second bins in cleaned event files. If a bin has >2000 counts, and if more than 50% of those come from <1% of pixels, then it is considered to be noise-dominated and hence unusable.
| Quadrant | # 1 sec bins | Bins with >0 counts | Bins with >2000 counts | High rate bins dominated by noise | Noise dominated (total time) | Noise dominated (detector-on time) | Marked lightcurve |
|---|---|---|---|---|---|---|---|
| A | 9358 | 6655 | 4 | 4 | 0.04% | 0.06% | 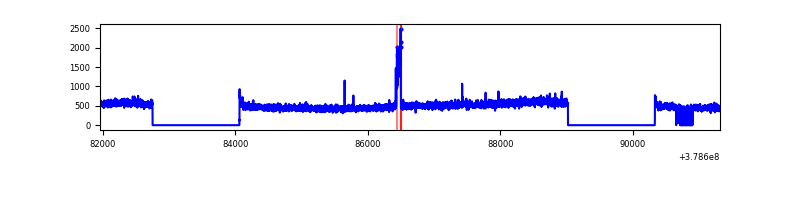 |
| B | 9358 | 6630 | 362 | 362 | 3.87% | 5.46% | 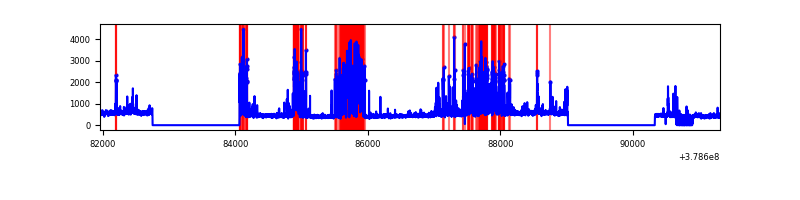 |
| C | 9358 | 6628 | 19 | 19 | 0.20% | 0.29% | 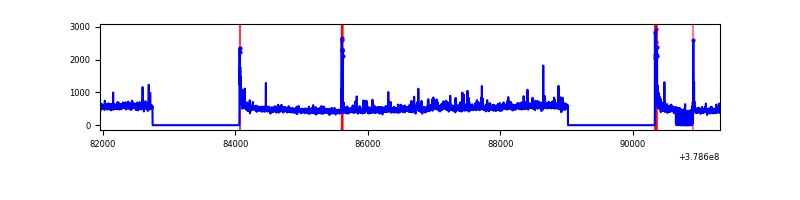 |
| D | 9358 | 6621 | 141 | 141 | 1.51% | 2.13% | 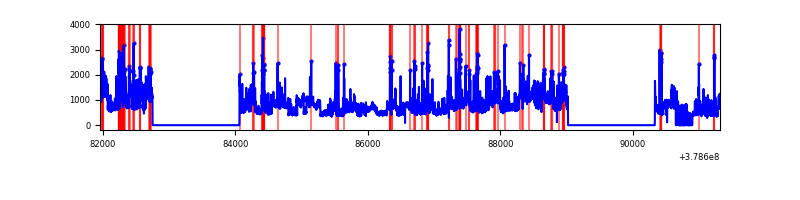 |
Top three noisy pixels from each quadrant. If the there are fewer than three noisy pixels in the level2.evt file, extra rows are filled as -1
| Pixel properties | Quadrant properties | ||||||
|---|---|---|---|---|---|---|---|
| Quadrant | DetID | PixID | Counts | Sigma | Mean | Median | Sigma |
| A | 15 | 169 | 343389 | 2185.73 | 775 | 758 | 156.8 |
| A | 13 | 6 | 17980 | 109.86 | 775 | 758 | 156.8 |
| A | 13 | 254 | 11310 | 67.31 | 775 | 758 | 156.8 |
| B | 5 | 172 | 1446908 | 10156.31 | 742 | 723 | 142.4 |
| B | 15 | 85 | 109864 | 766.48 | 742 | 723 | 142.4 |
| B | 5 | 255 | 35611 | 245.01 | 742 | 723 | 142.4 |
| C | 15 | 214 | 285574 | 1653.37 | 749 | 756 | 172.3 |
| C | 0 | 10 | 80795 | 464.63 | 749 | 756 | 172.3 |
| C | 4 | 254 | 74175 | 426.2 | 749 | 756 | 172.3 |
| D | 8 | 195 | 1450861 | 7998.43 | 742 | 721 | 181.3 |
| D | 2 | 249 | 392363 | 2160.15 | 742 | 721 | 181.3 |
| D | 12 | 235 | 372025 | 2047.97 | 742 | 721 | 181.3 |
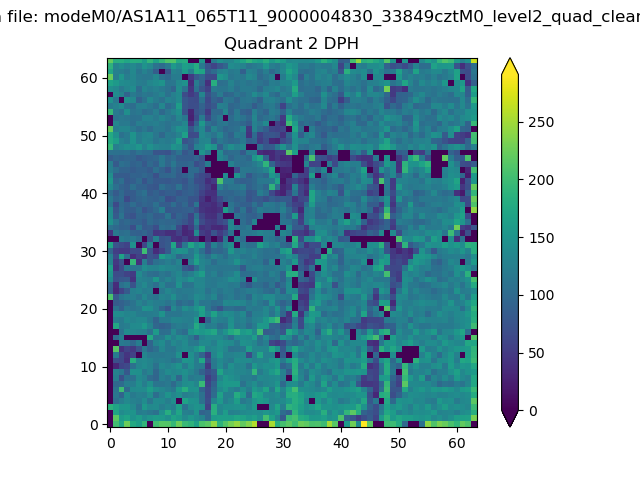
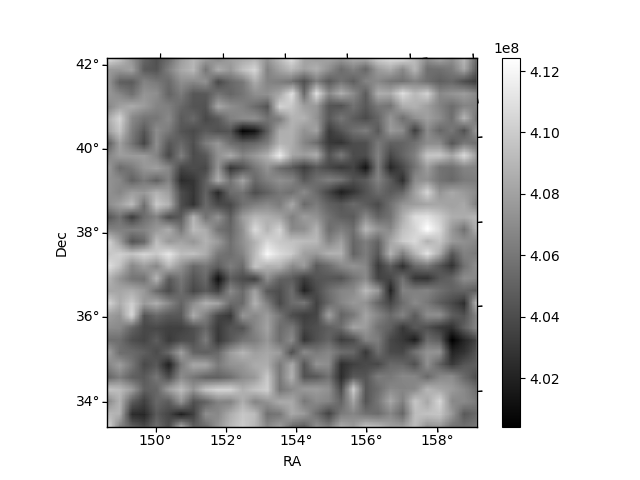
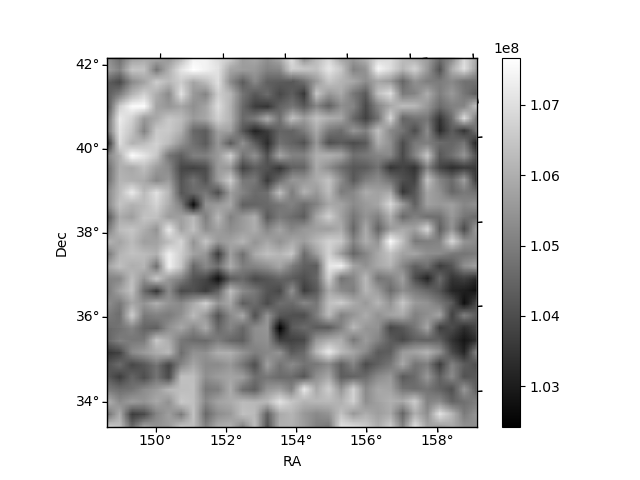
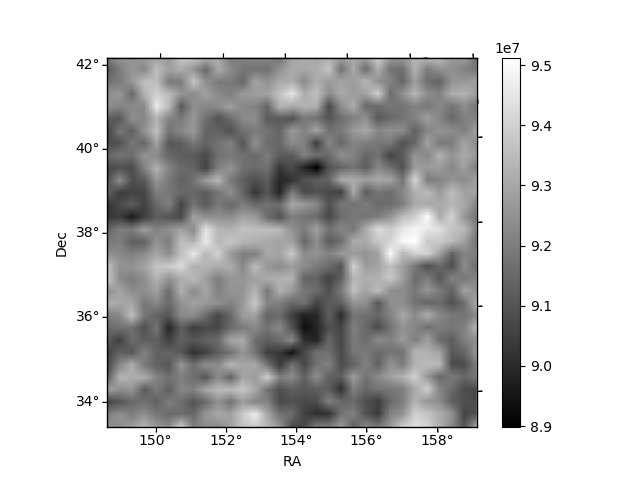
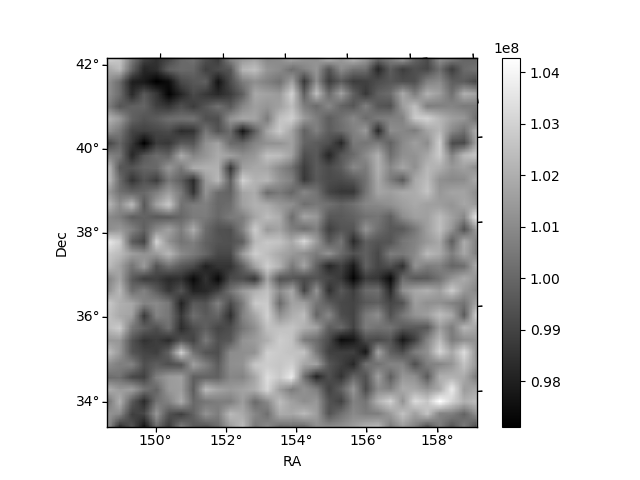
Histogram calculated using DETX and DETY for each event in the final _common_clean file
| Quadrant A | 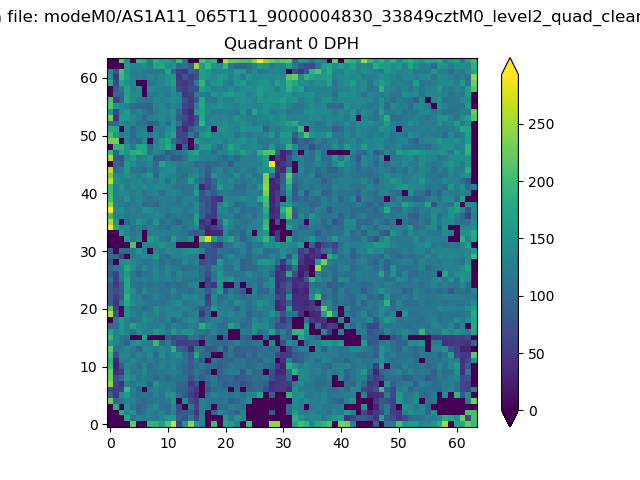 |
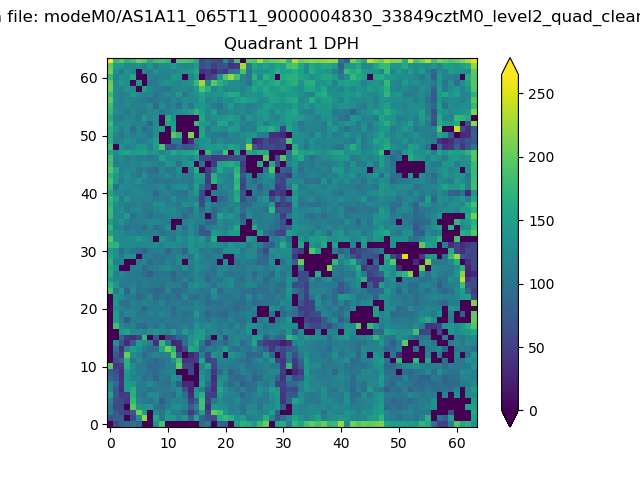 |
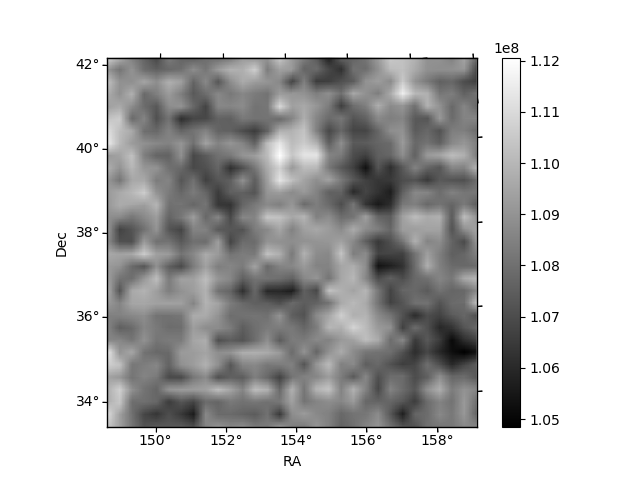
Quadrant B |
|---|---|---|---|
| Quadrant D | 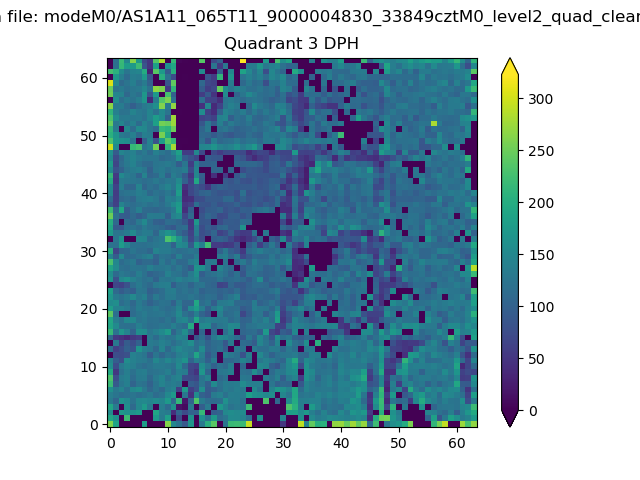 |
 |
Quadrant C |
| Plot type | Count rate plots | Images |
|---|---|---|
| Comparison with Poisson distribution Blue bars denote a histogram of data divided into 1 sec bins. Red curve is a Poisson curve with rate = median count rate of data. |
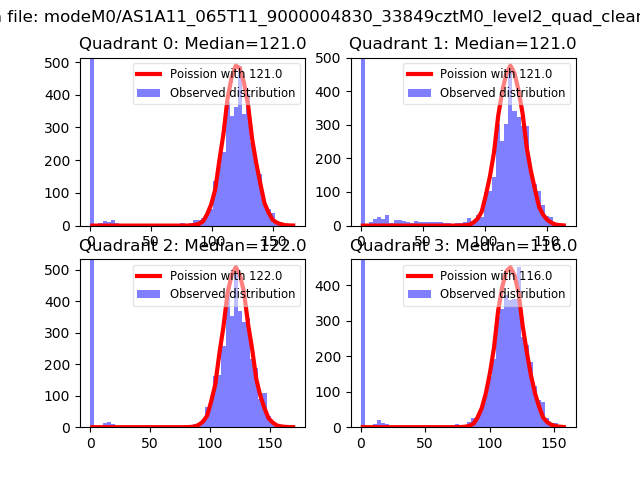 |
 |
| Quadrant-wise count rates Data is divided into 100 sec bins |
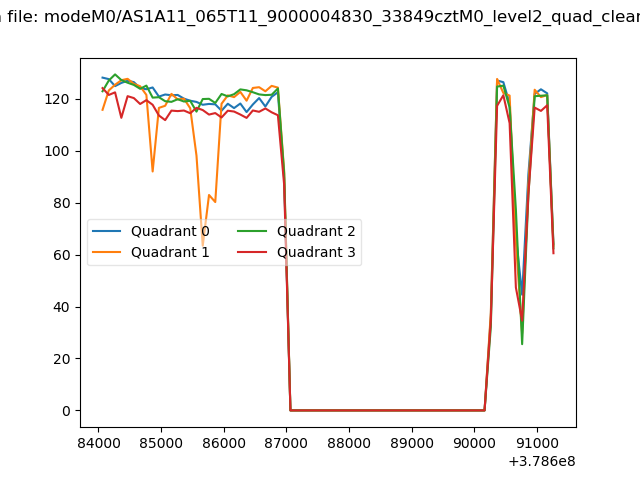 |
|
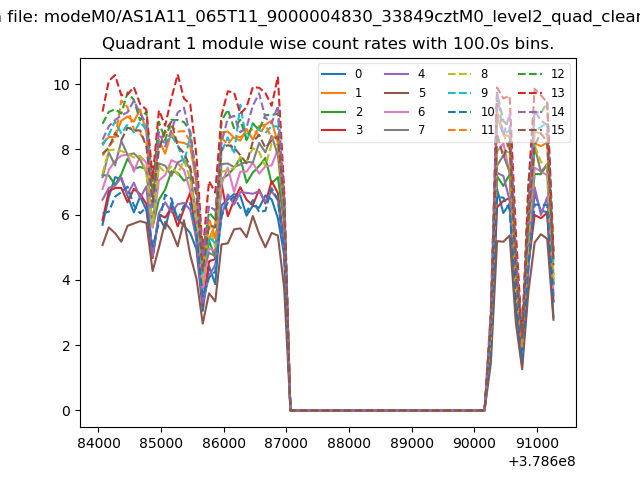
| Module-wise count rates for Quadrant A Data is divided into 100 sec bins |
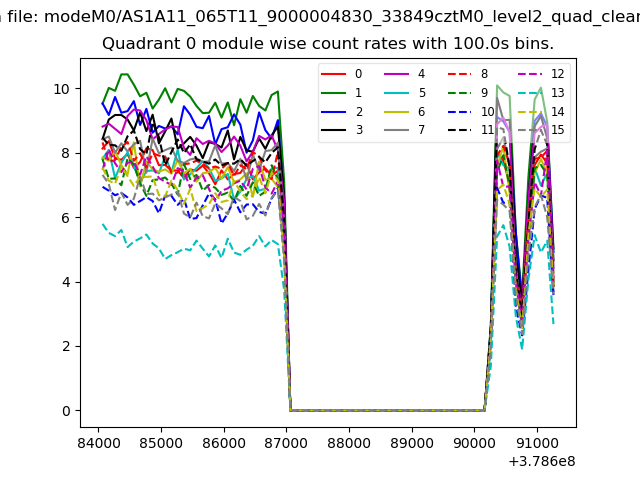 |
 |
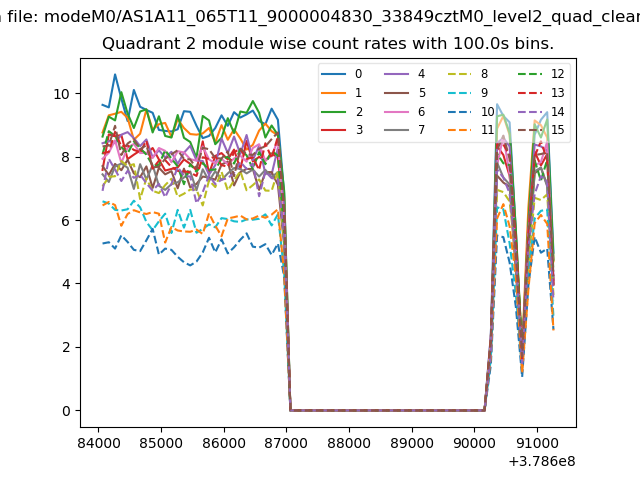
| Module-wise count rates for Quadrant B Data is divided into 100 sec bins |
 |
 |
| Module-wise count rates for Quadrant C Data is divided into 100 sec bins |
 |
 |
| Module-wise count rates for Quadrant D Data is divided into 100 sec bins |
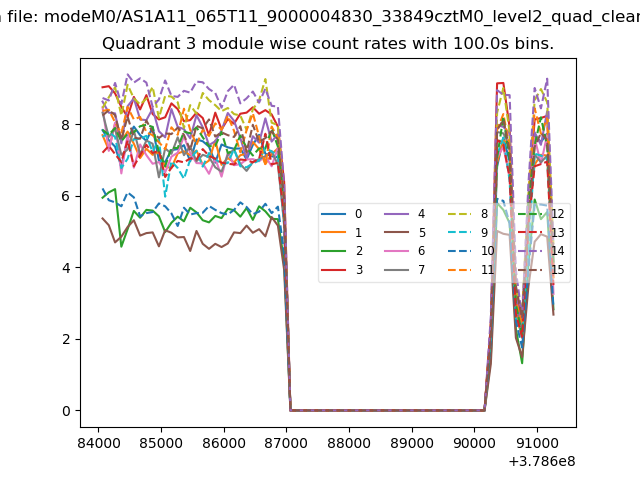 |
 |
| Parameter | Plot |
|---|---|
| CZT HV Monitor | 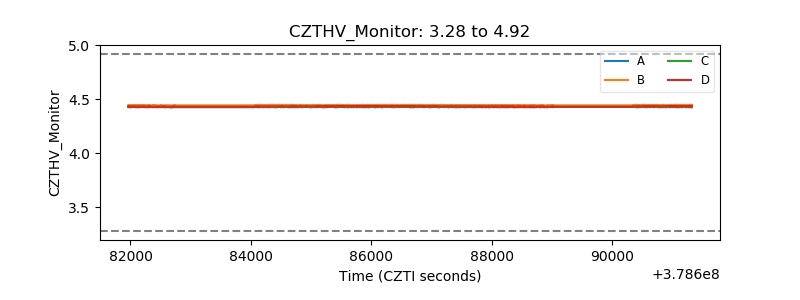 |
| D_VDD | 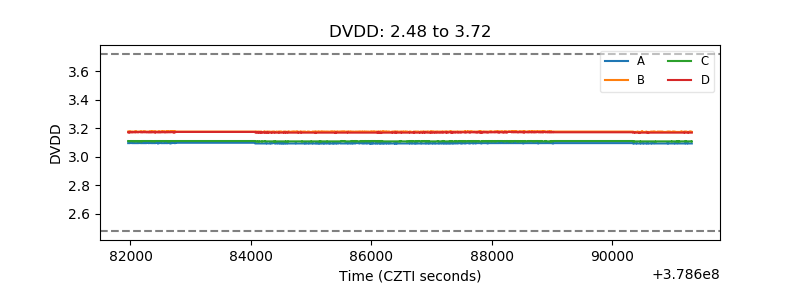 |
| Temperature 1 | 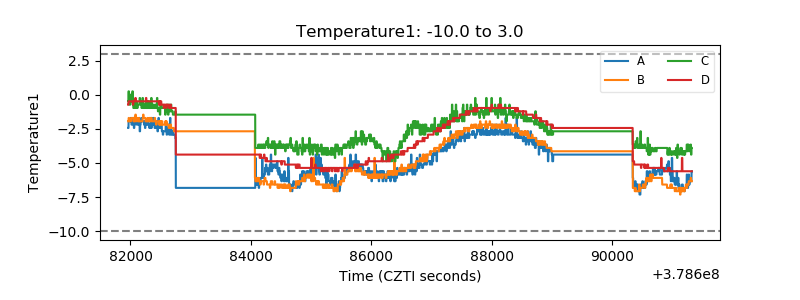 |
| Veto HV Monitor | 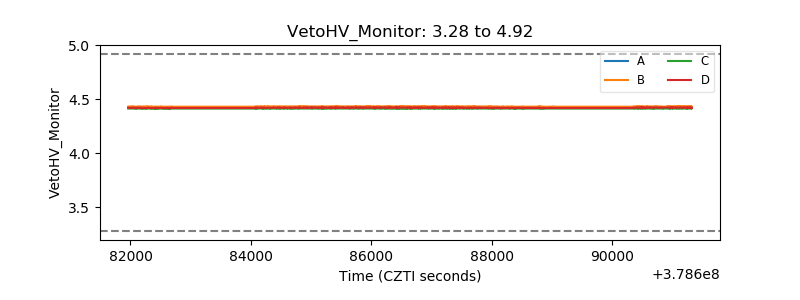 |
| Veto LLD | 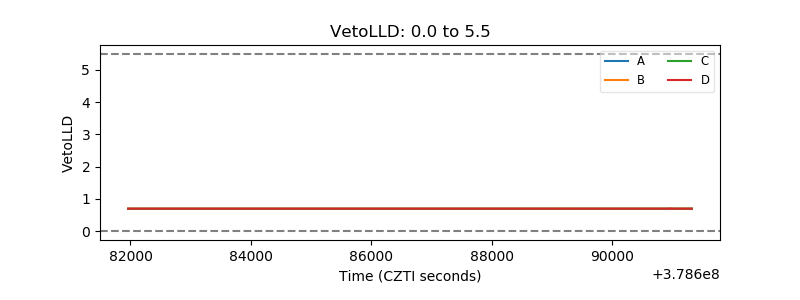 |
| Alpha Counter | 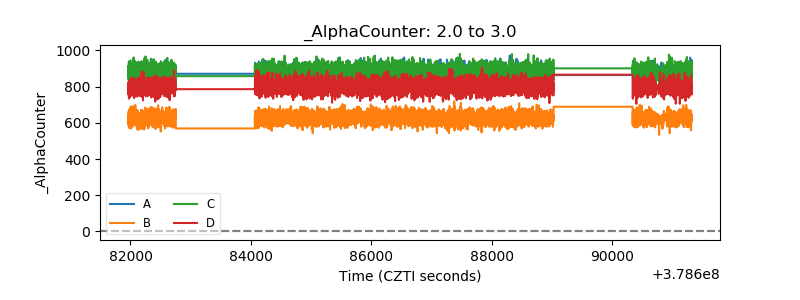 |
| _CPM_Rate | 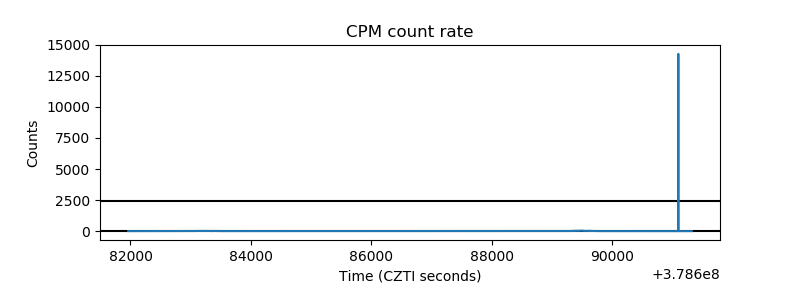 |
| CZT Counter | 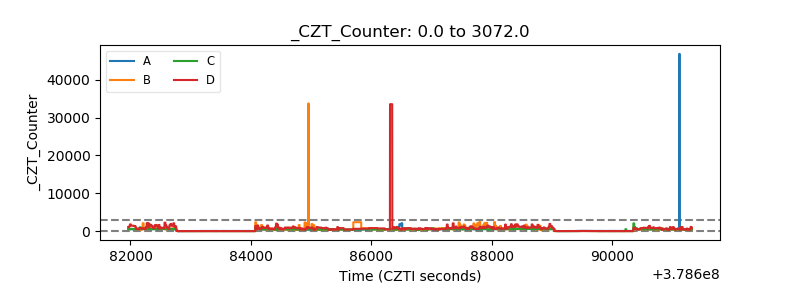 |
| +2.5 Volts monitor | 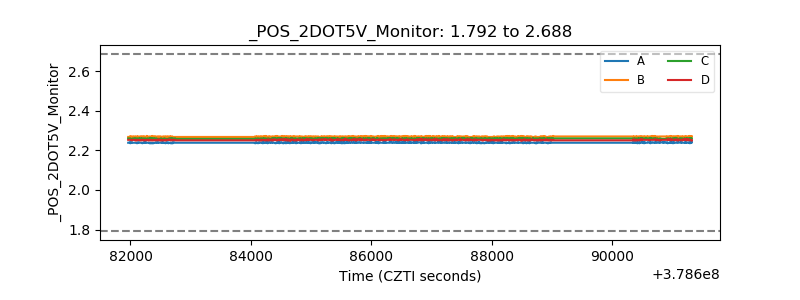 |
| +5 Volts monitor | 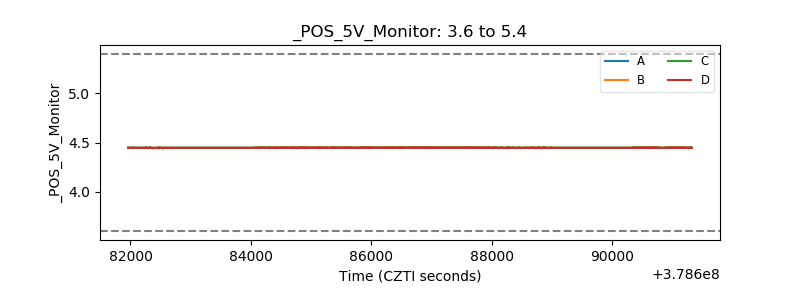 |
| _ROLL_ROT | 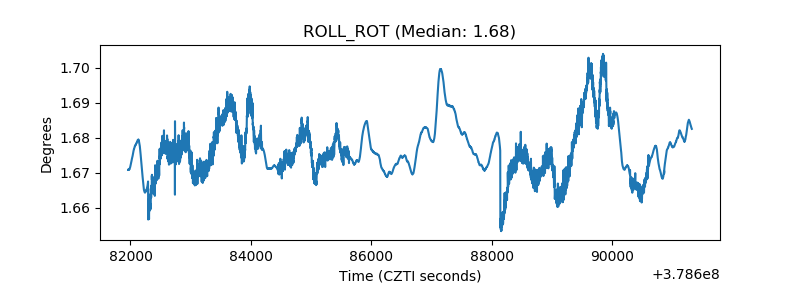 |
| _Roll_DEC | 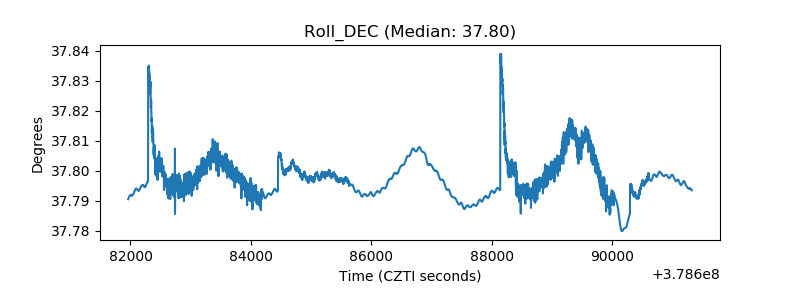 |
| _Roll_RA | 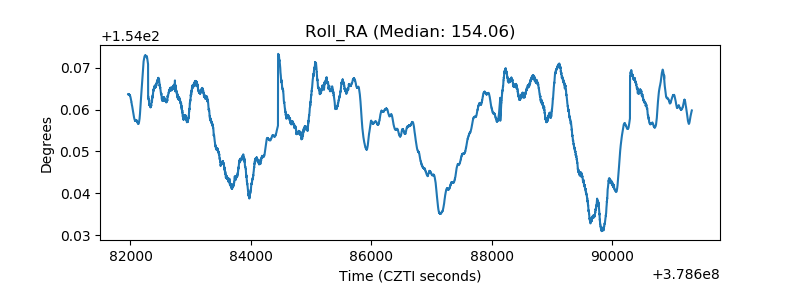 |
| Veto Counter | 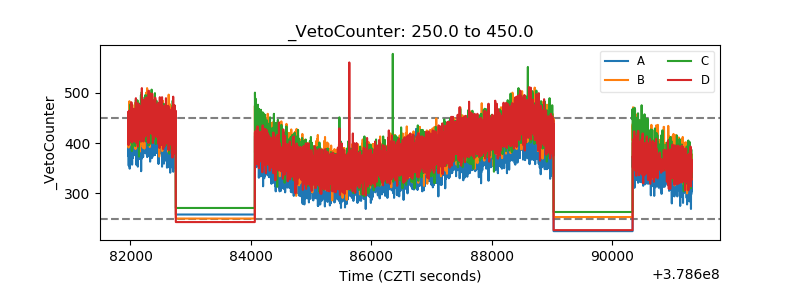 |