| Param | Original file | Final file |
|---|---|---|
| Filename | modeM0/AS1A11_065T11_9000004830_33851cztM0_level2.evt | modeM0/AS1A11_065T11_9000004830_33851cztM0_level2_quad_clean.evt |
| Size (bytes) | 997,954,560 | 132,068,160 |
| Size | 951.7 MB | 126.0 MB |
| Events in quadrant A | 5,554,265 | 815,100 |
| Events in quadrant B | 7,174,621 | 810,814 |
| Events in quadrant C | 6,061,897 | 814,706 |
| Events in quadrant D | 10,662,558 | 769,749 |
| Mode SS | |||
|---|---|---|---|
| Quadrant | BADHDUFLAG | Total packets | Discarded packets |
| A | 0 | 232 | 0 |
| B | 0 | 232 | 0 |
| C | 0 | 232 | 0 |
| D | 0 | 232 | 0 |
| Mode M0 | |||
|---|---|---|---|
| Quadrant | BADHDUFLAG | Total packets | Discarded packets |
| A | 0 | 23670 | 4 |
| B | 0 | 29142 | 3 |
| C | 0 | 25157 | 3 |
| D | 0 | 39742 | 3 |
| Mode M9 | |||
|---|---|---|---|
| Quadrant | BADHDUFLAG | Total packets | Discarded packets |
| A | 0 | 42 | 0 |
| B | 0 | 42 | 0 |
| C | 0 | 42 | 0 |
| D | 0 | 42 | 0 |
| Quadrant | Total seconds | Saturated seconds | Saturation percentage |
|---|---|---|---|
| A | 11412 | 16 | 0.140203% |
| B | 11412 | 609 | 5.336488% |
| C | 11412 | 42 | 0.368034% |
| D | 11412 | 1019 | 8.929197% |
Noise dominated data is calculated using 1-second bins in cleaned event files. If a bin has >2000 counts, and if more than 50% of those come from <1% of pixels, then it is considered to be noise-dominated and hence unusable.
| Quadrant | # 1 sec bins | Bins with >0 counts | Bins with >2000 counts | High rate bins dominated by noise | Noise dominated (total time) | Noise dominated (detector-on time) | Marked lightcurve |
|---|---|---|---|---|---|---|---|
| A | 15530 | 11415 | 0 | 0 | 0.00% | 0.00% | 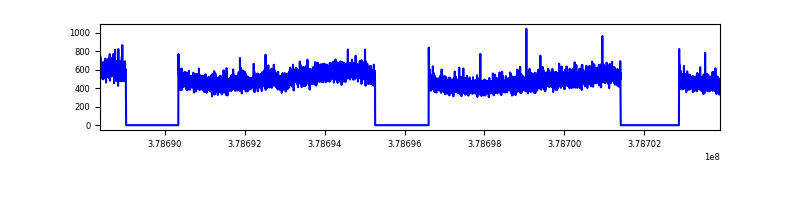 |
| B | 15530 | 11415 | 381 | 381 | 2.45% | 3.34% | 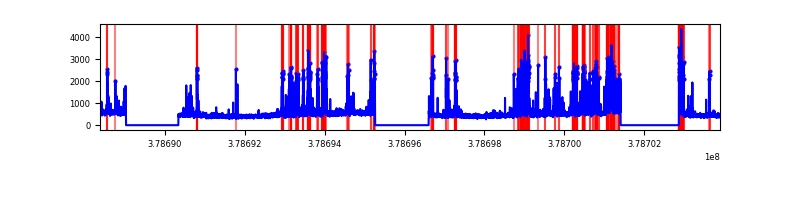 |
| C | 15530 | 11415 | 30 | 30 | 0.19% | 0.26% | 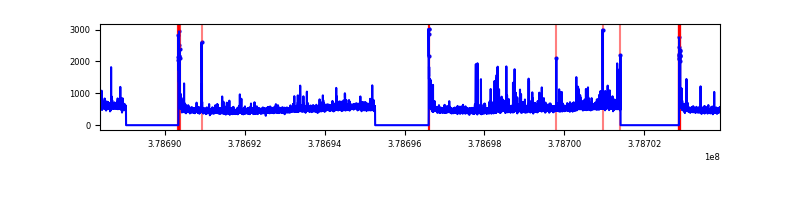 |
| D | 15530 | 11415 | 774 | 774 | 4.98% | 6.78% | 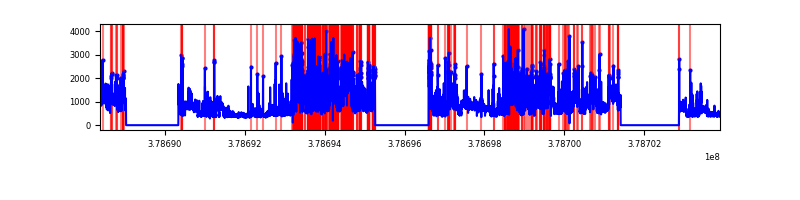 |
Top three noisy pixels from each quadrant. If the there are fewer than three noisy pixels in the level2.evt file, extra rows are filled as -1
| Pixel properties | Quadrant properties | ||||||
|---|---|---|---|---|---|---|---|
| Quadrant | DetID | PixID | Counts | Sigma | Mean | Median | Sigma |
| A | 15 | 169 | 329916 | 1222.05 | 1340 | 1314 | 268.9 |
| A | 13 | 6 | 36637 | 131.36 | 1340 | 1314 | 268.9 |
| A | 13 | 254 | 18701 | 64.66 | 1340 | 1314 | 268.9 |
| B | 5 | 172 | 1751073 | 7029.11 | 1300 | 1263 | 248.9 |
| B | 5 | 255 | 108864 | 432.24 | 1300 | 1263 | 248.9 |
| B | 15 | 85 | 102520 | 406.76 | 1300 | 1263 | 248.9 |
| C | 15 | 214 | 490816 | 1652.13 | 1296 | 1305 | 296.3 |
| C | 0 | 207 | 157857 | 528.37 | 1296 | 1305 | 296.3 |
| C | 0 | 10 | 153220 | 512.72 | 1296 | 1305 | 296.3 |
| D | 8 | 195 | 2001264 | 6556.16 | 1261 | 1228 | 305.1 |
| D | 12 | 235 | 1418793 | 4646.81 | 1261 | 1228 | 305.1 |
| D | 2 | 250 | 1214091 | 3975.79 | 1261 | 1228 | 305.1 |
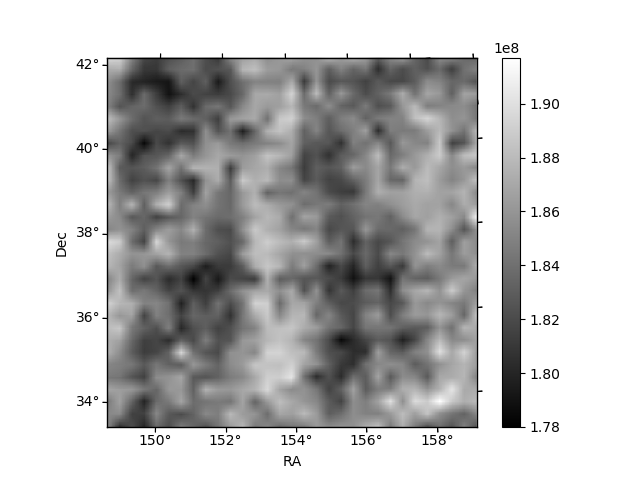
Histogram calculated using DETX and DETY for each event in the final _common_clean file
| Quadrant A | 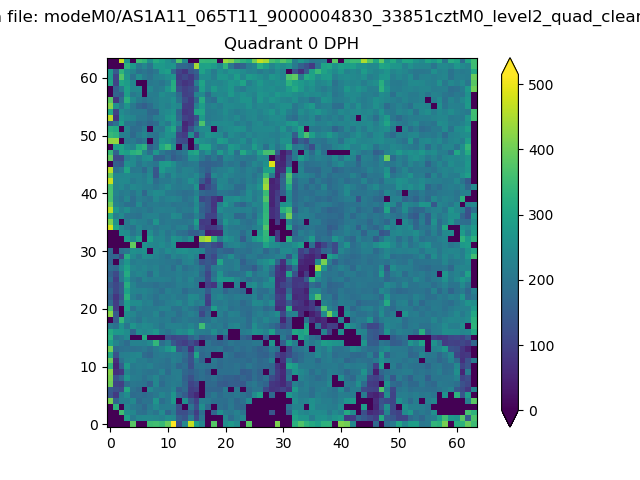 |
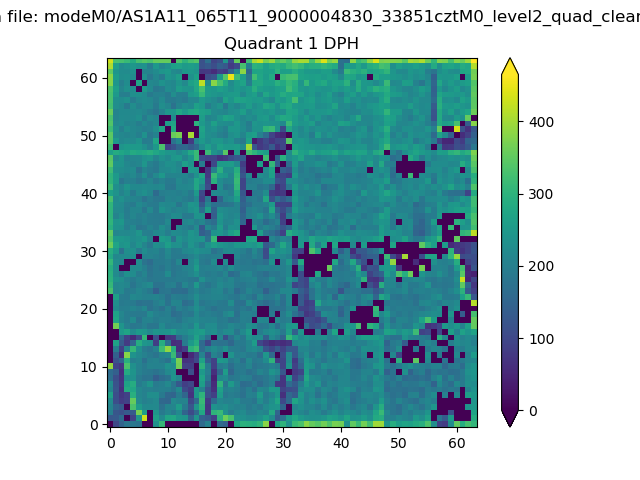 |
Quadrant B |
|---|---|---|---|
| Quadrant D | 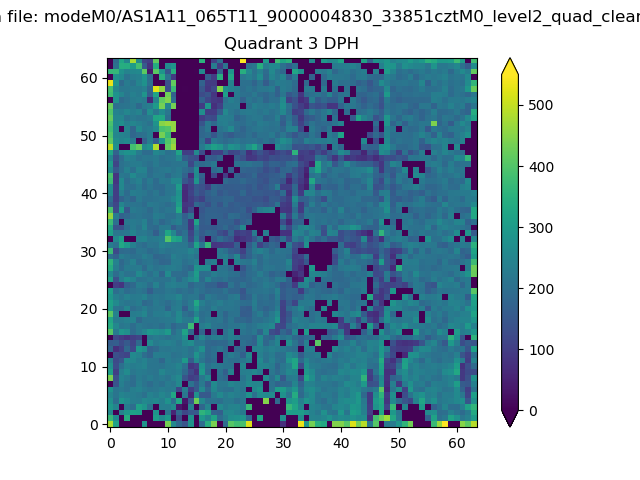 |
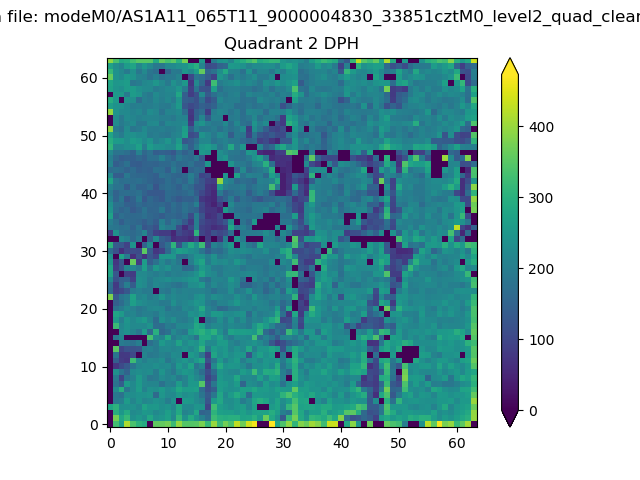 |
Quadrant C |
| Plot type | Count rate plots | Images |
|---|---|---|
| Comparison with Poisson distribution Blue bars denote a histogram of data divided into 1 sec bins. Red curve is a Poisson curve with rate = median count rate of data. |
 |
 |
| Quadrant-wise count rates Data is divided into 100 sec bins |
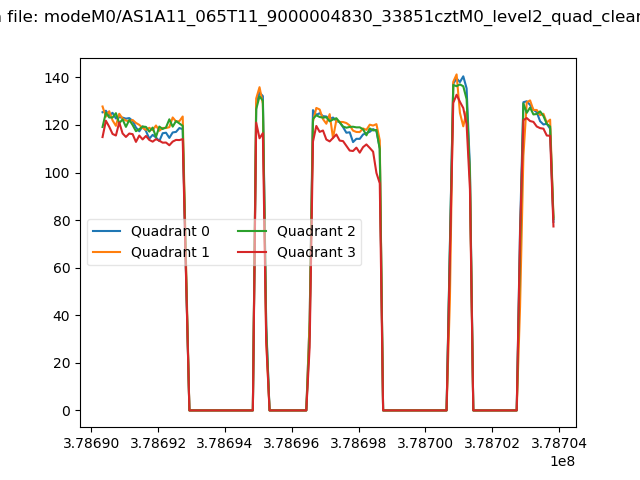 |
|
| Module-wise count rates for Quadrant A Data is divided into 100 sec bins |
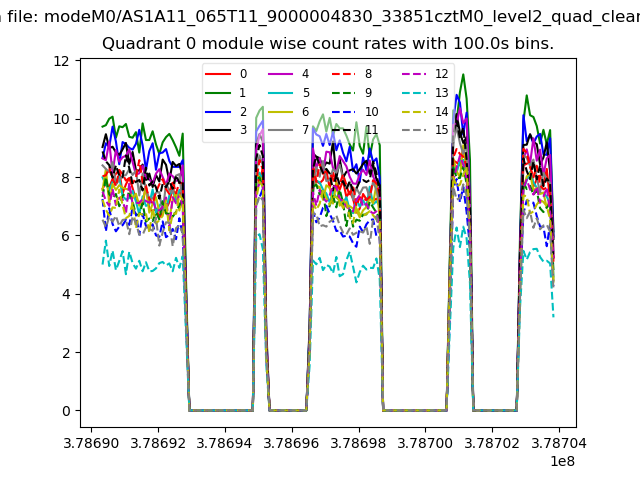 |
 |
| Module-wise count rates for Quadrant B Data is divided into 100 sec bins |
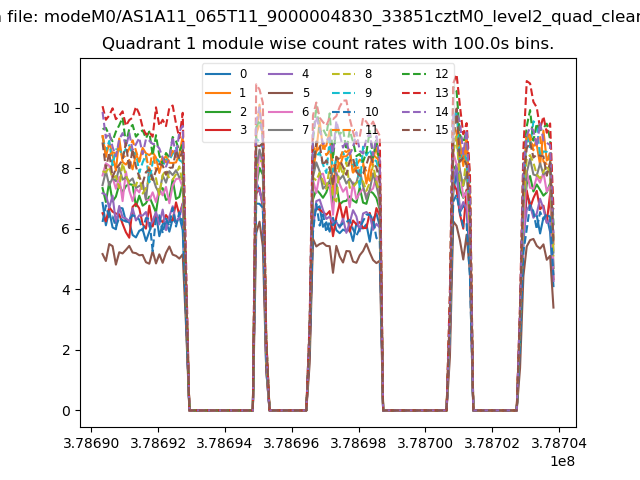 |
 |
| Module-wise count rates for Quadrant C Data is divided into 100 sec bins |
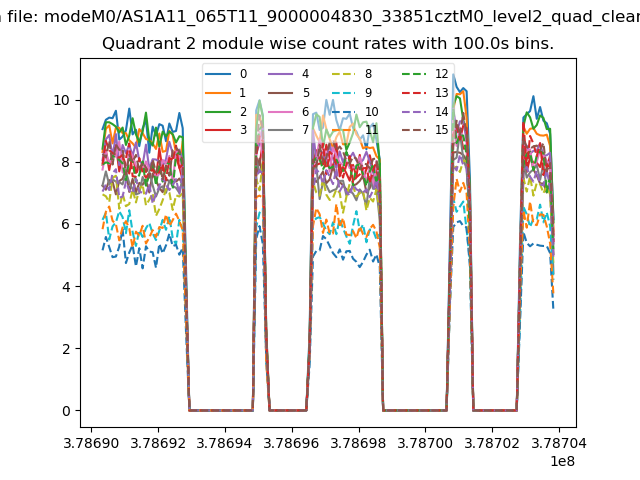 |
 |
| Module-wise count rates for Quadrant D Data is divided into 100 sec bins |
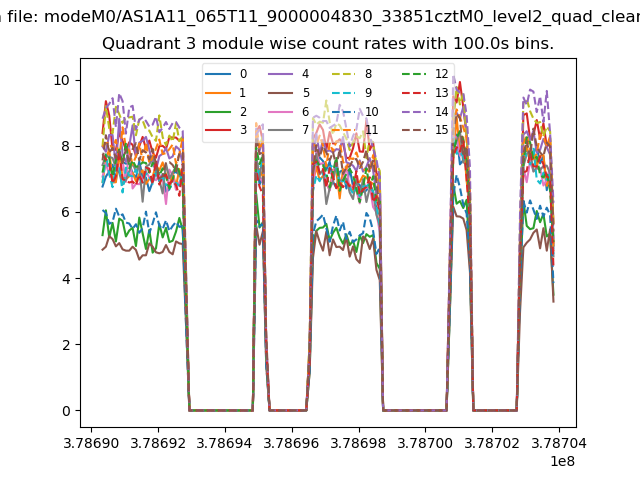 |
 |
| Parameter | Plot |
|---|---|
| CZT HV Monitor | 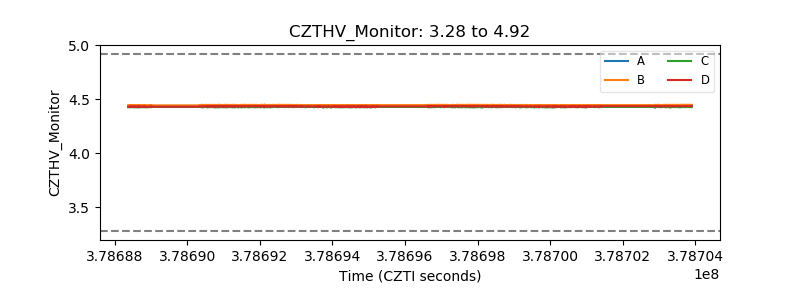 |
| D_VDD | 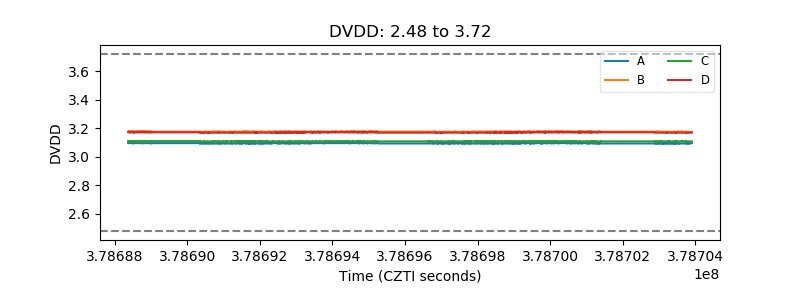 |
| Temperature 1 | 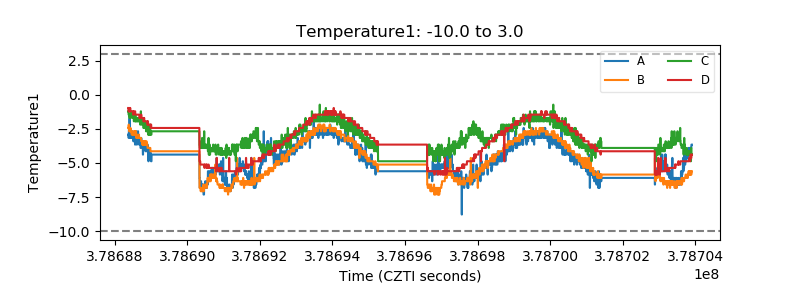 |
| Veto HV Monitor | 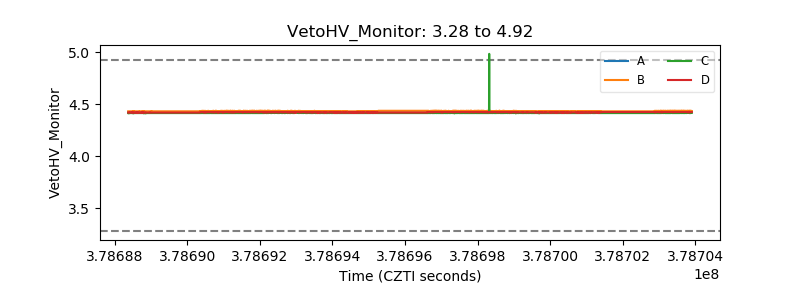 |
| Veto LLD | 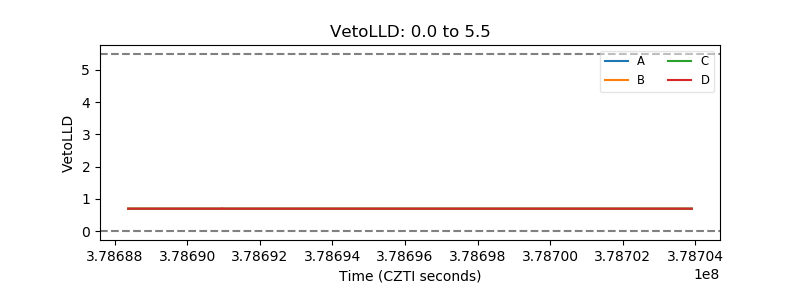 |
| Alpha Counter |  |
| _CPM_Rate | 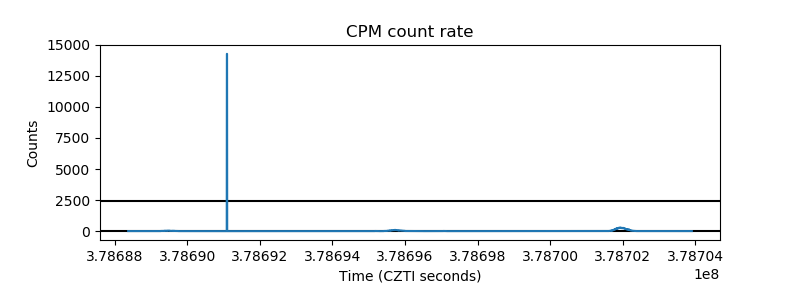 |
| CZT Counter | 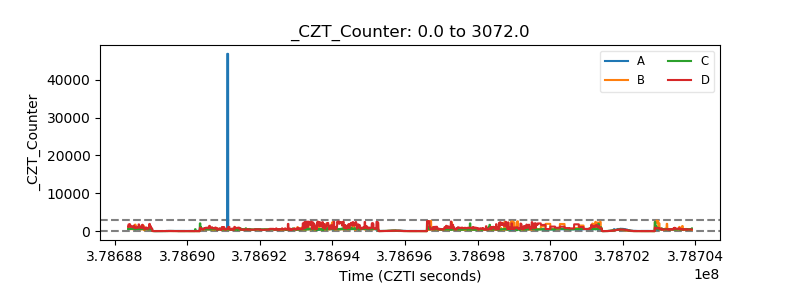 |
| +2.5 Volts monitor | 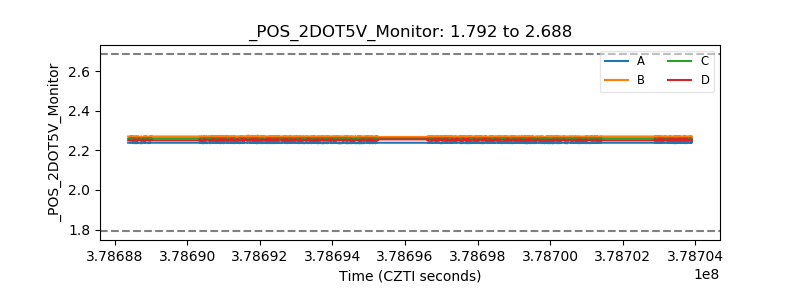 |
| +5 Volts monitor |  |
| _ROLL_ROT | 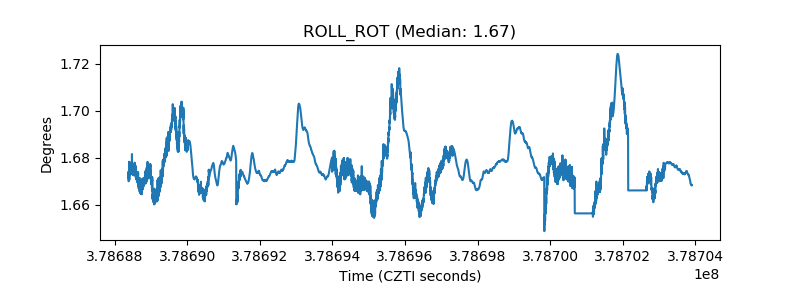 |
| _Roll_DEC | 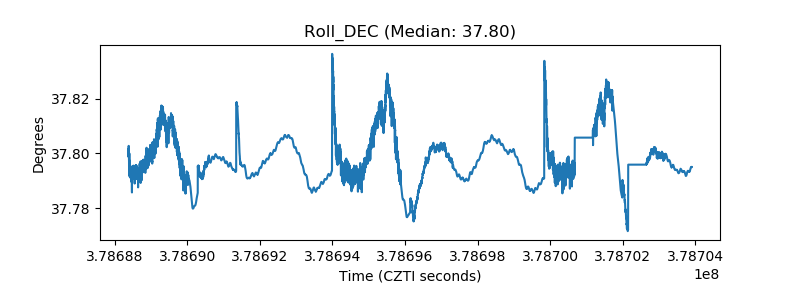 |
| _Roll_RA | 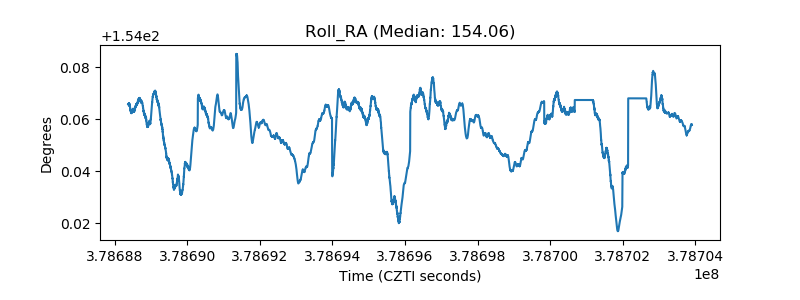 |
| Veto Counter | 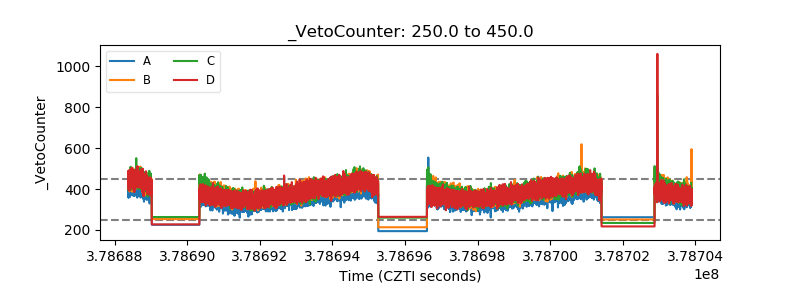 |