| Param | Original file | Final file |
|---|---|---|
| Filename | modeM0/AS1A11_065T11_9000004830_33853cztM0_level2.evt | modeM0/AS1A11_065T11_9000004830_33853cztM0_level2_quad_clean.evt |
| Size (bytes) | 510,477,120 | 69,952,320 |
| Size | 486.8 MB | 66.7 MB |
| Events in quadrant A | 2,704,417 | 452,582 |
| Events in quadrant B | 3,855,836 | 431,500 |
| Events in quadrant C | 3,096,339 | 444,921 |
| Events in quadrant D | 5,430,806 | 404,229 |
| Mode SS | |||
|---|---|---|---|
| Quadrant | BADHDUFLAG | Total packets | Discarded packets |
| A | 0 | 112 | 0 |
| B | 0 | 112 | 0 |
| C | 0 | 112 | 0 |
| D | 0 | 112 | 0 |
| Mode M0 | |||
|---|---|---|---|
| Quadrant | BADHDUFLAG | Total packets | Discarded packets |
| A | 0 | 11151 | 3 |
| B | 0 | 14861 | 2 |
| C | 0 | 12314 | 2 |
| D | 0 | 19924 | 2 |
| Mode M9 | |||
|---|---|---|---|
| Quadrant | BADHDUFLAG | Total packets | Discarded packets |
| A | 0 | 18 | 0 |
| B | 0 | 18 | 0 |
| C | 0 | 18 | 0 |
| D | 0 | 19 | 0 |
| Quadrant | Total seconds | Saturated seconds | Saturation percentage |
|---|---|---|---|
| A | 5494 | 3 | 0.054605% |
| B | 5494 | 411 | 7.480888% |
| C | 5494 | 65 | 1.183109% |
| D | 5494 | 503 | 9.155442% |
Noise dominated data is calculated using 1-second bins in cleaned event files. If a bin has >2000 counts, and if more than 50% of those come from <1% of pixels, then it is considered to be noise-dominated and hence unusable.
| Quadrant | # 1 sec bins | Bins with >0 counts | Bins with >2000 counts | High rate bins dominated by noise | Noise dominated (total time) | Noise dominated (detector-on time) | Marked lightcurve |
|---|---|---|---|---|---|---|---|
| A | 7197 | 5495 | 0 | 0 | 0.00% | 0.00% | 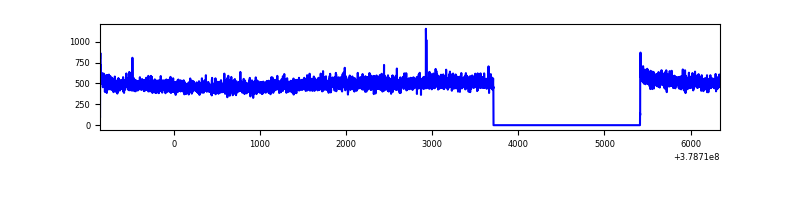 |
| B | 7197 | 5495 | 321 | 321 | 4.46% | 5.84% | 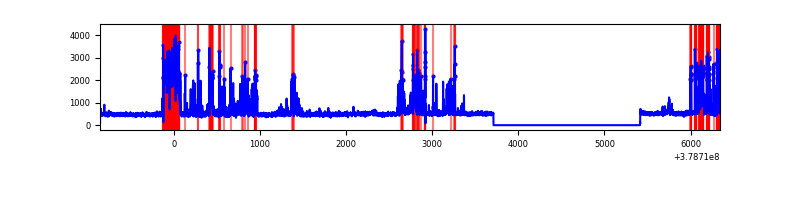 |
| C | 7197 | 5495 | 53 | 53 | 0.74% | 0.96% | 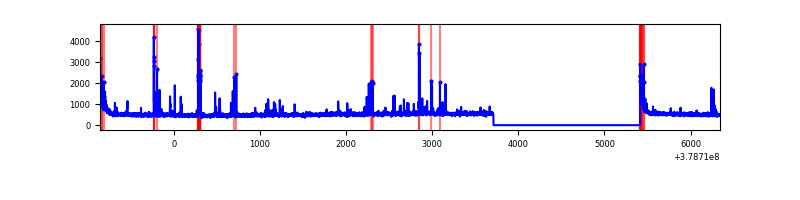 |
| D | 7197 | 5495 | 446 | 446 | 6.20% | 8.12% | 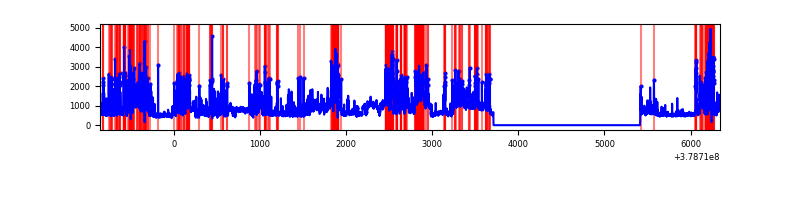 |
Top three noisy pixels from each quadrant. If the there are fewer than three noisy pixels in the level2.evt file, extra rows are filled as -1
| Pixel properties | Quadrant properties | ||||||
|---|---|---|---|---|---|---|---|
| Quadrant | DetID | PixID | Counts | Sigma | Mean | Median | Sigma |
| A | 15 | 169 | 109092 | 816.74 | 665 | 652 | 132.8 |
| A | 13 | 6 | 15152 | 109.21 | 665 | 652 | 132.8 |
| A | 10 | 83 | 11033 | 78.19 | 665 | 652 | 132.8 |
| B | 5 | 172 | 1239240 | 10305.92 | 630 | 615 | 120.2 |
| B | 0 | 190 | 64700 | 533.22 | 630 | 615 | 120.2 |
| B | 5 | 255 | 34754 | 284.05 | 630 | 615 | 120.2 |
| C | 15 | 214 | 239166 | 1627.44 | 634 | 640 | 146.6 |
| C | 14 | 254 | 190524 | 1295.56 | 634 | 640 | 146.6 |
| C | 0 | 10 | 110481 | 749.43 | 634 | 640 | 146.6 |
| D | 2 | 250 | 1068503 | 7082.06 | 620 | 603 | 150.8 |
| D | 8 | 195 | 931736 | 6175.05 | 620 | 603 | 150.8 |
| D | 13 | 249 | 307522 | 2035.41 | 620 | 603 | 150.8 |
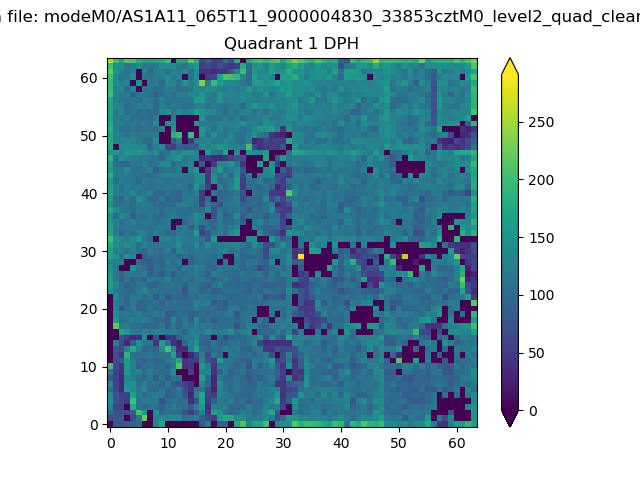
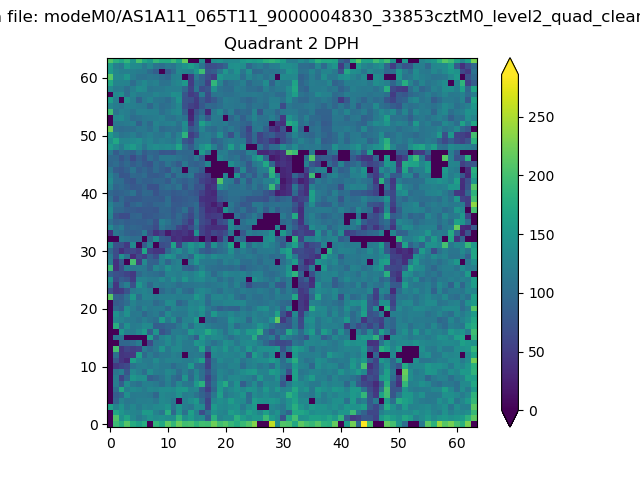
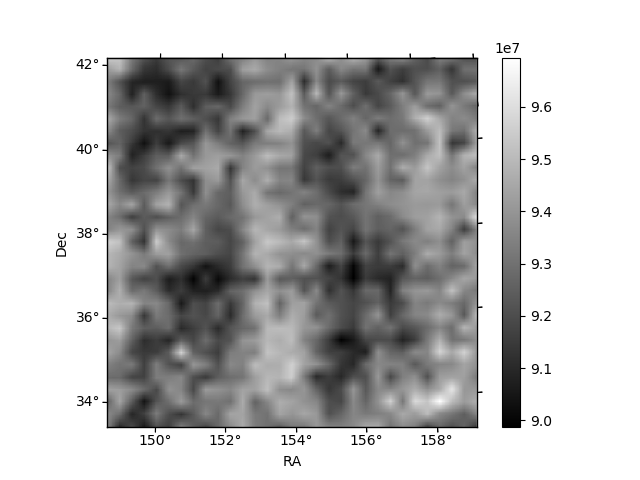
Histogram calculated using DETX and DETY for each event in the final _common_clean file
| Quadrant A |  |
 |
Quadrant B |
|---|---|---|---|
| Quadrant D | 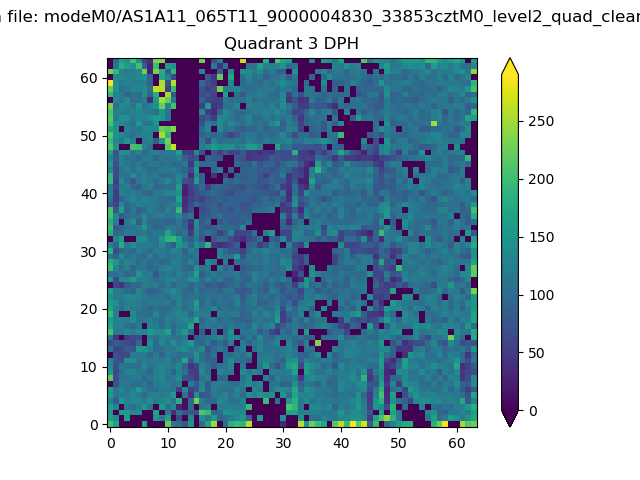 |
 |
Quadrant C |
| Plot type | Count rate plots | Images |
|---|---|---|
| Comparison with Poisson distribution Blue bars denote a histogram of data divided into 1 sec bins. Red curve is a Poisson curve with rate = median count rate of data. |
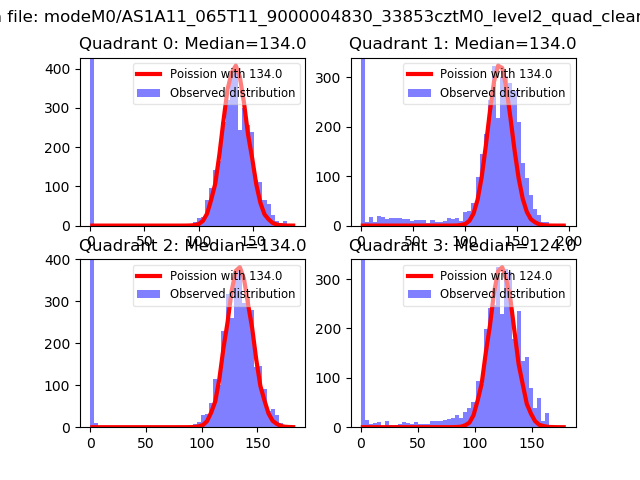 |
 |
| Quadrant-wise count rates Data is divided into 100 sec bins |
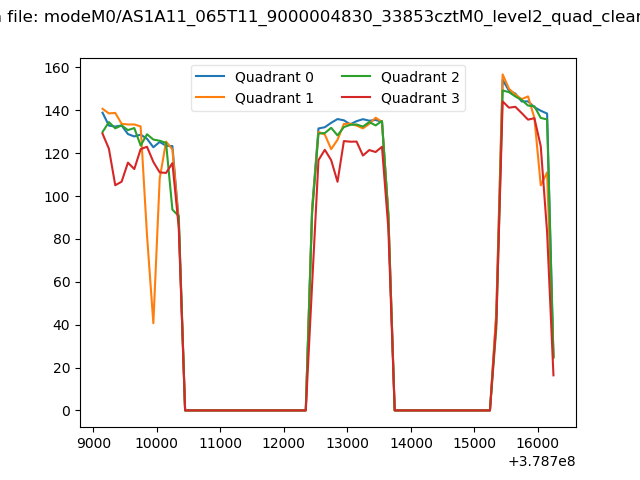 |
|
| Module-wise count rates for Quadrant A Data is divided into 100 sec bins |
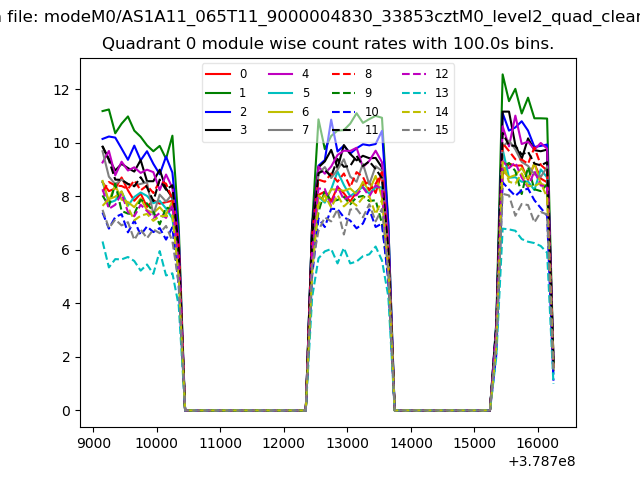 |
 |
| Module-wise count rates for Quadrant B Data is divided into 100 sec bins |
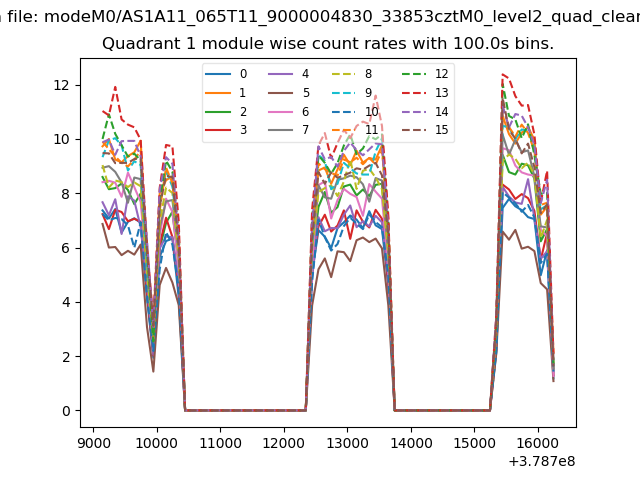 |
 |
| Module-wise count rates for Quadrant C Data is divided into 100 sec bins |
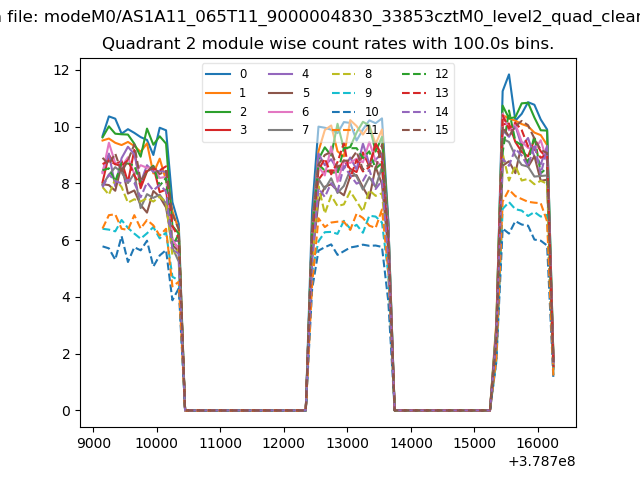 |
 |
| Module-wise count rates for Quadrant D Data is divided into 100 sec bins |
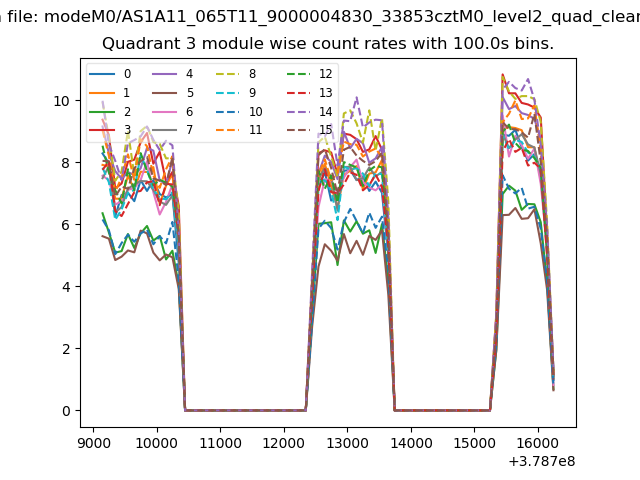 |
 |
| Parameter | Plot |
|---|---|
| CZT HV Monitor | 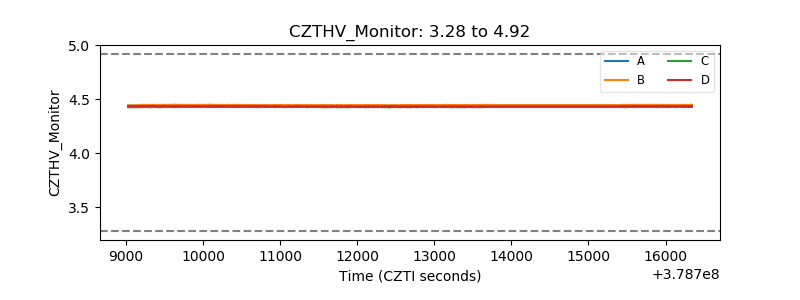 |
| D_VDD | 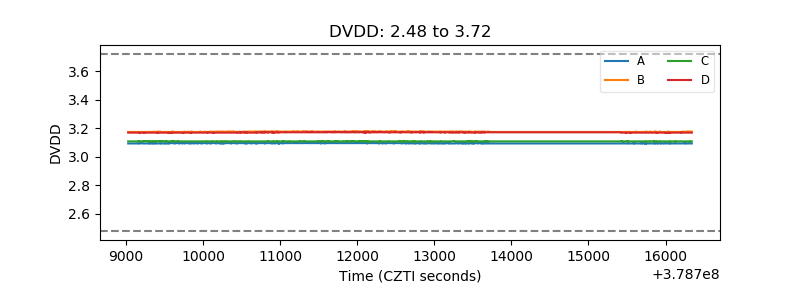 |
| Temperature 1 | 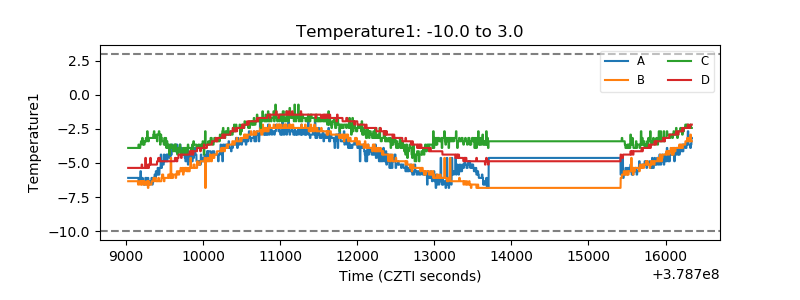 |
| Veto HV Monitor |  |
| Veto LLD | 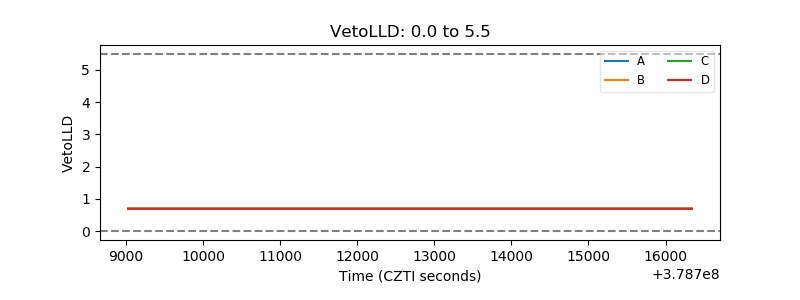 |
| Alpha Counter | 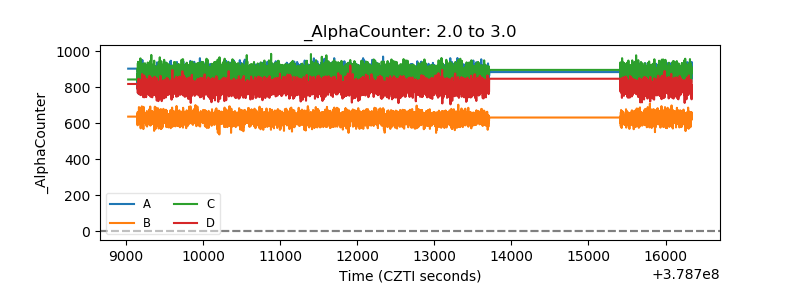 |
| _CPM_Rate | 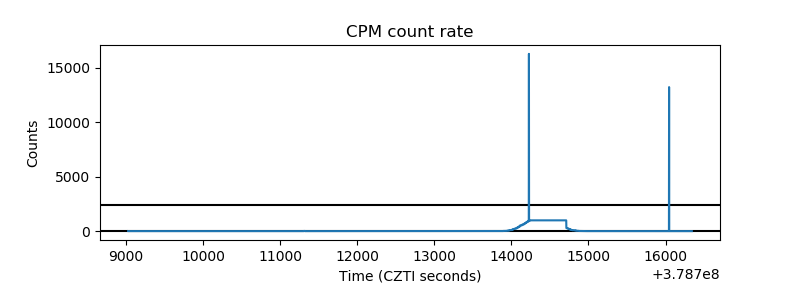 |
| CZT Counter | 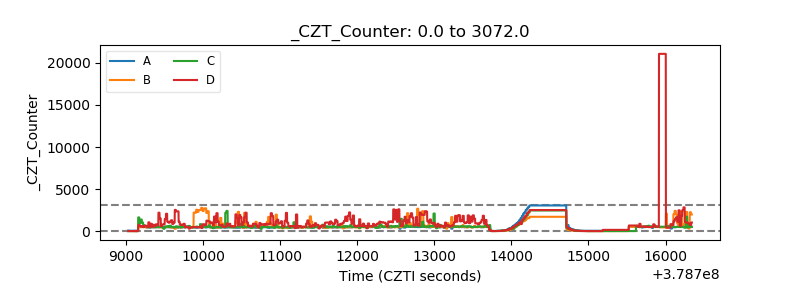 |
| +2.5 Volts monitor |  |
| +5 Volts monitor |  |
| _ROLL_ROT | 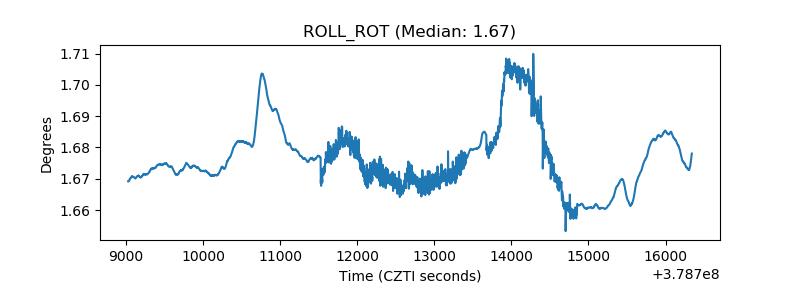 |
| _Roll_DEC | 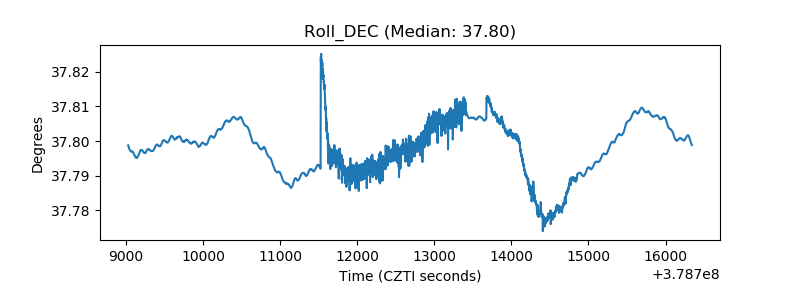 |
| _Roll_RA | 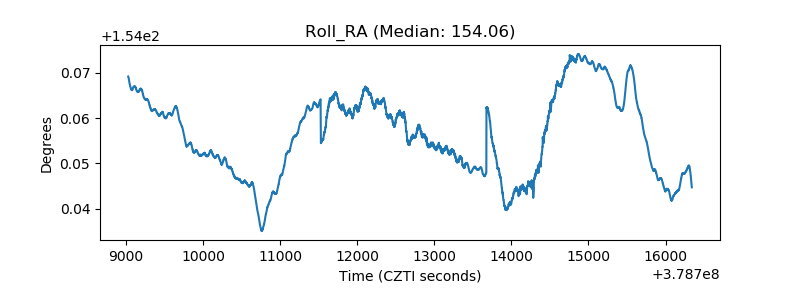 |
| Veto Counter | 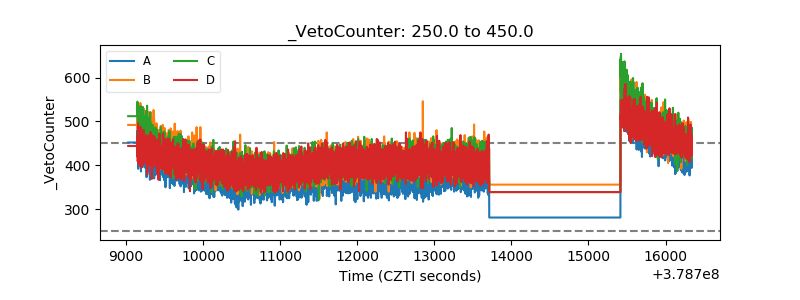 |