| Param | Original file | Final file |
|---|---|---|
| Filename | modeM0/AS1A11_065T11_9000004830_33857cztM0_level2.evt | modeM0/AS1A11_065T11_9000004830_33857cztM0_level2_quad_clean.evt |
| Size (bytes) | 331,971,840 | 24,675,840 |
| Size | 316.6 MB | 23.5 MB |
| Events in quadrant A | 1,554,749 | 145,450 |
| Events in quadrant B | 2,103,371 | 136,840 |
| Events in quadrant C | 1,614,266 | 142,164 |
| Events in quadrant D | 4,569,407 | 100,846 |
| Mode SS | |||
|---|---|---|---|
| Quadrant | BADHDUFLAG | Total packets | Discarded packets |
| A | 0 | 62 | 0 |
| B | 0 | 62 | 0 |
| C | 0 | 62 | 0 |
| D | 0 | 62 | 0 |
| Mode M0 | |||
|---|---|---|---|
| Quadrant | BADHDUFLAG | Total packets | Discarded packets |
| A | 0 | 6281 | 0 |
| B | 0 | 8119 | 0 |
| C | 0 | 6470 | 0 |
| D | 0 | 15720 | 0 |
| Quadrant | Total seconds | Saturated seconds | Saturation percentage |
|---|---|---|---|
| A | 3107 | 2 | 0.064371% |
| B | 3107 | 206 | 6.630190% |
| C | 3107 | 3 | 0.096556% |
| D | 3107 | 910 | 29.288703% |
Noise dominated data is calculated using 1-second bins in cleaned event files. If a bin has >2000 counts, and if more than 50% of those come from <1% of pixels, then it is considered to be noise-dominated and hence unusable.
| Quadrant | # 1 sec bins | Bins with >0 counts | Bins with >2000 counts | High rate bins dominated by noise | Noise dominated (total time) | Noise dominated (detector-on time) | Marked lightcurve |
|---|---|---|---|---|---|---|---|
| A | 3107 | 3107 | 0 | 0 | 0.00% | 0.00% | 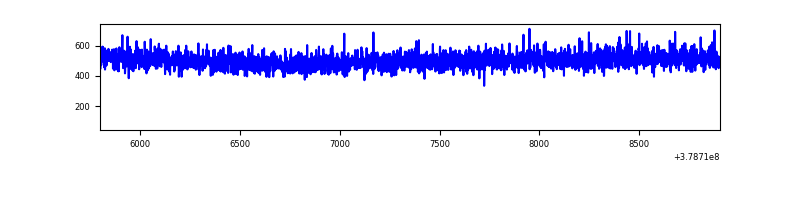 |
| B | 3107 | 3107 | 160 | 160 | 5.15% | 5.15% | 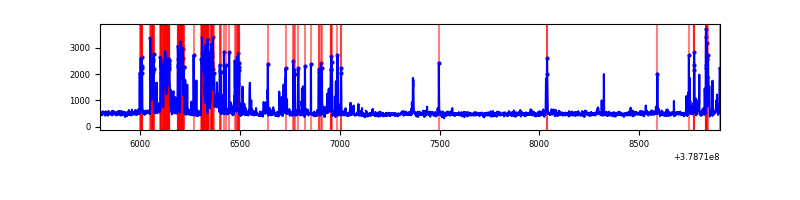 |
| C | 3107 | 3107 | 2 | 2 | 0.06% | 0.06% | 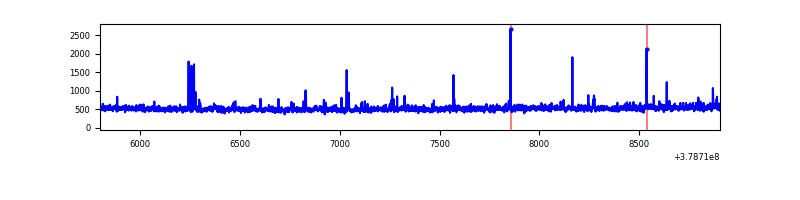 |
| D | 3107 | 3107 | 783 | 783 | 25.20% | 25.20% | 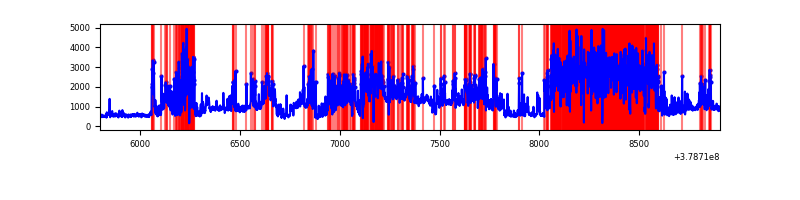 |
Top three noisy pixels from each quadrant. If the there are fewer than three noisy pixels in the level2.evt file, extra rows are filled as -1
| Pixel properties | Quadrant properties | ||||||
|---|---|---|---|---|---|---|---|
| Quadrant | DetID | PixID | Counts | Sigma | Mean | Median | Sigma |
| A | 15 | 169 | 75937 | 973.89 | 380 | 373 | 77.6 |
| A | 13 | 6 | 7678 | 94.15 | 380 | 373 | 77.6 |
| A | 13 | 254 | 5472 | 65.72 | 380 | 373 | 77.6 |
| B | 5 | 172 | 600605 | 8597.99 | 359 | 350 | 69.8 |
| B | 5 | 255 | 27896 | 394.56 | 359 | 350 | 69.8 |
| B | 15 | 85 | 19488 | 274.12 | 359 | 350 | 69.8 |
| C | 15 | 214 | 128717 | 1516.91 | 362 | 364 | 84.6 |
| C | 14 | 254 | 25720 | 299.66 | 362 | 364 | 84.6 |
| C | 15 | 159 | 24162 | 281.25 | 362 | 364 | 84.6 |
| D | 2 | 250 | 1824713 | 24174.91 | 304 | 295 | 75.5 |
| D | 8 | 195 | 744811 | 9865.4 | 304 | 295 | 75.5 |
| D | 13 | 249 | 247650 | 3277.64 | 304 | 295 | 75.5 |
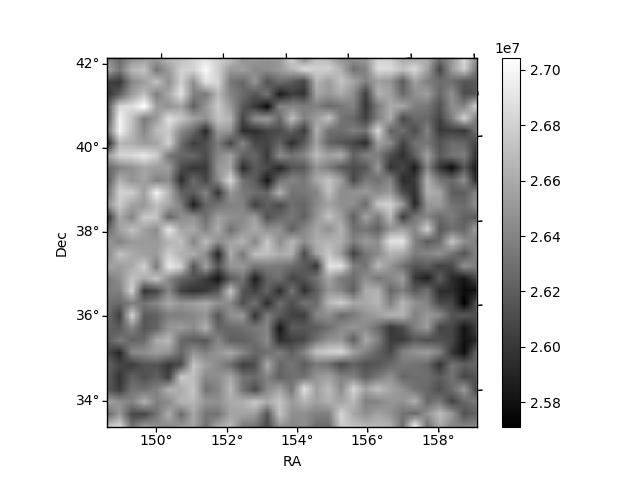
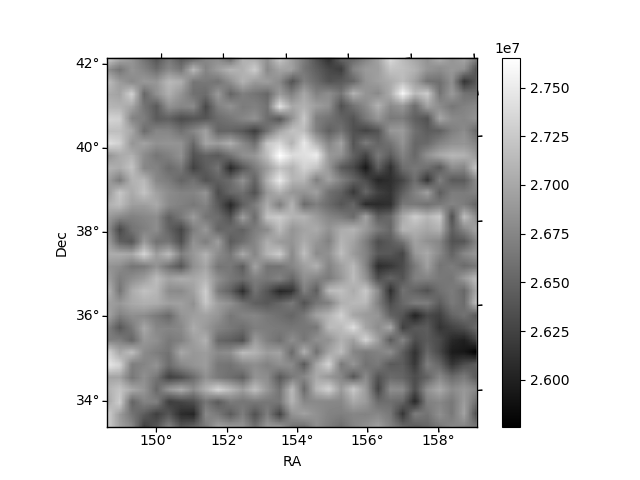
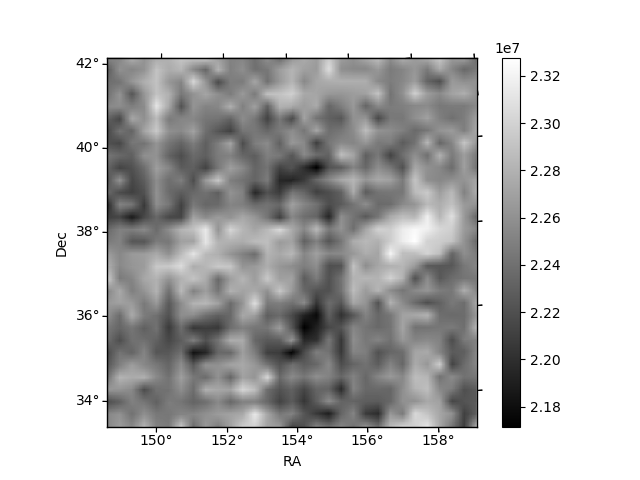
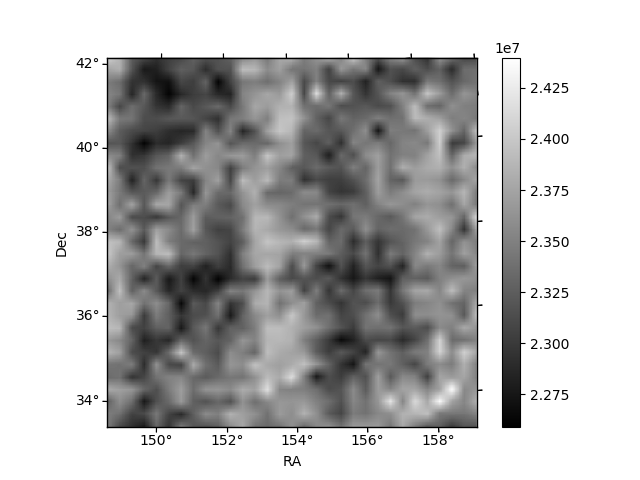
Histogram calculated using DETX and DETY for each event in the final _common_clean file
| Quadrant A | 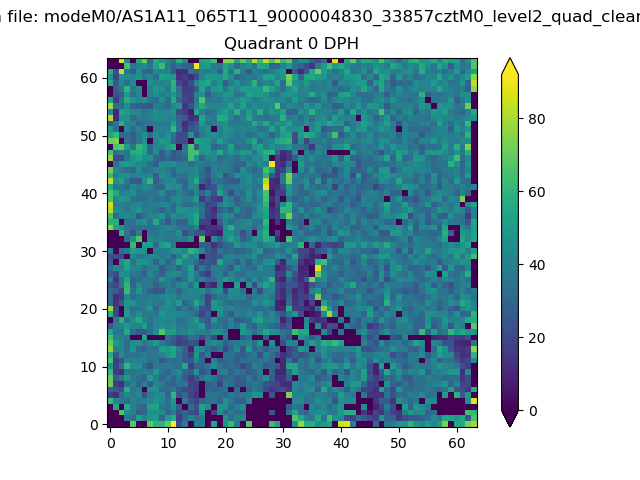 |
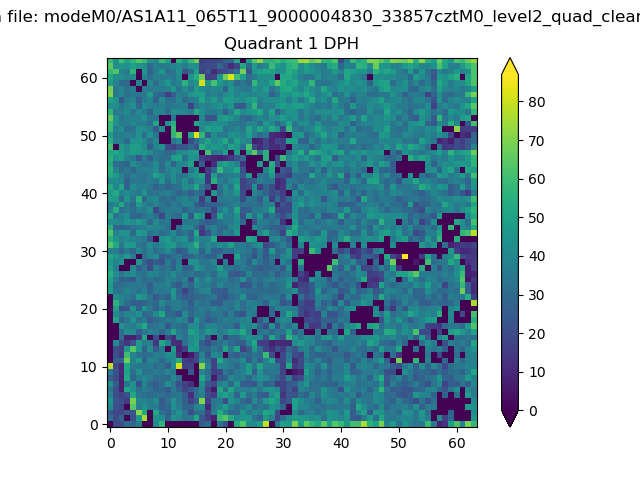 |
Quadrant B |
|---|---|---|---|
| Quadrant D | 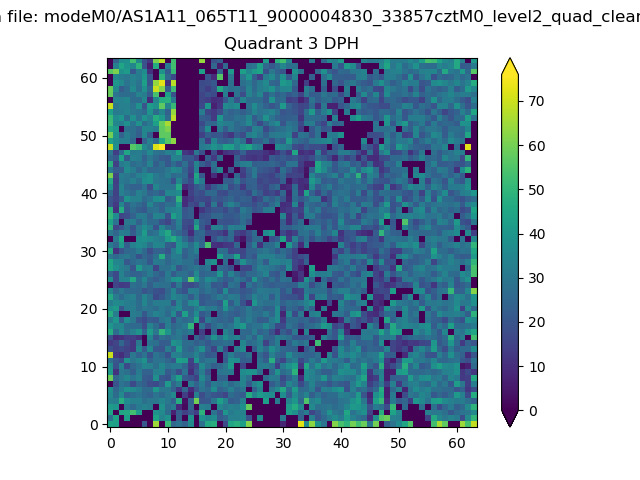 |
 |
Quadrant C |
| Plot type | Count rate plots | Images |
|---|---|---|
| Comparison with Poisson distribution Blue bars denote a histogram of data divided into 1 sec bins. Red curve is a Poisson curve with rate = median count rate of data. |
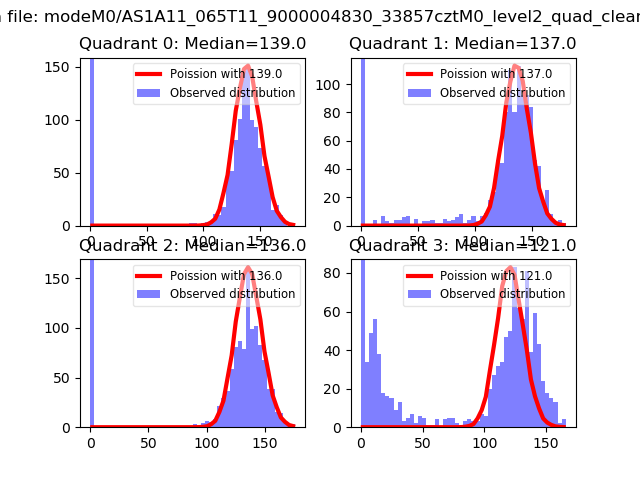 |
 |
| Quadrant-wise count rates Data is divided into 100 sec bins |
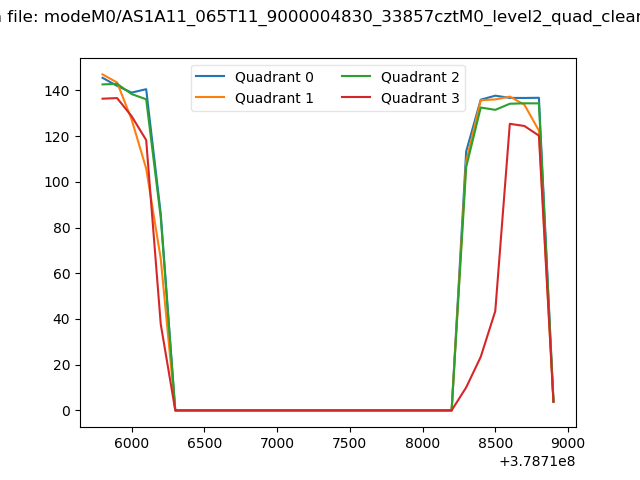 |
|
| Module-wise count rates for Quadrant A Data is divided into 100 sec bins |
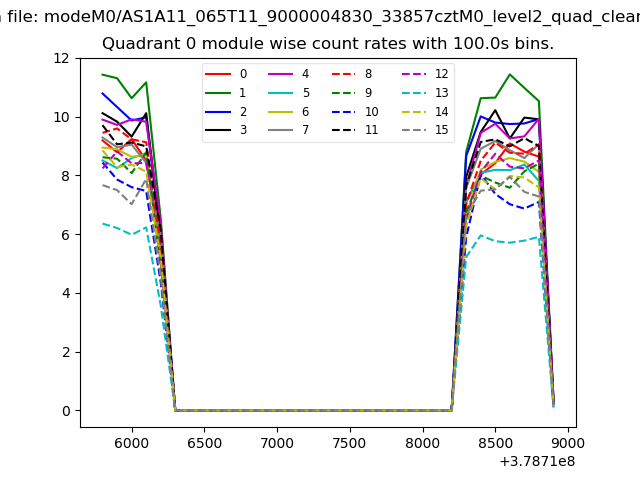 |
 |
| Module-wise count rates for Quadrant B Data is divided into 100 sec bins |
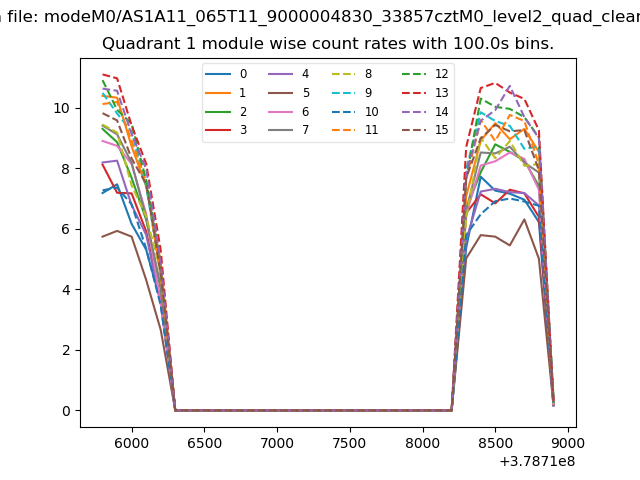 |
 |
| Module-wise count rates for Quadrant C Data is divided into 100 sec bins |
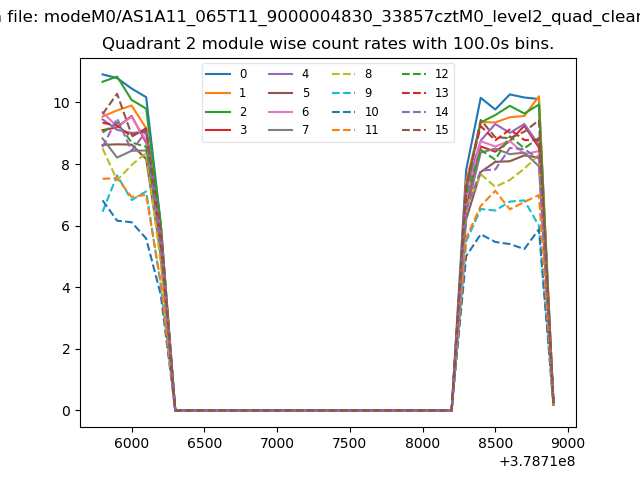 |
 |
| Module-wise count rates for Quadrant D Data is divided into 100 sec bins |
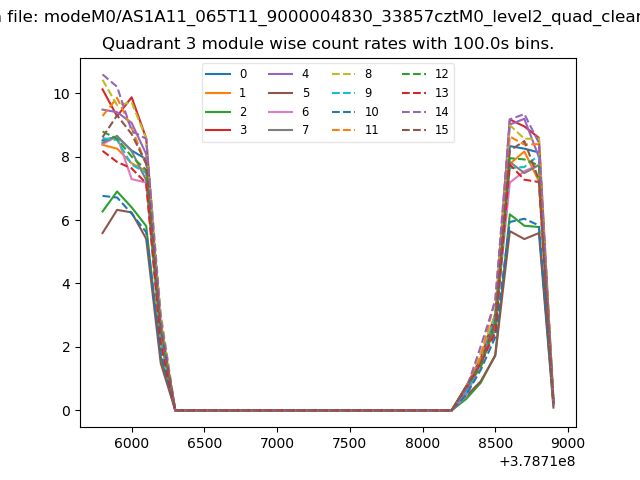 |
 |
| Parameter | Plot |
|---|---|
| CZT HV Monitor | 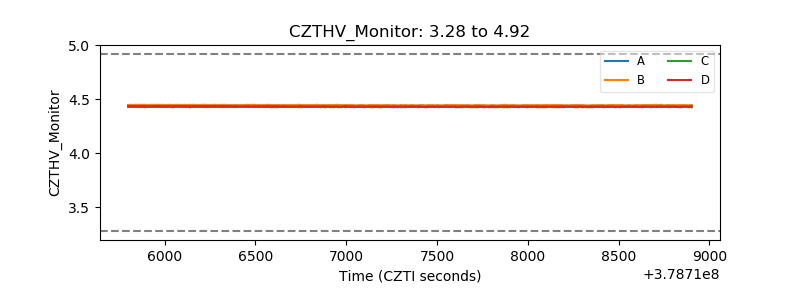 |
| D_VDD | 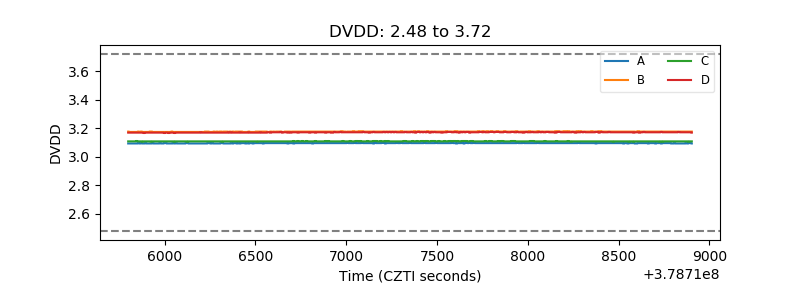 |
| Temperature 1 | 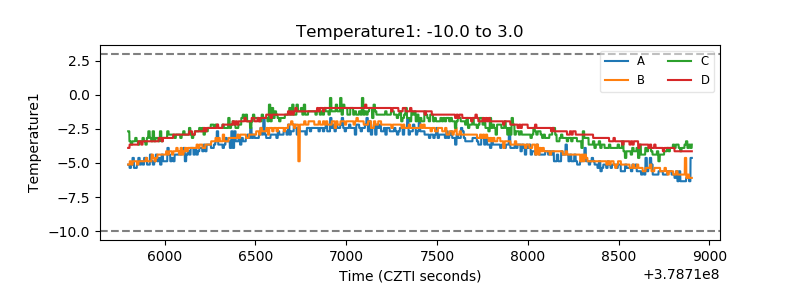 |
| Veto HV Monitor | 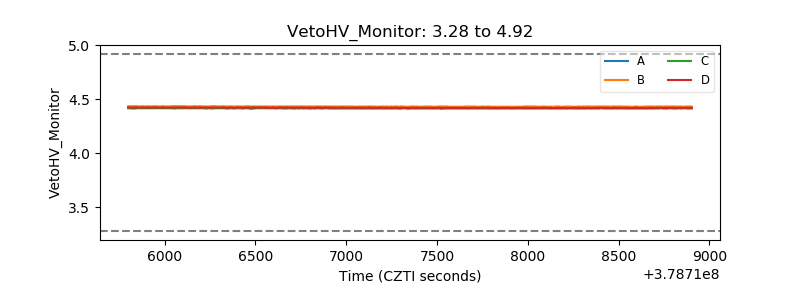 |
| Veto LLD | 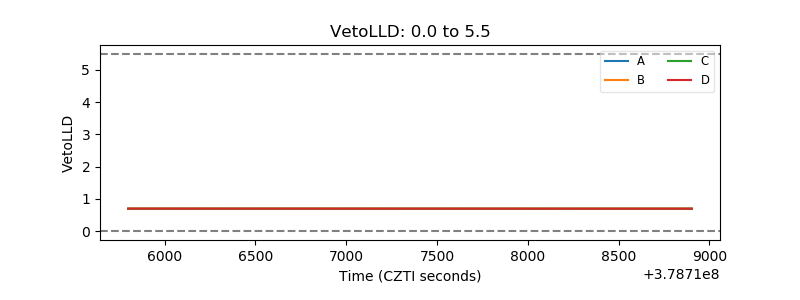 |
| Alpha Counter | 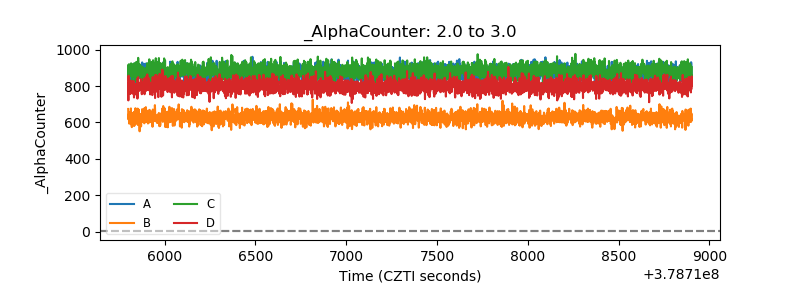 |
| _CPM_Rate | 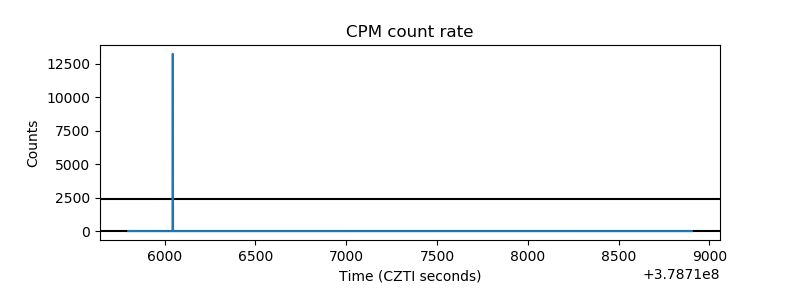 |
| CZT Counter |  |
| +2.5 Volts monitor |  |
| +5 Volts monitor | 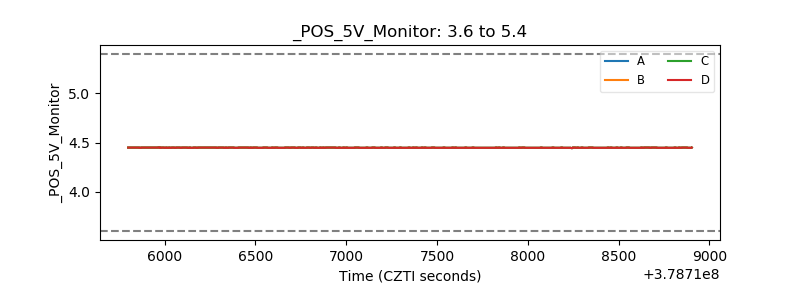 |
| _ROLL_ROT | 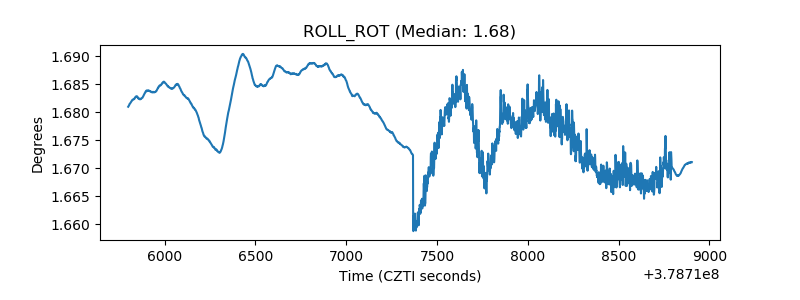 |
| _Roll_DEC | 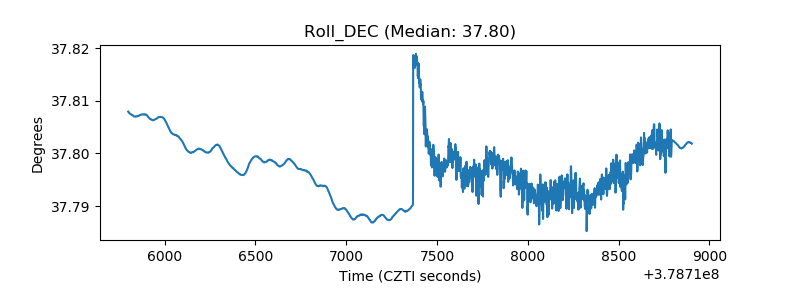 |
| _Roll_RA |  |
| Veto Counter | 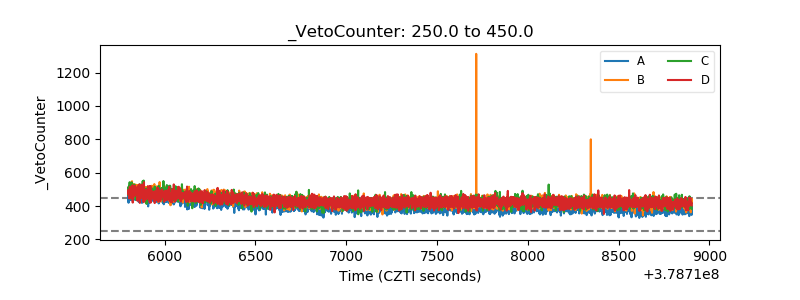 |