| Param | Original file | Final file |
|---|---|---|
| Filename | modeM0/AS1A11_046T03_9000004834cztM0_level2.fits | modeM0/AS1A11_046T03_9000004834cztM0_level2_quad_clean.evt |
| Size (bytes) | 372,873,600 | 358,153,920 |
| Size | 355.6 MB | 341.6 MB |
| Events in quadrant A | 2,254,200 | 2,009,851 |
| Events in quadrant B | 2,150,452 | 2,128,790 |
| Events in quadrant C | 2,260,428 | 2,120,199 |
| Events in quadrant D | 1,901,646 | 1,863,427 |
| Mode M9 | |||
|---|---|---|---|
| Quadrant | BADHDUFLAG | Total packets | Discarded packets |
| A | 0 | 139 | 0 |
| B | 0 | 139 | 0 |
| C | 0 | 139 | 0 |
| D | 0 | 139 | 0 |
| Mode M0 | |||
|---|---|---|---|
| Quadrant | BADHDUFLAG | Total packets | Discarded packets |
| A | 0 | 92771 | 0 |
| B | 0 | 99317 | 0 |
| C | 0 | 88282 | 0 |
| D | 0 | 133173 | 0 |
| Mode SS | |||
|---|---|---|---|
| Quadrant | BADHDUFLAG | Total packets | Discarded packets |
| A | 0 | 814 | 0 |
| B | 0 | 814 | 0 |
| C | 0 | 814 | 0 |
| D | 0 | 814 | 0 |
| Quadrant | Total seconds | Saturated seconds | Saturation percentage |
|---|---|---|---|
| A | 39657 | 2153 | 5.429054% |
| B | 39657 | 1707 | 4.304410% |
| C | 39657 | 332 | 0.837179% |
| D | 39656 | 2240 | 5.648578% |
Noise dominated data is calculated using 1-second bins in cleaned event files. If a bin has >2000 counts, and if more than 50% of those come from <1% of pixels, then it is considered to be noise-dominated and hence unusable.
| Quadrant | # 1 sec bins | Bins with >0 counts | Bins with >2000 counts | High rate bins dominated by noise | Noise dominated (total time) | Noise dominated (detector-on time) | Marked lightcurve |
|---|---|---|---|---|---|---|---|
| A | 57504 | 39651 | 0 | 0 | 0.00% | 0.00% | 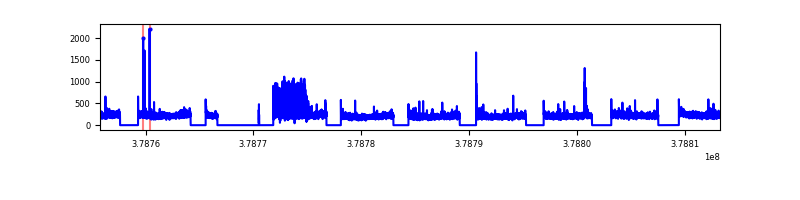 |
| B | 57504 | 39647 | 0 | 0 | 0.00% | 0.00% |  |
| C | 57504 | 39650 | 0 | 0 | 0.00% | 0.00% |  |
| D | 57504 | 39640 | 0 | 0 | 0.00% | 0.00% |  |
Top three noisy pixels from each quadrant. If the there are fewer than three noisy pixels in the level2.evt file, extra rows are filled as -1
| Pixel properties | Quadrant properties | ||||||
|---|---|---|---|---|---|---|---|
| Quadrant | DetID | PixID | Counts | Sigma | Mean | Median | Sigma |
| A | 7 | 110 | 1856 | 8.83 | 589 | 553 | 147.6 |
| A | 0 | 29 | 1807 | 8.49 | 589 | 553 | 147.6 |
| A | 9 | 19 | 1777 | 8.29 | 589 | 553 | 147.6 |
| B | 2 | 9 | 1981 | 12.77 | 569 | 544 | 112.5 |
| B | 3 | 80 | 1744 | 10.66 | 569 | 544 | 112.5 |
| B | 2 | 8 | 1560 | 9.03 | 569 | 544 | 112.5 |
| C | 1 | 81 | 1914 | 8.85 | 596 | 561 | 152.9 |
| C | 1 | 80 | 1909 | 8.82 | 596 | 561 | 152.9 |
| C | 3 | 202 | 1758 | 7.83 | 596 | 561 | 152.9 |
| D | 4 | 160 | 1455 | 6.57 | 544 | 498 | 145.6 |
| D | 7 | 3 | 1372 | 6.0 | 544 | 498 | 145.6 |
| D | 10 | 113 | 1370 | 5.99 | 544 | 498 | 145.6 |
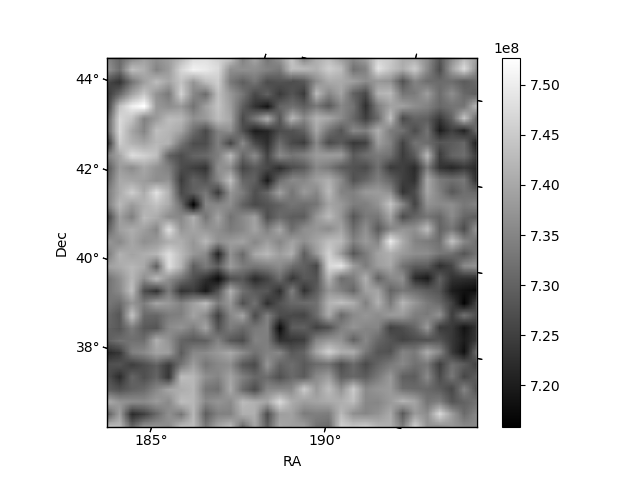
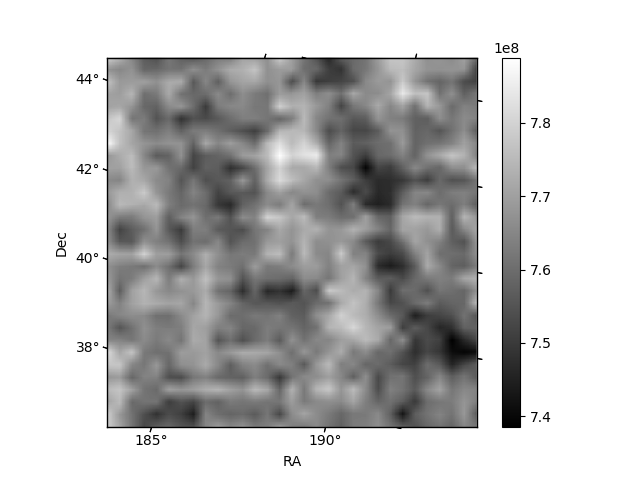
Histogram calculated using DETX and DETY for each event in the final _common_clean file
| Quadrant A |  |
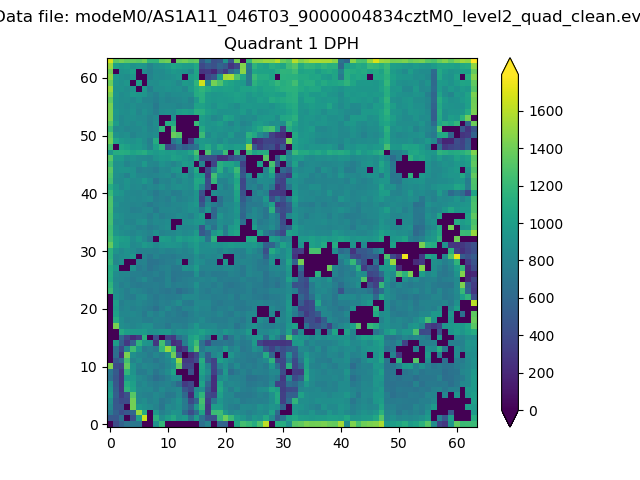 |
Quadrant B |
|---|---|---|---|
| Quadrant D | 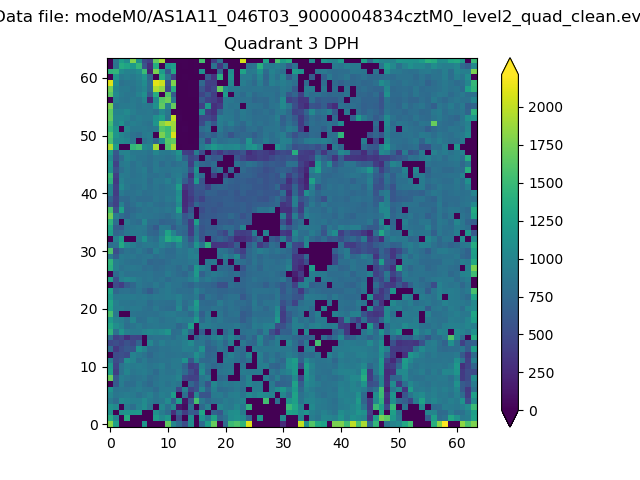 |
 |
Quadrant C |
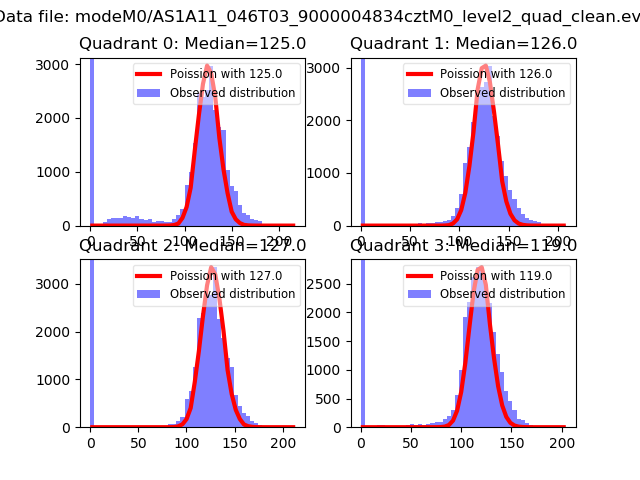
| Plot type | Count rate plots | Images |
|---|---|---|
| Comparison with Poisson distribution Blue bars denote a histogram of data divided into 1 sec bins. Red curve is a Poisson curve with rate = median count rate of data. |
 |
 |
| Quadrant-wise count rates Data is divided into 100 sec bins |
 |
|
| Module-wise count rates for Quadrant A Data is divided into 100 sec bins |
 |
 |
| Module-wise count rates for Quadrant B Data is divided into 100 sec bins |
 |
 |
| Module-wise count rates for Quadrant C Data is divided into 100 sec bins |
 |
 |
| Module-wise count rates for Quadrant D Data is divided into 100 sec bins |
 |
 |
| Parameter | Plot |
|---|---|
| CZT HV Monitor |  |
| D_VDD | 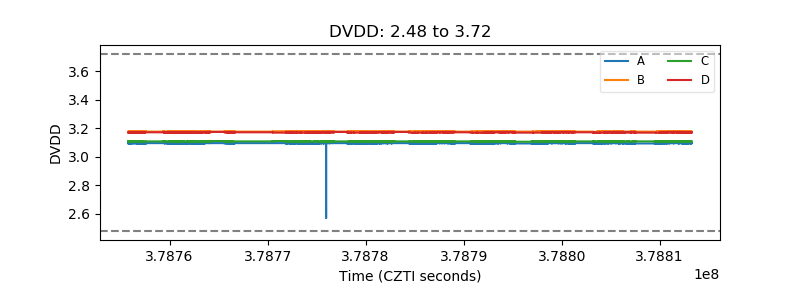 |
| Temperature 1 |  |
| Veto HV Monitor | 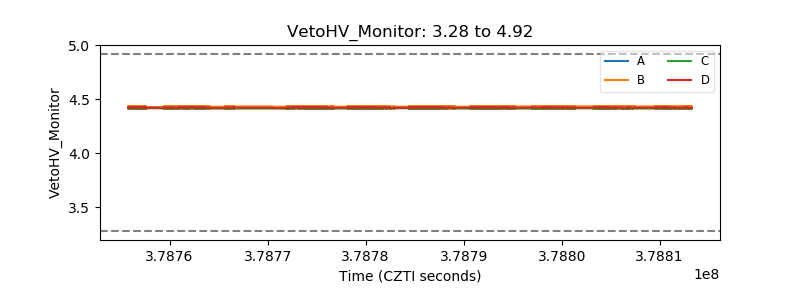 |
| Veto LLD | 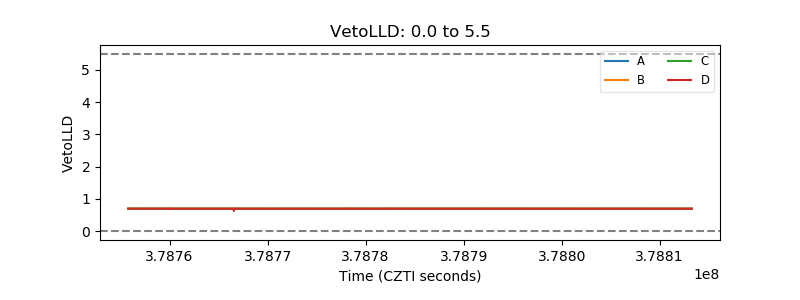 |
| Alpha Counter |  |
| _CPM_Rate |  |
| CZT Counter | 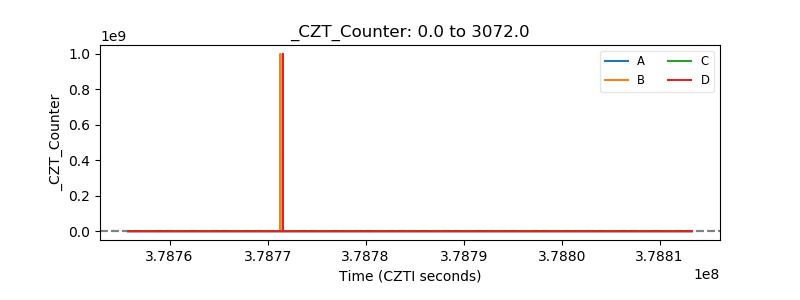 |
| +2.5 Volts monitor | 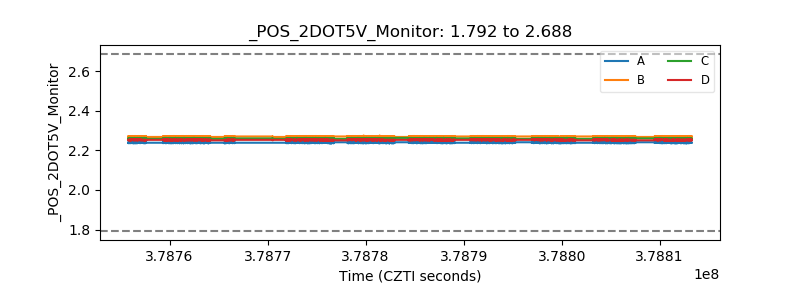 |
| +5 Volts monitor |  |
| _ROLL_ROT |  |
| _Roll_DEC | 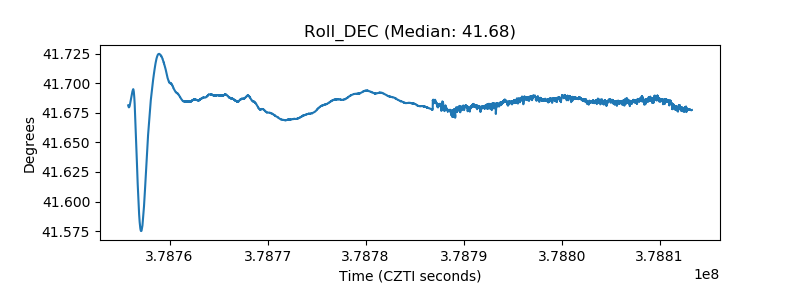 |
| _Roll_RA |  |
| Veto Counter | 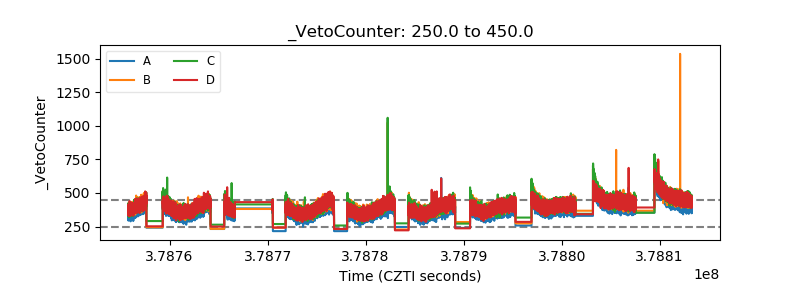 |