| Param | Original file | Final file |
|---|---|---|
| Filename | modeM0/AS1A11_046T03_9000004834_33861cztM0_level2.evt | modeM0/AS1A11_046T03_9000004834_33861cztM0_level2_quad_clean.evt |
| Size (bytes) | 219,634,560 | 42,292,800 |
| Size | 209.5 MB | 40.3 MB |
| Events in quadrant A | 1,282,367 | 277,035 |
| Events in quadrant B | 1,664,505 | 274,493 |
| Events in quadrant C | 1,453,861 | 278,616 |
| Events in quadrant D | 2,072,953 | 264,169 |
| Mode M9 | |||
|---|---|---|---|
| Quadrant | BADHDUFLAG | Total packets | Discarded packets |
| A | 0 | 16 | 0 |
| B | 0 | 16 | 0 |
| C | 0 | 16 | 0 |
| D | 0 | 16 | 0 |
| Mode M0 | |||
|---|---|---|---|
| Quadrant | BADHDUFLAG | Total packets | Discarded packets |
| A | 0 | 5306 | 2 |
| B | 0 | 6566 | 1 |
| C | 0 | 5803 | 1 |
| D | 0 | 7980 | 1 |
| Mode SS | |||
|---|---|---|---|
| Quadrant | BADHDUFLAG | Total packets | Discarded packets |
| A | 0 | 56 | 0 |
| B | 0 | 56 | 0 |
| C | 0 | 56 | 0 |
| D | 0 | 56 | 0 |
| Quadrant | Total seconds | Saturated seconds | Saturation percentage |
|---|---|---|---|
| A | 2587 | 9 | 0.347893% |
| B | 2587 | 116 | 4.483958% |
| C | 2587 | 49 | 1.894086% |
| D | 2587 | 33 | 1.275609% |
Noise dominated data is calculated using 1-second bins in cleaned event files. If a bin has >2000 counts, and if more than 50% of those come from <1% of pixels, then it is considered to be noise-dominated and hence unusable.
| Quadrant | # 1 sec bins | Bins with >0 counts | Bins with >2000 counts | High rate bins dominated by noise | Noise dominated (total time) | Noise dominated (detector-on time) | Marked lightcurve |
|---|---|---|---|---|---|---|---|
| A | 4261 | 2588 | 2 | 2 | 0.05% | 0.08% | 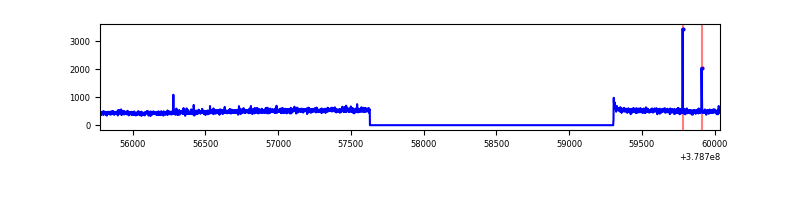 |
| B | 4261 | 2588 | 82 | 82 | 1.92% | 3.17% | 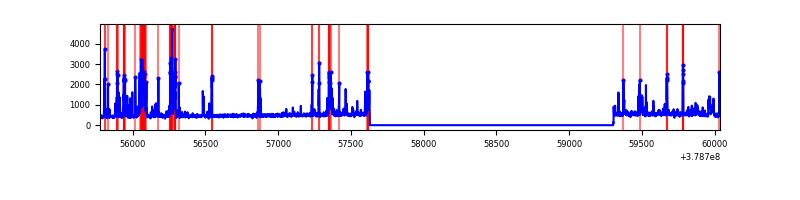 |
| C | 4261 | 2588 | 28 | 28 | 0.66% | 1.08% | 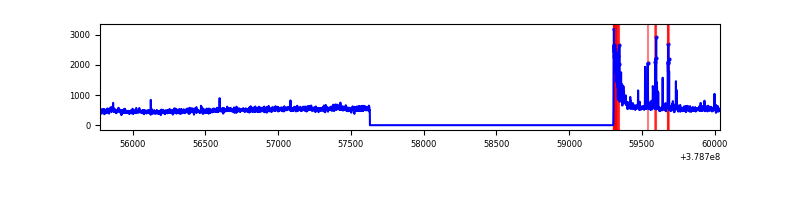 |
| D | 4261 | 2588 | 22 | 22 | 0.52% | 0.85% | 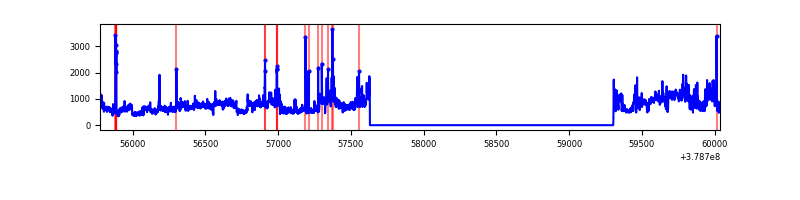 |
Top three noisy pixels from each quadrant. If the there are fewer than three noisy pixels in the level2.evt file, extra rows are filled as -1
| Pixel properties | Quadrant properties | ||||||
|---|---|---|---|---|---|---|---|
| Quadrant | DetID | PixID | Counts | Sigma | Mean | Median | Sigma |
| A | 15 | 169 | 64658 | 1020.95 | 309 | 303 | 63.0 |
| A | 10 | 83 | 5649 | 84.81 | 309 | 303 | 63.0 |
| A | 0 | 254 | 5313 | 79.48 | 309 | 303 | 63.0 |
| B | 5 | 172 | 301639 | 5088.25 | 300 | 293 | 59.2 |
| B | 0 | 229 | 62540 | 1051.05 | 300 | 293 | 59.2 |
| B | 4 | 232 | 33250 | 556.48 | 300 | 293 | 59.2 |
| C | 15 | 214 | 110790 | 1569.16 | 297 | 299 | 70.4 |
| C | 0 | 10 | 75755 | 1071.61 | 297 | 299 | 70.4 |
| C | 3 | 233 | 52342 | 739.1 | 297 | 299 | 70.4 |
| D | 8 | 195 | 624911 | 7822.22 | 295 | 289 | 79.9 |
| D | 1 | 52 | 60529 | 754.39 | 295 | 289 | 79.9 |
| D | 13 | 249 | 48466 | 603.33 | 295 | 289 | 79.9 |
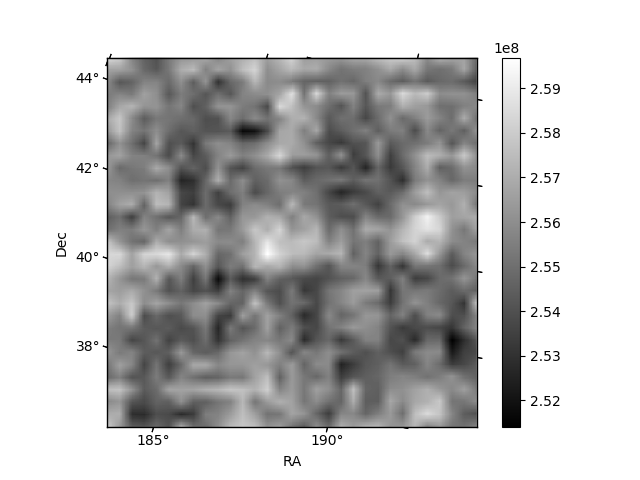
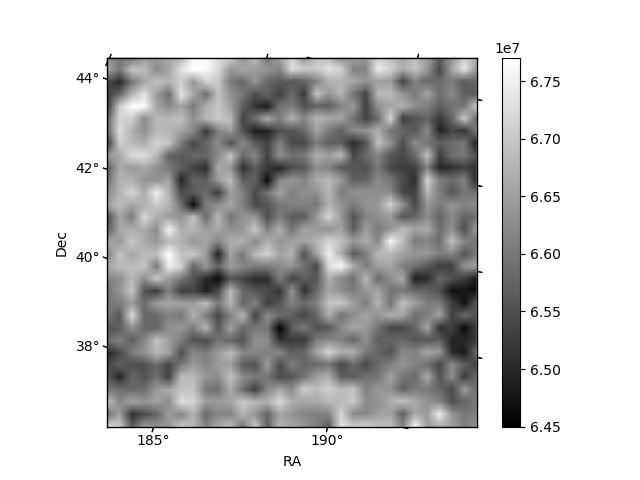
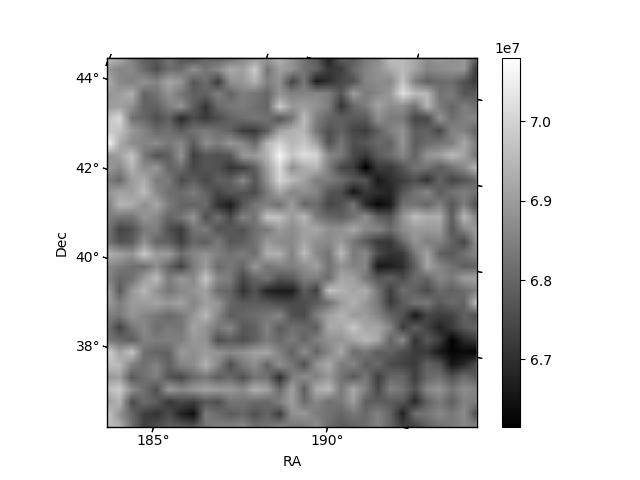
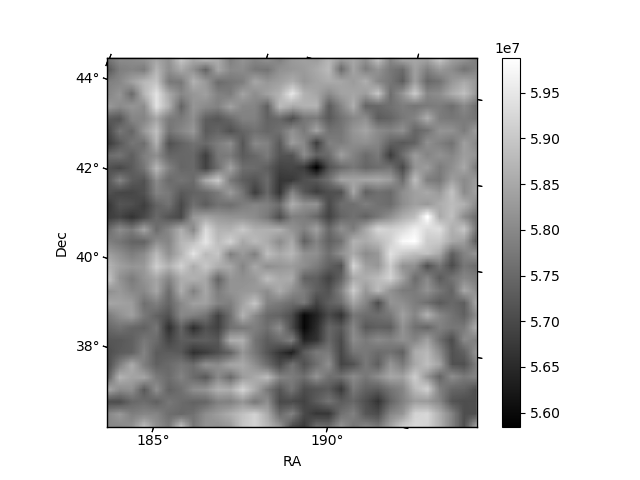
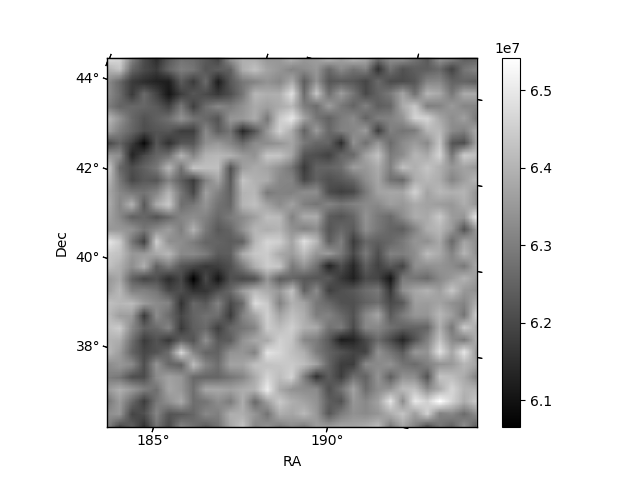
Histogram calculated using DETX and DETY for each event in the final _common_clean file
| Quadrant A | 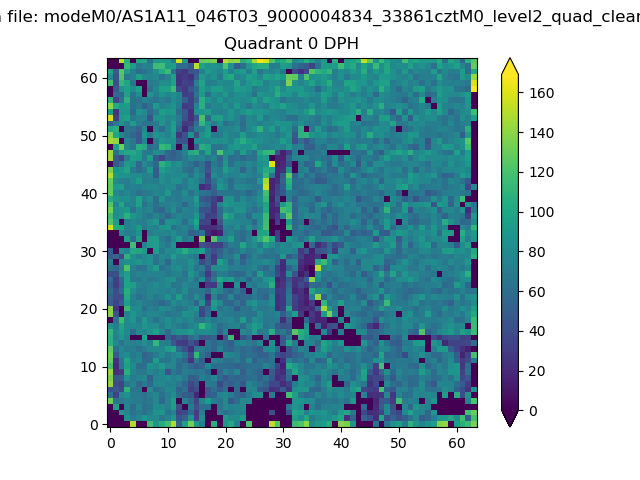 |
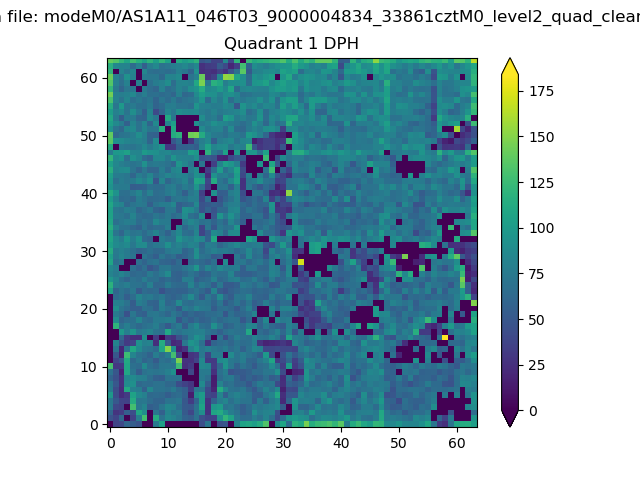 |
Quadrant B |
|---|---|---|---|
| Quadrant D | 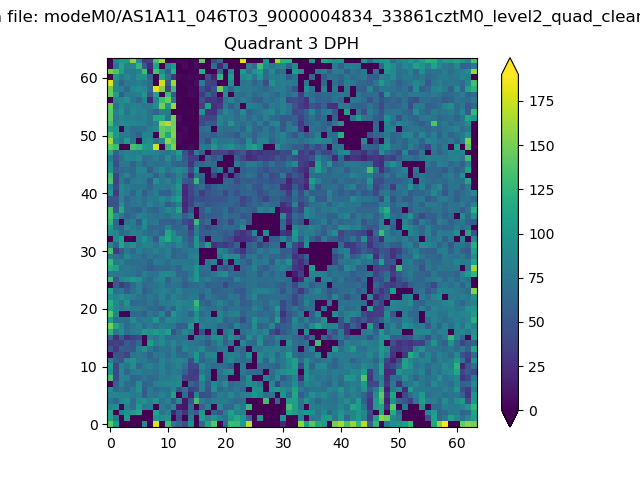 |
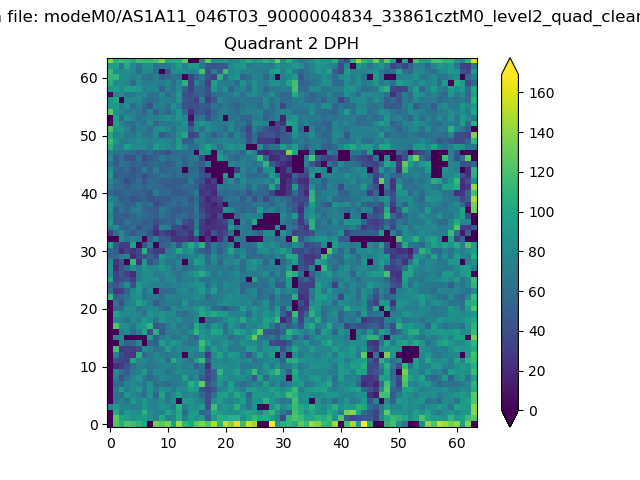 |
Quadrant C |
| Plot type | Count rate plots | Images |
|---|---|---|
| Comparison with Poisson distribution Blue bars denote a histogram of data divided into 1 sec bins. Red curve is a Poisson curve with rate = median count rate of data. |
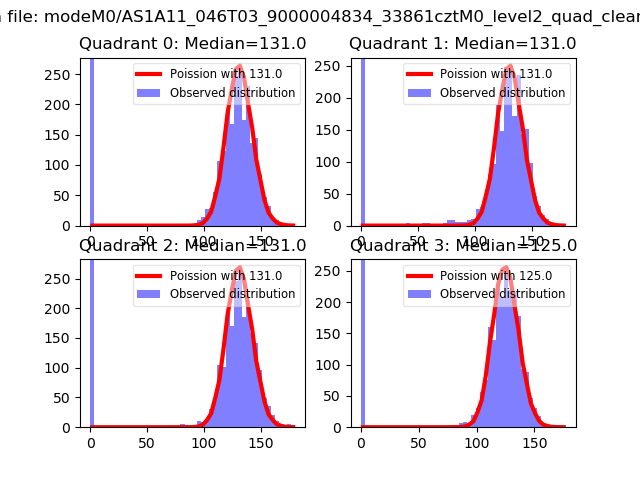 |
 |
| Quadrant-wise count rates Data is divided into 100 sec bins |
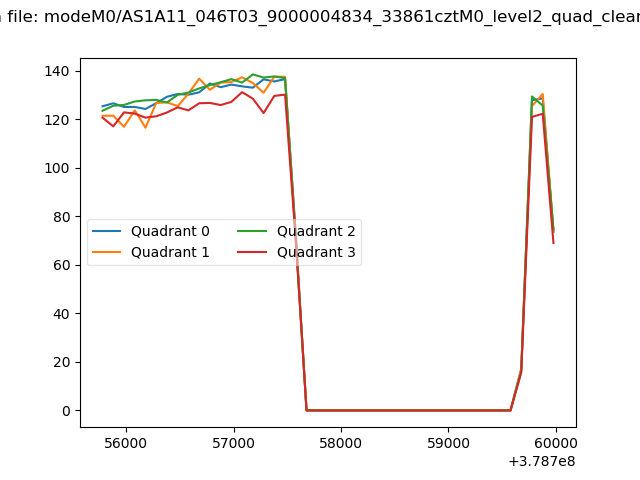 |
|
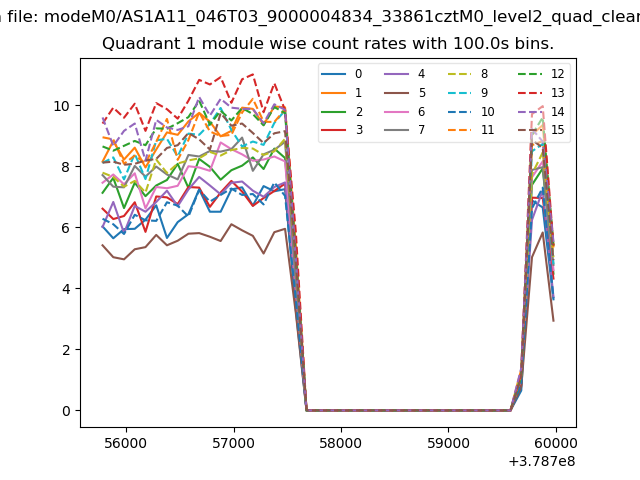
| Module-wise count rates for Quadrant A Data is divided into 100 sec bins |
 |
 |
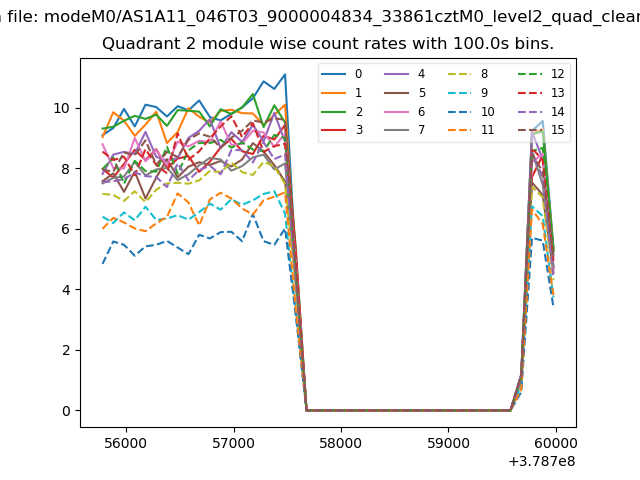
| Module-wise count rates for Quadrant B Data is divided into 100 sec bins |
 |
 |
| Module-wise count rates for Quadrant C Data is divided into 100 sec bins |
 |
 |
| Module-wise count rates for Quadrant D Data is divided into 100 sec bins |
 |
 |
| Parameter | Plot |
|---|---|
| CZT HV Monitor |  |
| D_VDD | 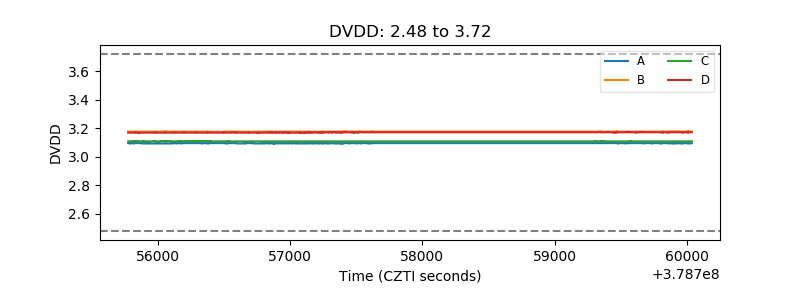 |
| Temperature 1 | 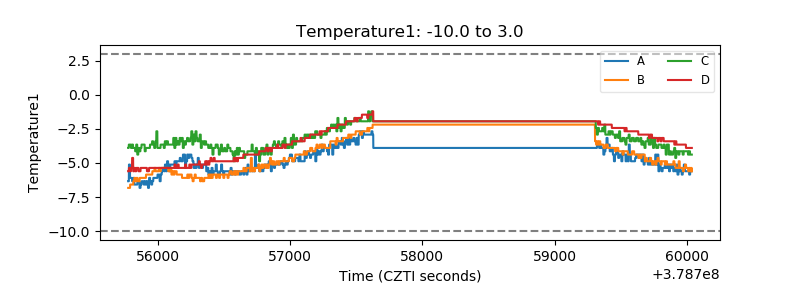 |
| Veto HV Monitor | 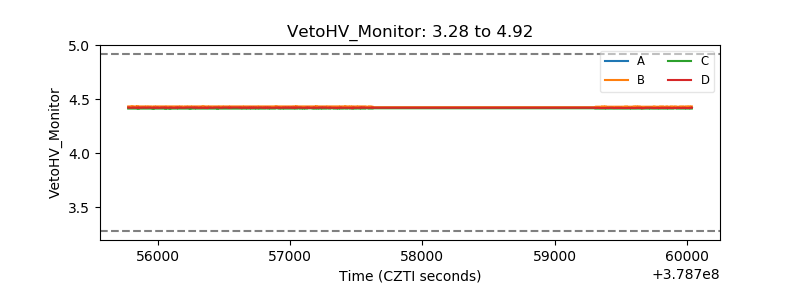 |
| Veto LLD |  |
| Alpha Counter | 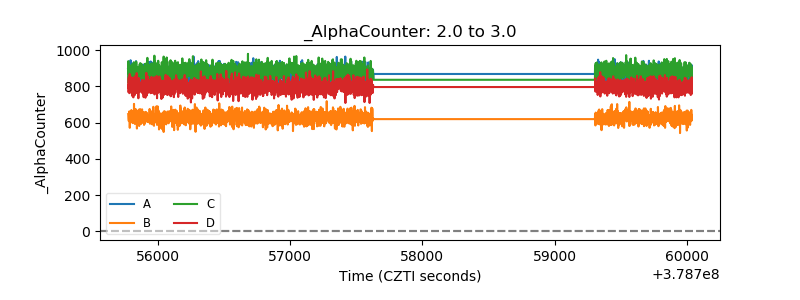 |
| _CPM_Rate | 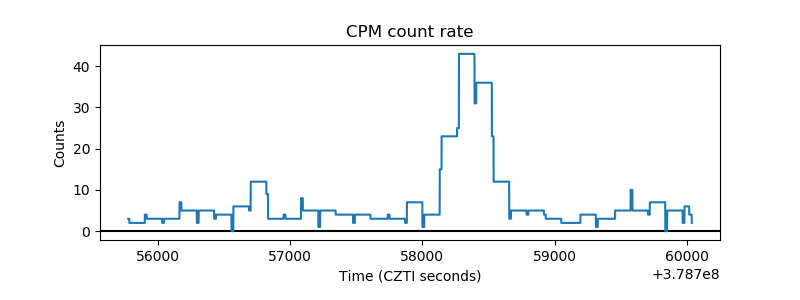 |
| CZT Counter | 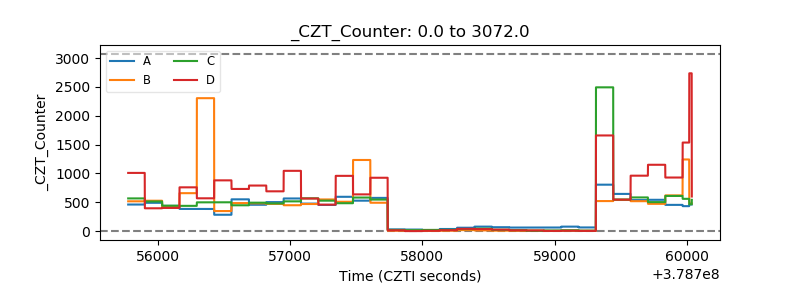 |
| +2.5 Volts monitor | 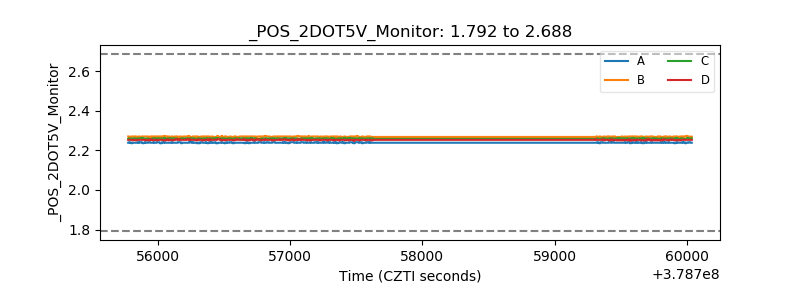 |
| +5 Volts monitor |  |
| _ROLL_ROT | 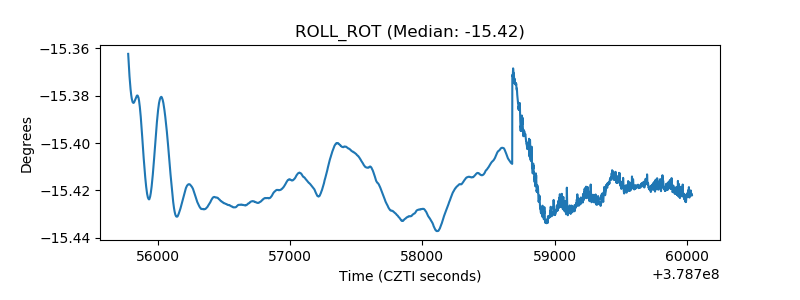 |
| _Roll_DEC | 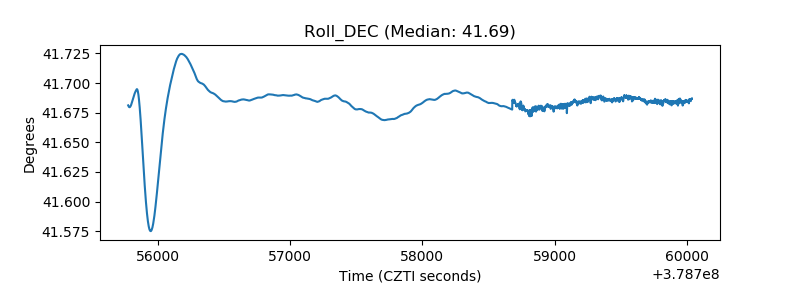 |
| _Roll_RA | 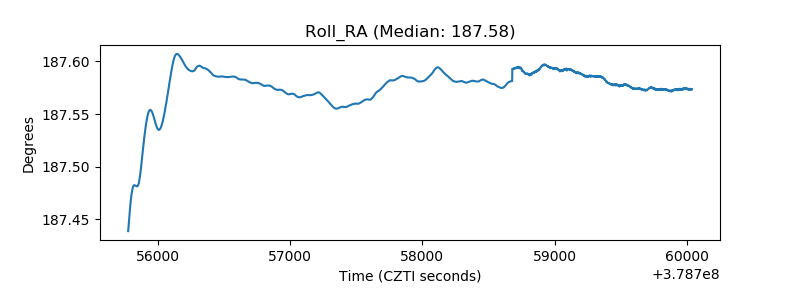 |
| Veto Counter | 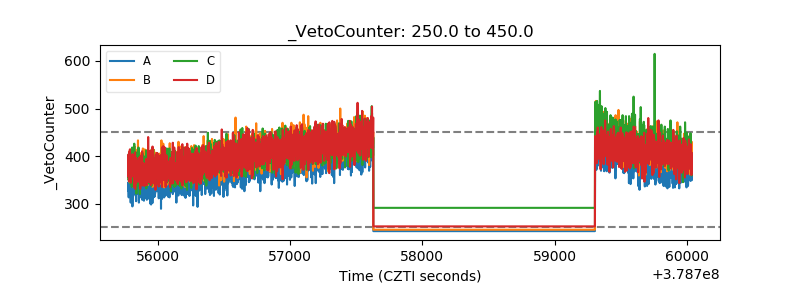 |