| Param | Original file | Final file |
|---|---|---|
| Filename | modeM0/AS1A11_046T03_9000004834_33862cztM0_level2.evt | modeM0/AS1A11_046T03_9000004834_33862cztM0_level2_quad_clean.evt |
| Size (bytes) | 512,781,120 | 91,212,480 |
| Size | 489.0 MB | 87.0 MB |
| Events in quadrant A | 2,768,517 | 601,391 |
| Events in quadrant B | 4,450,888 | 577,641 |
| Events in quadrant C | 3,160,730 | 604,804 |
| Events in quadrant D | 4,755,212 | 571,753 |
| Mode M9 | |||
|---|---|---|---|
| Quadrant | BADHDUFLAG | Total packets | Discarded packets |
| A | 0 | 30 | 0 |
| B | 0 | 30 | 0 |
| C | 0 | 30 | 0 |
| D | 0 | 30 | 0 |
| Mode M0 | |||
|---|---|---|---|
| Quadrant | BADHDUFLAG | Total packets | Discarded packets |
| A | 0 | 11878 | 3 |
| B | 0 | 17040 | 2 |
| C | 0 | 12805 | 2 |
| D | 0 | 18209 | 2 |
| Mode SS | |||
|---|---|---|---|
| Quadrant | BADHDUFLAG | Total packets | Discarded packets |
| A | 0 | 122 | 0 |
| B | 0 | 122 | 0 |
| C | 0 | 122 | 0 |
| D | 0 | 122 | 0 |
| Quadrant | Total seconds | Saturated seconds | Saturation percentage |
|---|---|---|---|
| A | 5811 | 10 | 0.172087% |
| B | 5811 | 508 | 8.742041% |
| C | 5811 | 85 | 1.462743% |
| D | 5811 | 145 | 2.495268% |
Noise dominated data is calculated using 1-second bins in cleaned event files. If a bin has >2000 counts, and if more than 50% of those come from <1% of pixels, then it is considered to be noise-dominated and hence unusable.
| Quadrant | # 1 sec bins | Bins with >0 counts | Bins with >2000 counts | High rate bins dominated by noise | Noise dominated (total time) | Noise dominated (detector-on time) | Marked lightcurve |
|---|---|---|---|---|---|---|---|
| A | 8887 | 5813 | 3 | 3 | 0.03% | 0.05% | 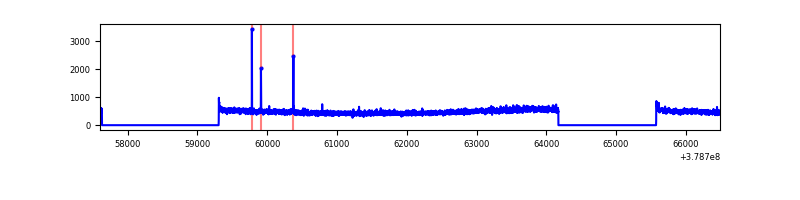 |
| B | 8887 | 5813 | 362 | 362 | 4.07% | 6.23% | 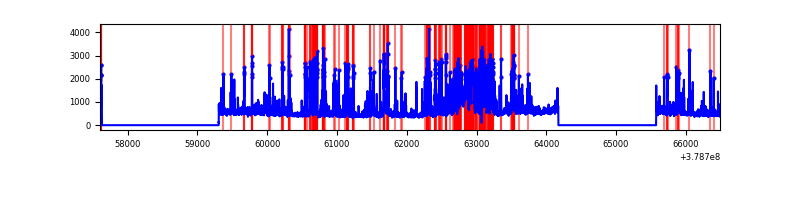 |
| C | 8887 | 5813 | 56 | 56 | 0.63% | 0.96% | 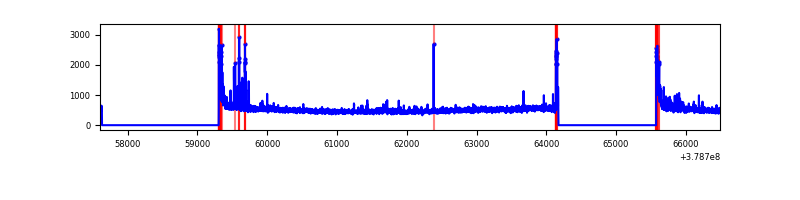 |
| D | 8887 | 5813 | 107 | 107 | 1.20% | 1.84% | 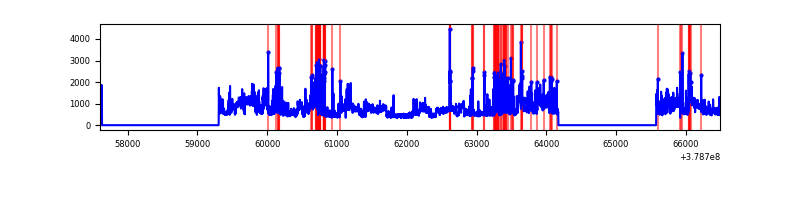 |
Top three noisy pixels from each quadrant. If the there are fewer than three noisy pixels in the level2.evt file, extra rows are filled as -1
| Pixel properties | Quadrant properties | ||||||
|---|---|---|---|---|---|---|---|
| Quadrant | DetID | PixID | Counts | Sigma | Mean | Median | Sigma |
| A | 15 | 169 | 123397 | 909.41 | 670 | 655 | 135.0 |
| A | 13 | 6 | 27912 | 201.95 | 670 | 655 | 135.0 |
| A | 10 | 83 | 11541 | 80.66 | 670 | 655 | 135.0 |
| B | 5 | 172 | 1533982 | 12288.03 | 648 | 630 | 124.8 |
| B | 0 | 229 | 128439 | 1024.24 | 648 | 630 | 124.8 |
| B | 4 | 232 | 38429 | 302.92 | 648 | 630 | 124.8 |
| C | 15 | 214 | 249546 | 1637.64 | 653 | 657 | 152.0 |
| C | 0 | 10 | 168405 | 1103.75 | 653 | 657 | 152.0 |
| C | 9 | 187 | 88446 | 577.63 | 653 | 657 | 152.0 |
| D | 8 | 195 | 1242448 | 7010.84 | 644 | 632 | 177.1 |
| D | 2 | 250 | 304330 | 1714.57 | 644 | 632 | 177.1 |
| D | 10 | 118 | 161154 | 906.25 | 644 | 632 | 177.1 |
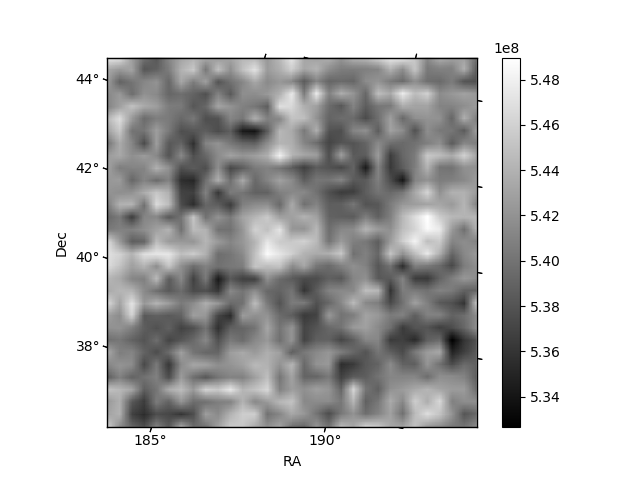
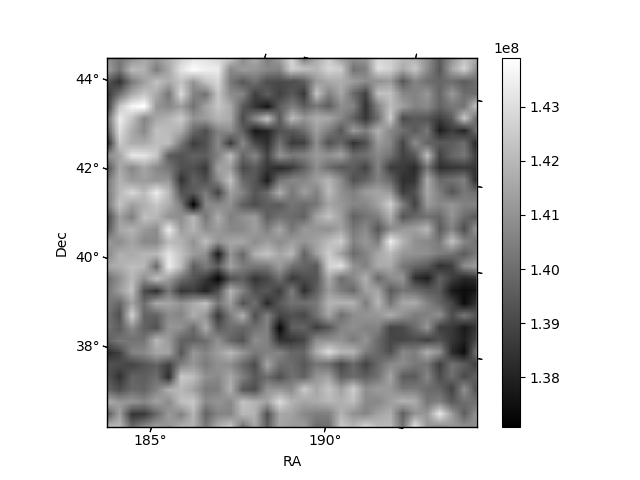
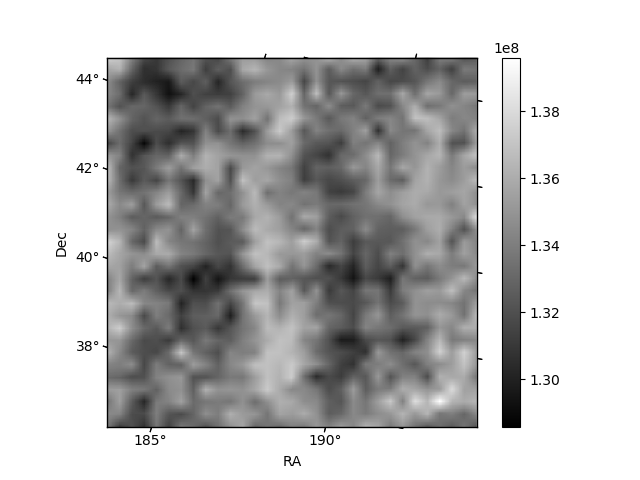
Histogram calculated using DETX and DETY for each event in the final _common_clean file
| Quadrant A |  |
 |
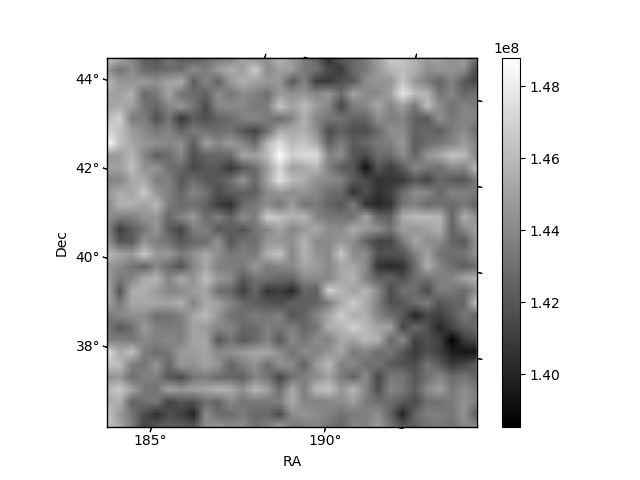
Quadrant B |
|---|---|---|---|
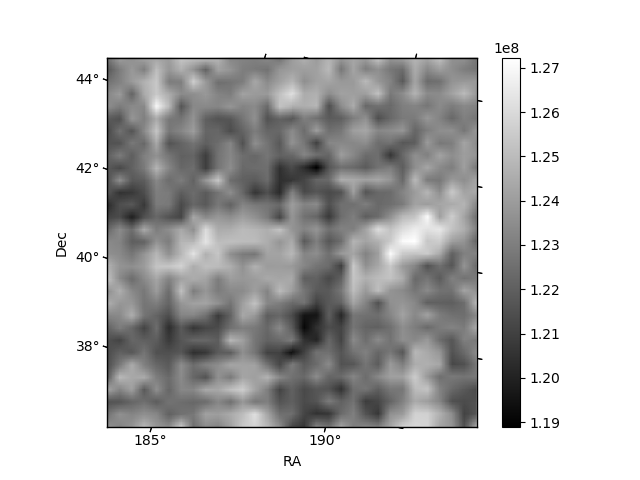
| Quadrant D |  |
 |
Quadrant C |
| Plot type | Count rate plots | Images |
|---|---|---|
| Comparison with Poisson distribution Blue bars denote a histogram of data divided into 1 sec bins. Red curve is a Poisson curve with rate = median count rate of data. |
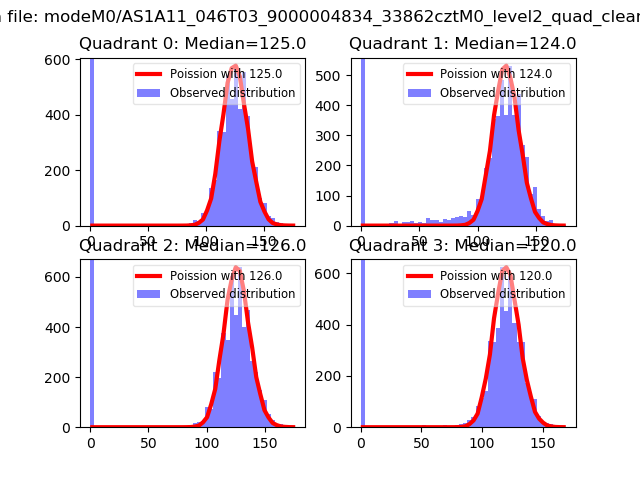 |
 |
| Quadrant-wise count rates Data is divided into 100 sec bins |
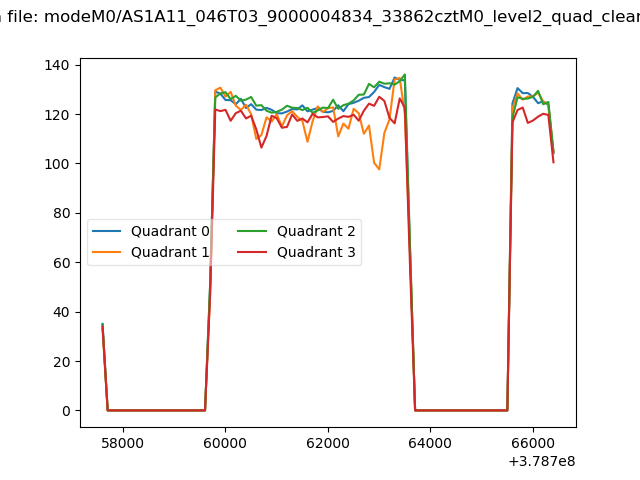 |
|
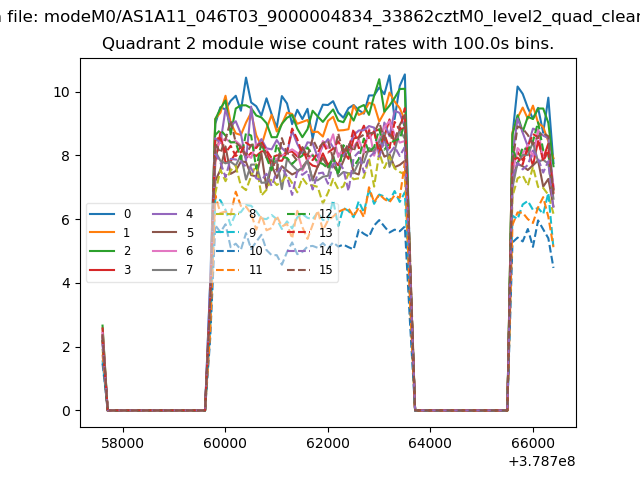
| Module-wise count rates for Quadrant A Data is divided into 100 sec bins |
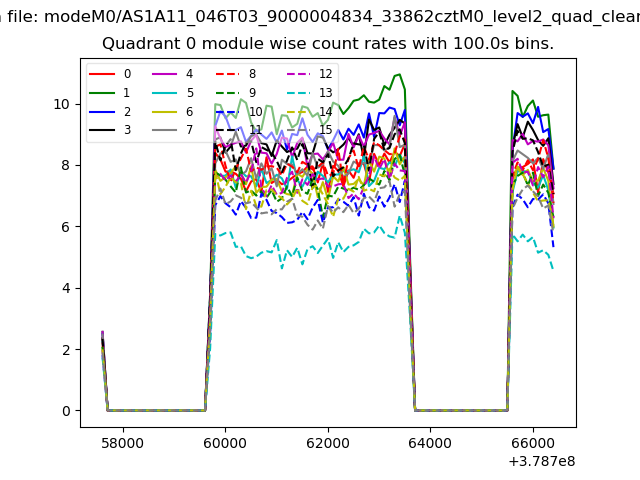 |
 |
| Module-wise count rates for Quadrant B Data is divided into 100 sec bins |
 |
 |
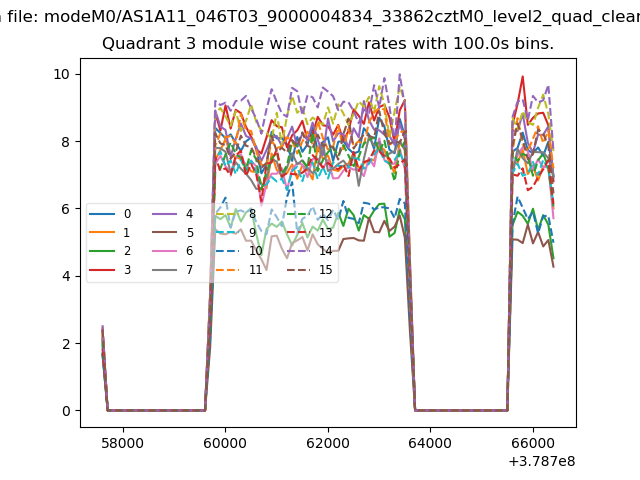
| Module-wise count rates for Quadrant C Data is divided into 100 sec bins |
 |
 |
| Module-wise count rates for Quadrant D Data is divided into 100 sec bins |
 |
 |
| Parameter | Plot |
|---|---|
| CZT HV Monitor |  |
| D_VDD | 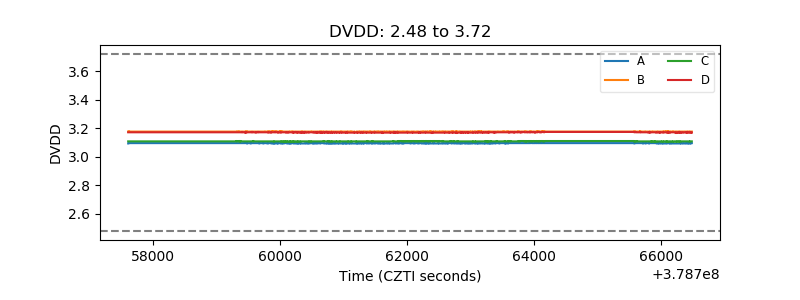 |
| Temperature 1 | 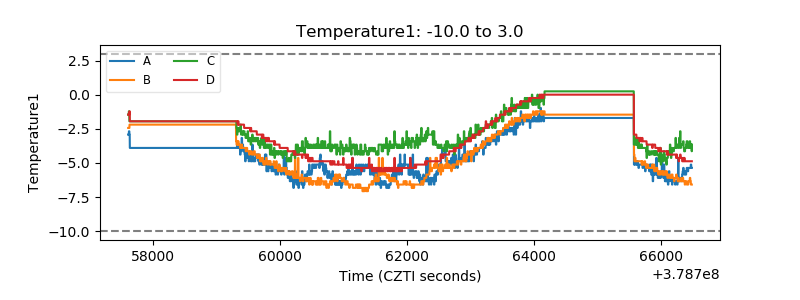 |
| Veto HV Monitor | 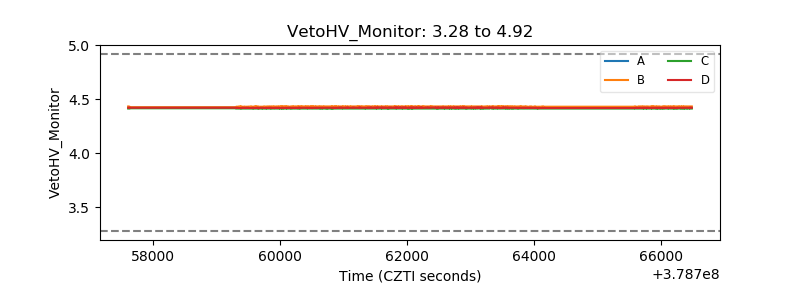 |
| Veto LLD | 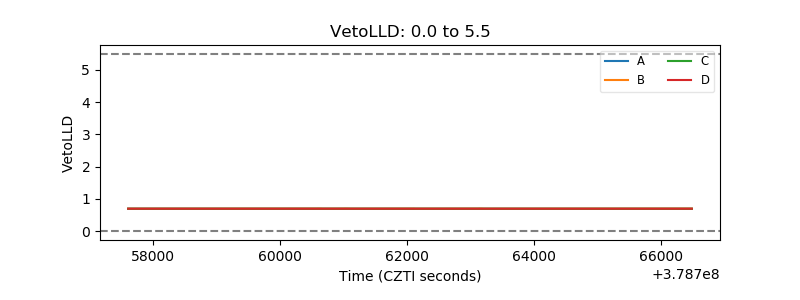 |
| Alpha Counter | 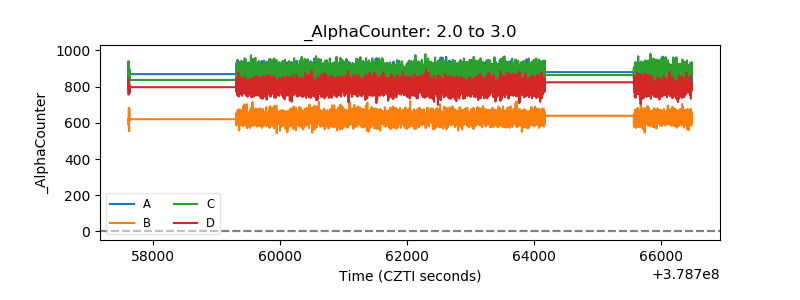 |
| _CPM_Rate | 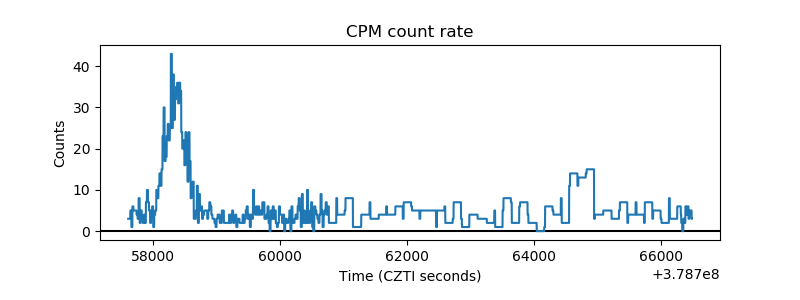 |
| CZT Counter | 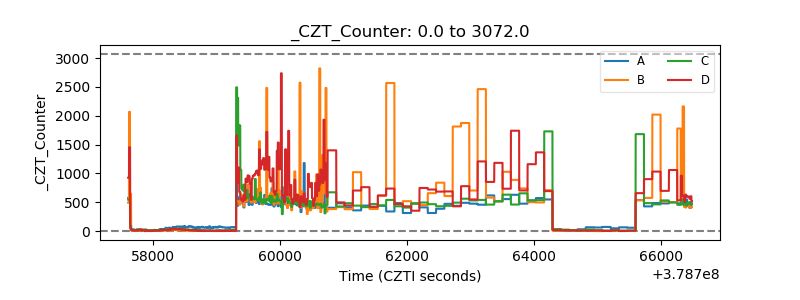 |
| +2.5 Volts monitor |  |
| +5 Volts monitor |  |
| _ROLL_ROT | 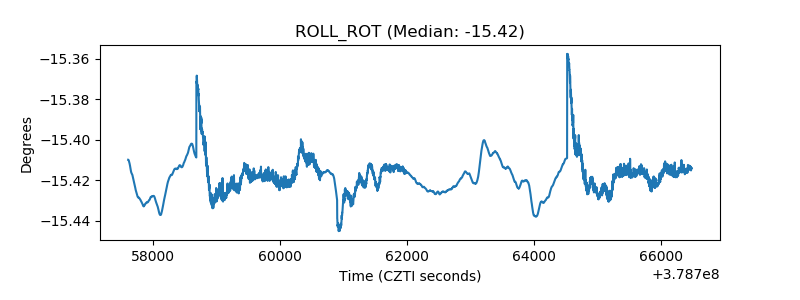 |
| _Roll_DEC | 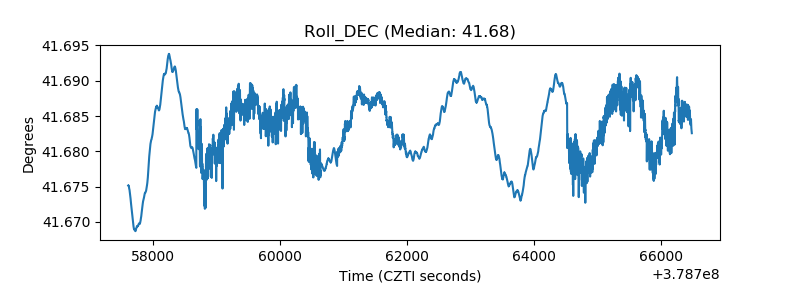 |
| _Roll_RA | 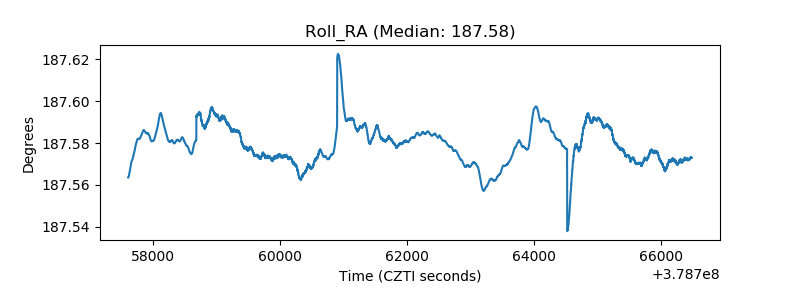 |
| Veto Counter | 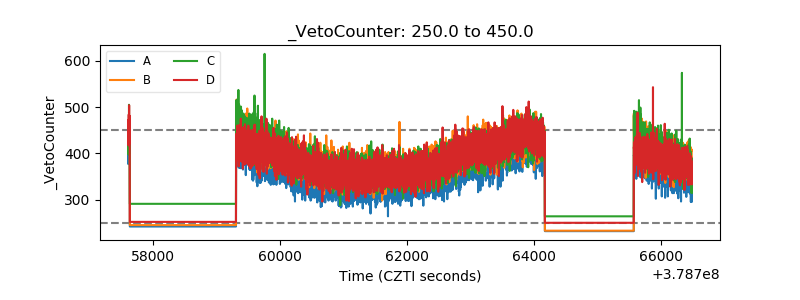 |