| Param | Original file | Final file |
|---|---|---|
| Filename | modeM0/AS1A11_046T03_9000004834_33866cztM0_level2.evt | modeM0/AS1A11_046T03_9000004834_33866cztM0_level2_quad_clean.evt |
| Size (bytes) | 1,465,810,560 | 206,712,000 |
| Size | 1.4 GB | 197.1 MB |
| Events in quadrant A | 11,549,369 | 1,190,029 |
| Events in quadrant B | 9,080,645 | 1,344,874 |
| Events in quadrant C | 8,574,576 | 1,344,624 |
| Events in quadrant D | 14,087,386 | 1,254,591 |
| Mode M9 | |||
|---|---|---|---|
| Quadrant | BADHDUFLAG | Total packets | Discarded packets |
| A | 0 | 55 | 0 |
| B | 0 | 55 | 0 |
| C | 0 | 55 | 0 |
| D | 0 | 55 | 0 |
| Mode M0 | |||
|---|---|---|---|
| Quadrant | BADHDUFLAG | Total packets | Discarded packets |
| A | 0 | 45378 | 5 |
| B | 0 | 37940 | 4 |
| C | 0 | 35624 | 4 |
| D | 0 | 53349 | 8 |
| Mode SS | |||
|---|---|---|---|
| Quadrant | BADHDUFLAG | Total packets | Discarded packets |
| A | 0 | 336 | 0 |
| B | 0 | 336 | 0 |
| C | 0 | 336 | 0 |
| D | 0 | 336 | 0 |
| Quadrant | Total seconds | Saturated seconds | Saturation percentage |
|---|---|---|---|
| A | 16312 | 2118 | 12.984306% |
| B | 16312 | 415 | 2.544139% |
| C | 16312 | 119 | 0.729524% |
| D | 16311 | 874 | 5.358347% |
Noise dominated data is calculated using 1-second bins in cleaned event files. If a bin has >2000 counts, and if more than 50% of those come from <1% of pixels, then it is considered to be noise-dominated and hence unusable.
| Quadrant | # 1 sec bins | Bins with >0 counts | Bins with >2000 counts | High rate bins dominated by noise | Noise dominated (total time) | Noise dominated (detector-on time) | Marked lightcurve |
|---|---|---|---|---|---|---|---|
| A | 25734 | 16317 | 1614 | 1614 | 6.27% | 9.89% | 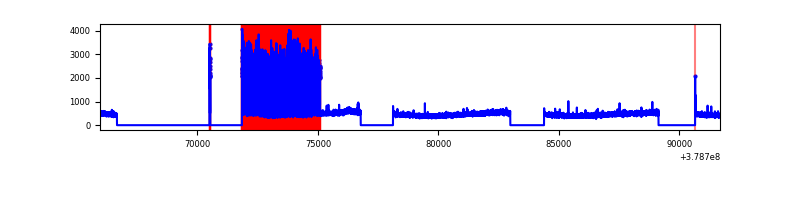 |
| B | 25734 | 16317 | 233 | 233 | 0.91% | 1.43% | 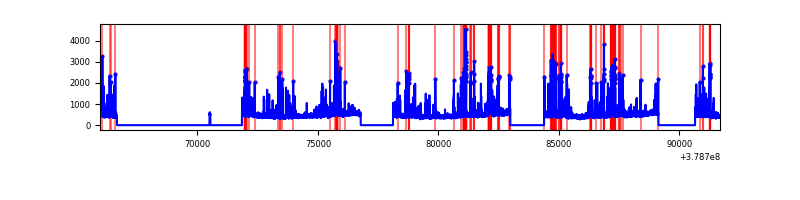 |
| C | 25734 | 16317 | 76 | 76 | 0.30% | 0.47% | 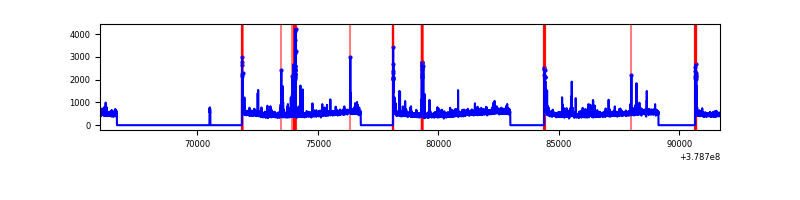 |
| D | 25734 | 16316 | 676 | 676 | 2.63% | 4.14% | 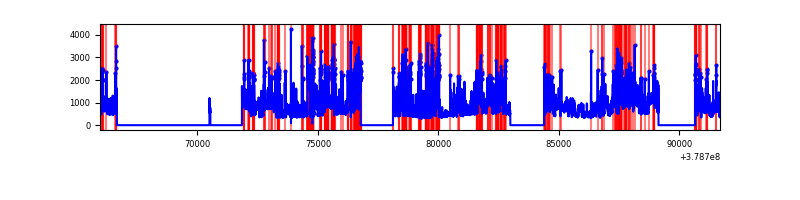 |
Top three noisy pixels from each quadrant. If the there are fewer than three noisy pixels in the level2.evt file, extra rows are filled as -1
| Pixel properties | Quadrant properties | ||||||
|---|---|---|---|---|---|---|---|
| Quadrant | DetID | PixID | Counts | Sigma | Mean | Median | Sigma |
| A | 15 | 169 | 4757253 | 13650.61 | 1743 | 1707 | 348.4 |
| A | 13 | 6 | 41229 | 113.44 | 1743 | 1707 | 348.4 |
| A | 13 | 254 | 25176 | 67.37 | 1743 | 1707 | 348.4 |
| B | 5 | 172 | 1102923 | 3163.36 | 1838 | 1789 | 348.1 |
| B | 15 | 222 | 213476 | 608.14 | 1838 | 1789 | 348.1 |
| B | 4 | 251 | 136969 | 388.35 | 1838 | 1789 | 348.1 |
| C | 15 | 214 | 692332 | 1668.7 | 1808 | 1825 | 413.8 |
| C | 9 | 187 | 298964 | 718.07 | 1808 | 1825 | 413.8 |
| C | 0 | 10 | 252644 | 606.14 | 1808 | 1825 | 413.8 |
| D | 8 | 195 | 3803827 | 8775.78 | 1776 | 1728 | 433.2 |
| D | 13 | 249 | 1214060 | 2798.23 | 1776 | 1728 | 433.2 |
| D | 2 | 250 | 645372 | 1485.62 | 1776 | 1728 | 433.2 |
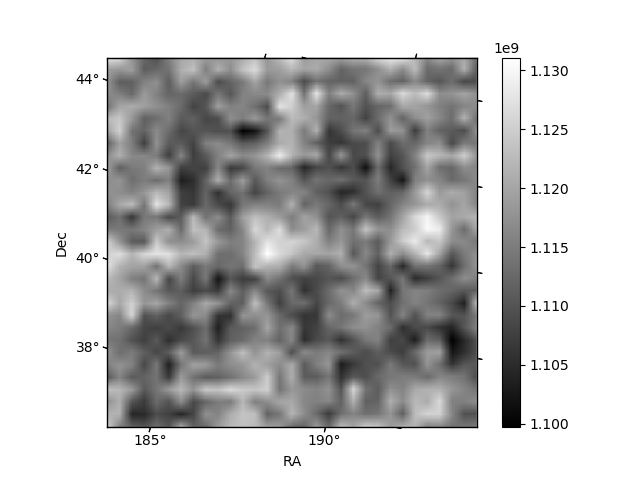
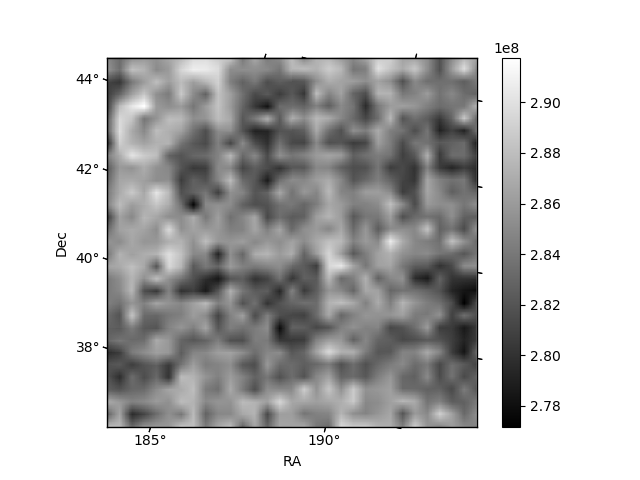
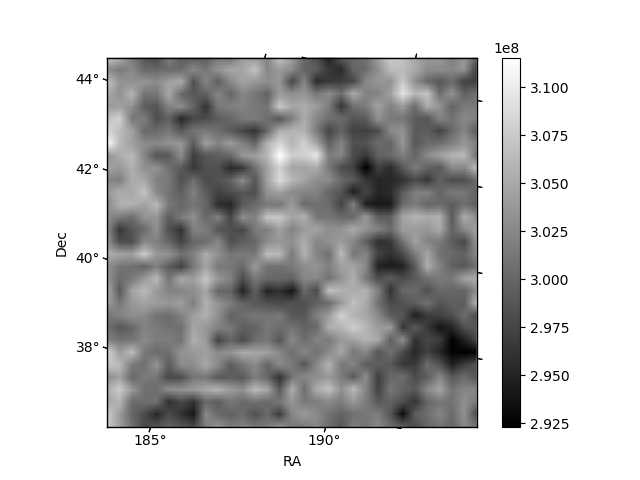
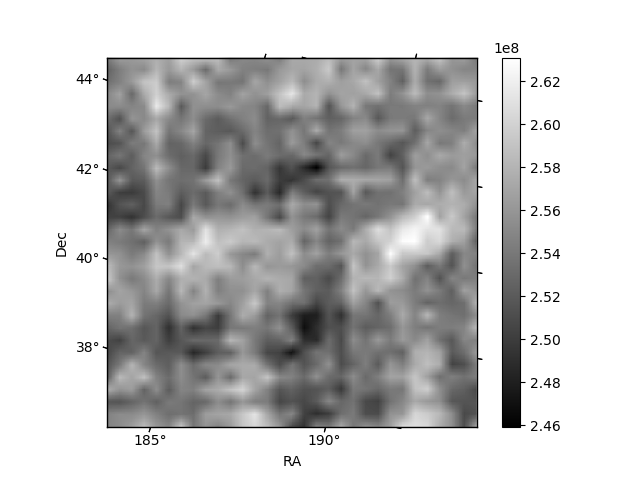
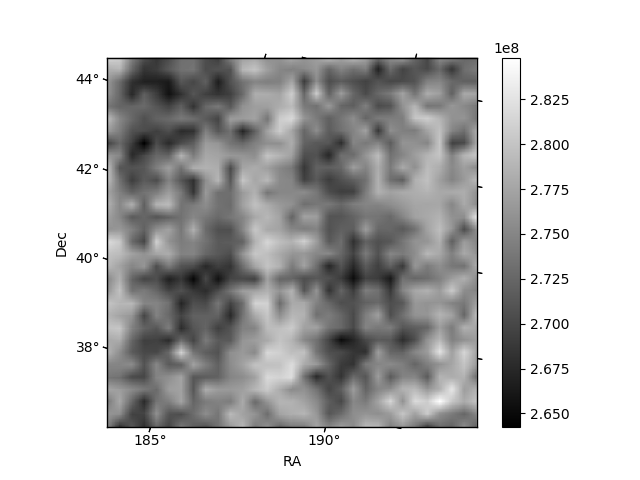
Histogram calculated using DETX and DETY for each event in the final _common_clean file
| Quadrant A | 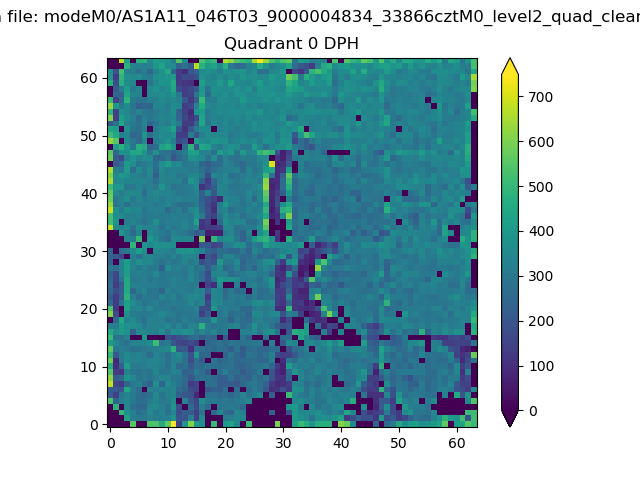 |
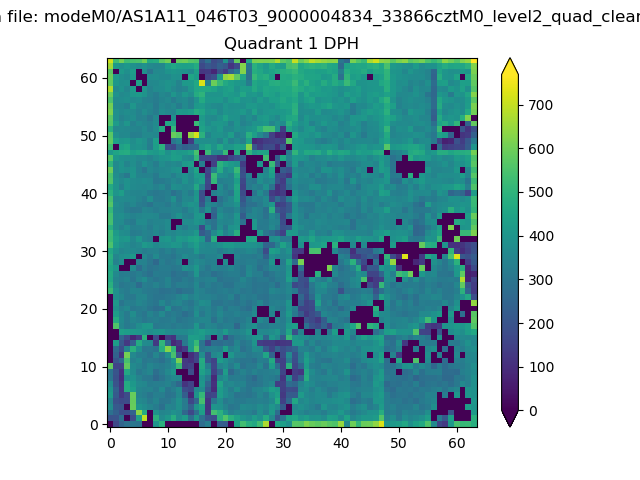 |
Quadrant B |
|---|---|---|---|
| Quadrant D | 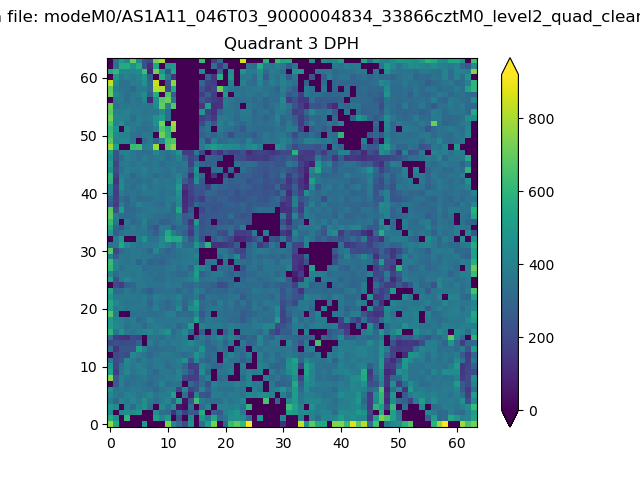 |
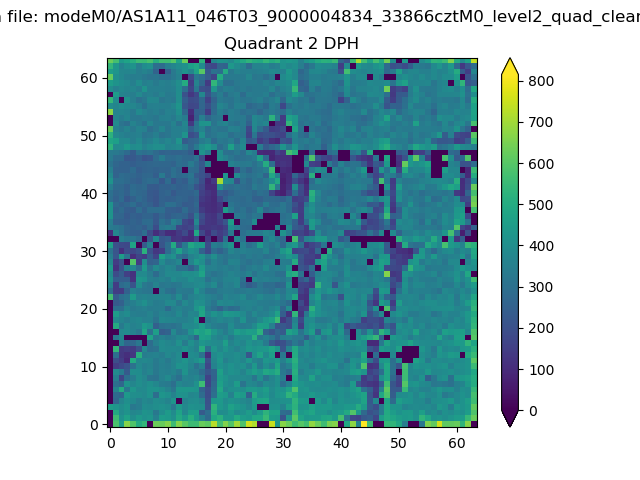 |
Quadrant C |
| Plot type | Count rate plots | Images |
|---|---|---|
| Comparison with Poisson distribution Blue bars denote a histogram of data divided into 1 sec bins. Red curve is a Poisson curve with rate = median count rate of data. |
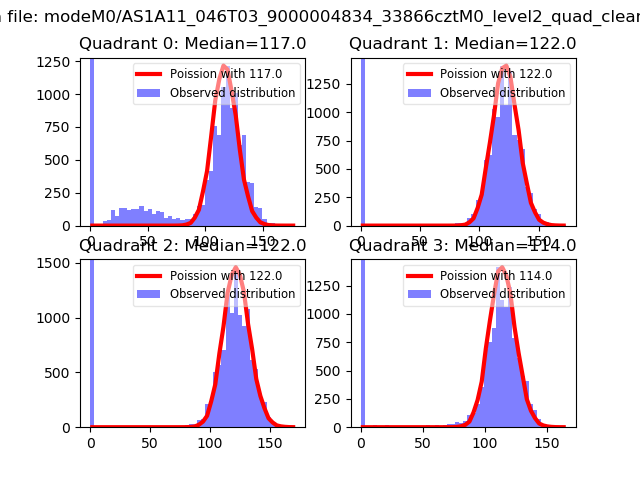 |
 |
| Quadrant-wise count rates Data is divided into 100 sec bins |
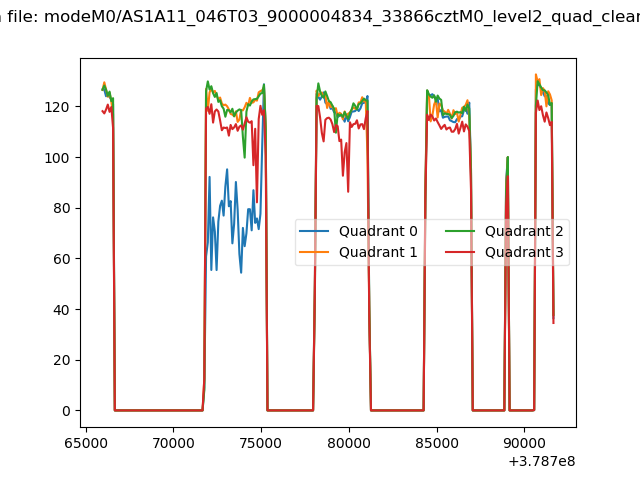 |
|
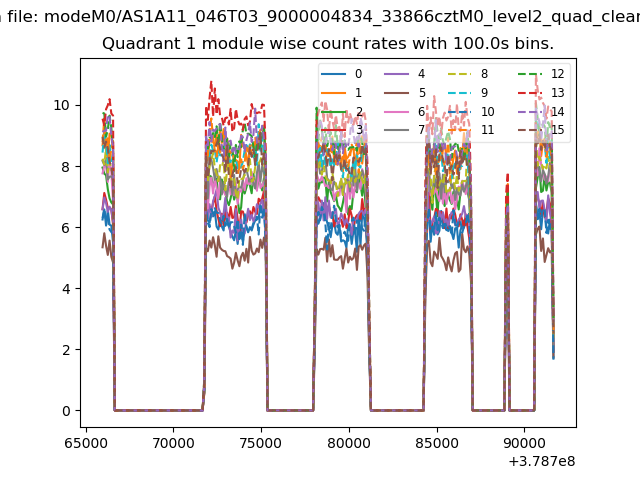
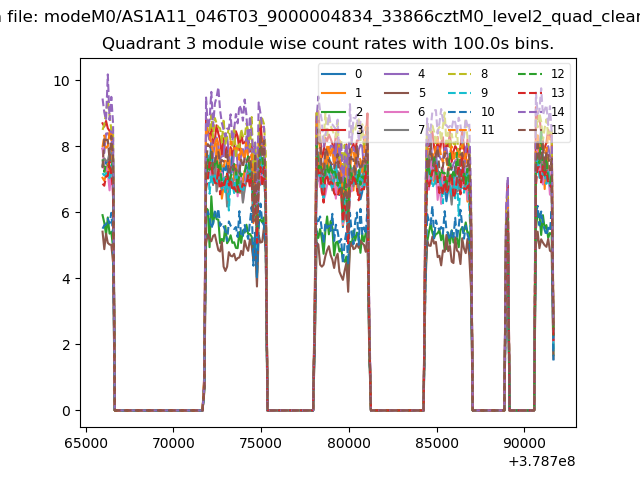
| Module-wise count rates for Quadrant A Data is divided into 100 sec bins |
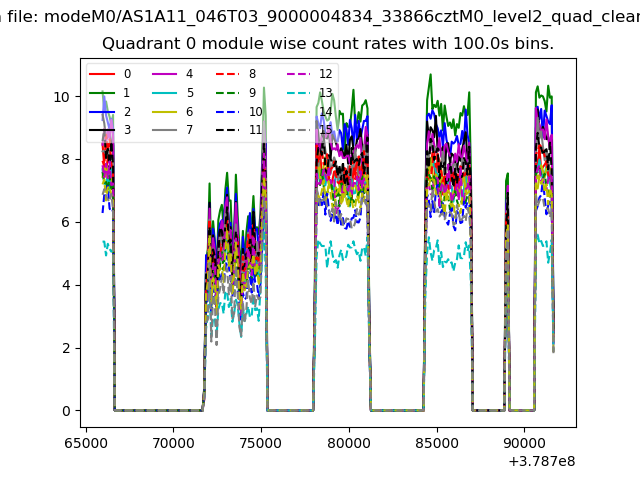 |
 |
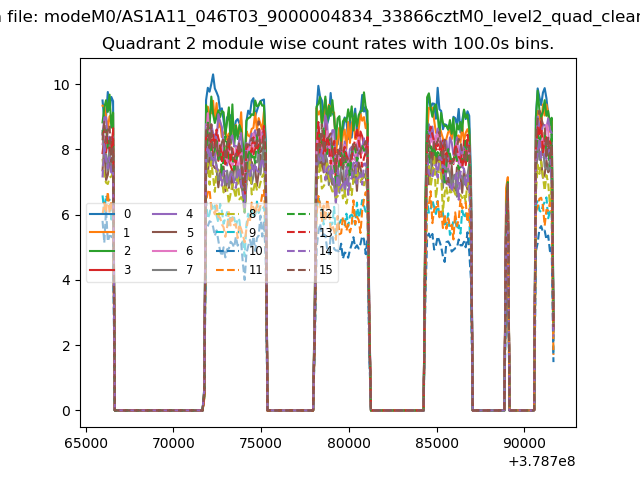
| Module-wise count rates for Quadrant B Data is divided into 100 sec bins |
 |
 |
| Module-wise count rates for Quadrant C Data is divided into 100 sec bins |
 |
 |
| Module-wise count rates for Quadrant D Data is divided into 100 sec bins |
 |
 |
| Parameter | Plot |
|---|---|
| CZT HV Monitor | 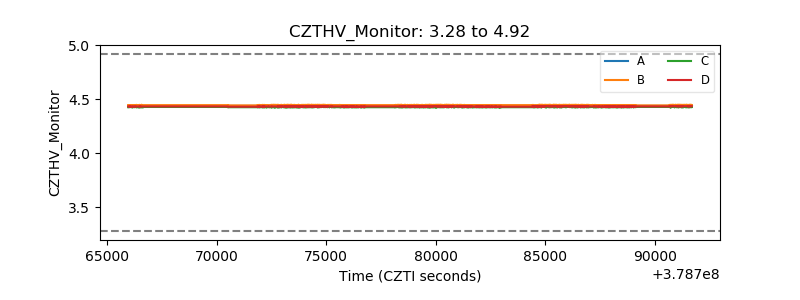 |
| D_VDD | 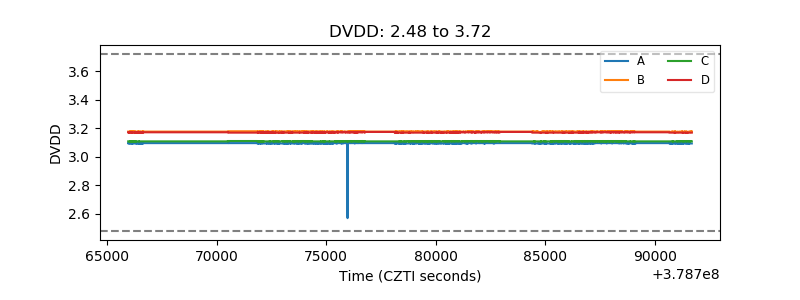 |
| Temperature 1 | 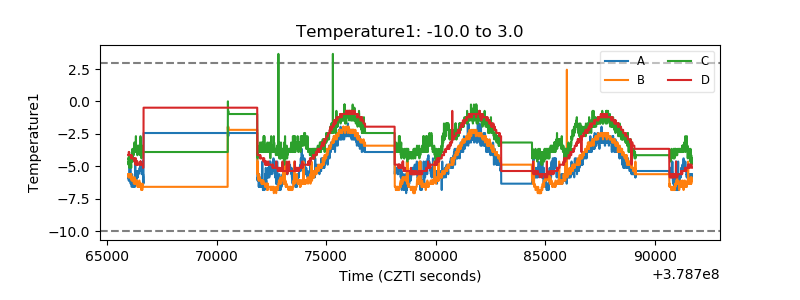 |
| Veto HV Monitor | 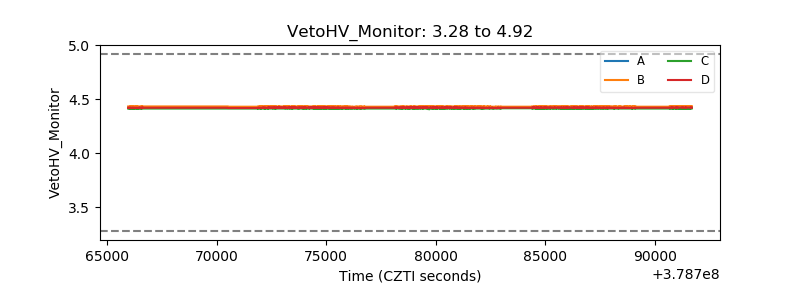 |
| Veto LLD | 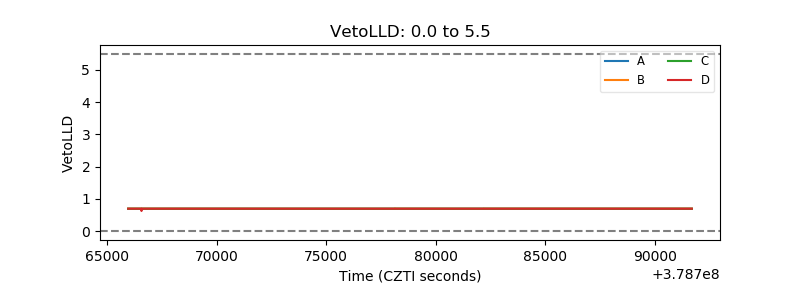 |
| Alpha Counter | 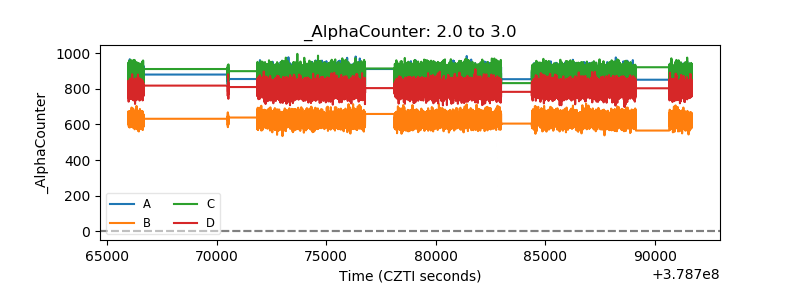 |
| _CPM_Rate | 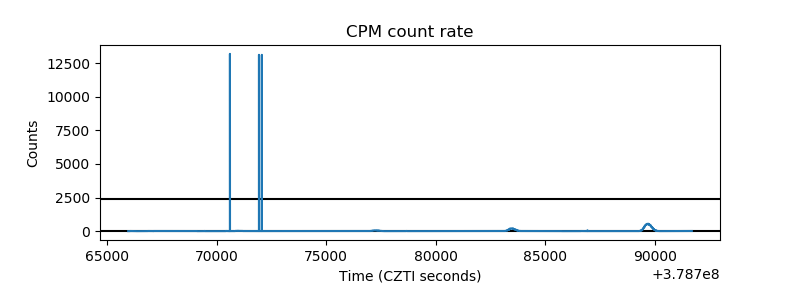 |
| CZT Counter | 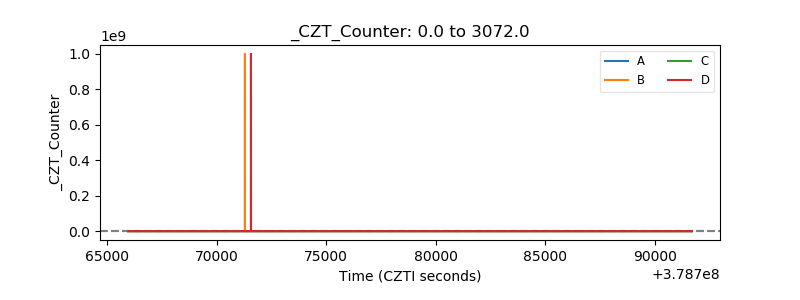 |
| +2.5 Volts monitor |  |
| +5 Volts monitor |  |
| _ROLL_ROT | 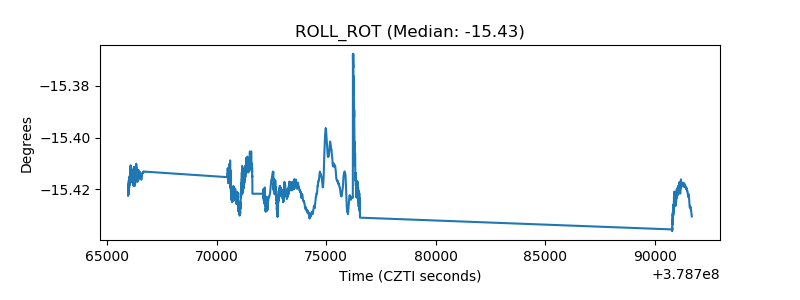 |
| _Roll_DEC |  |
| _Roll_RA | 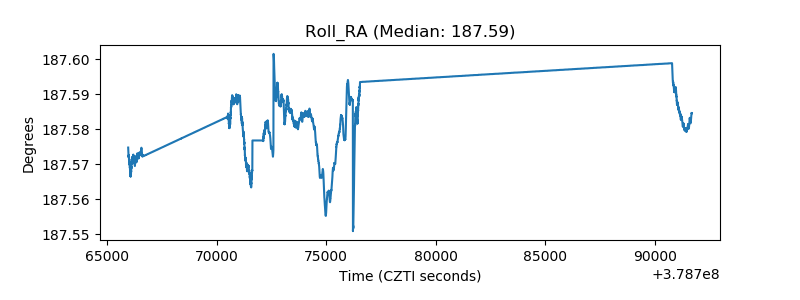 |
| Veto Counter | 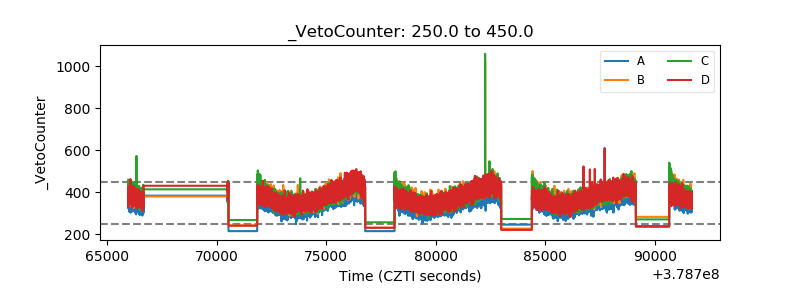 |