| Param | Original file | Final file |
|---|---|---|
| Filename | modeM0/AS1A11_046T03_9000004834_33867cztM0_level2.evt | modeM0/AS1A11_046T03_9000004834_33867cztM0_level2_quad_clean.evt |
| Size (bytes) | 957,162,240 | 126,443,520 |
| Size | 912.8 MB | 120.6 MB |
| Events in quadrant A | 8,290,876 | 699,982 |
| Events in quadrant B | 5,528,144 | 838,518 |
| Events in quadrant C | 5,244,086 | 831,894 |
| Events in quadrant D | 9,254,247 | 769,988 |
| Mode M9 | |||
|---|---|---|---|
| Quadrant | BADHDUFLAG | Total packets | Discarded packets |
| A | 0 | 17 | 0 |
| B | 0 | 17 | 0 |
| C | 0 | 17 | 0 |
| D | 0 | 17 | 0 |
| Mode M0 | |||
|---|---|---|---|
| Quadrant | BADHDUFLAG | Total packets | Discarded packets |
| A | 0 | 31212 | 2 |
| B | 0 | 23080 | 0 |
| C | 0 | 21770 | 0 |
| D | 0 | 34434 | 0 |
| Mode SS | |||
|---|---|---|---|
| Quadrant | BADHDUFLAG | Total packets | Discarded packets |
| A | 0 | 202 | 0 |
| B | 0 | 202 | 0 |
| C | 0 | 202 | 0 |
| D | 0 | 202 | 0 |
| Quadrant | Total seconds | Saturated seconds | Saturation percentage |
|---|---|---|---|
| A | 9920 | 1899 | 19.143145% |
| B | 9920 | 260 | 2.620968% |
| C | 9920 | 97 | 0.977823% |
| D | 9920 | 740 | 7.459677% |
Noise dominated data is calculated using 1-second bins in cleaned event files. If a bin has >2000 counts, and if more than 50% of those come from <1% of pixels, then it is considered to be noise-dominated and hence unusable.
| Quadrant | # 1 sec bins | Bins with >0 counts | Bins with >2000 counts | High rate bins dominated by noise | Noise dominated (total time) | Noise dominated (detector-on time) | Marked lightcurve |
|---|---|---|---|---|---|---|---|
| A | 25811 | 9922 | 1459 | 1459 | 5.65% | 14.70% | 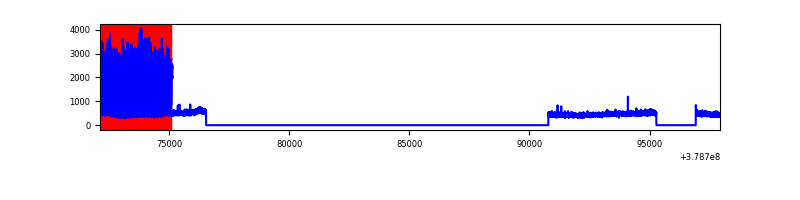 |
| B | 25811 | 9922 | 157 | 157 | 0.61% | 1.58% | 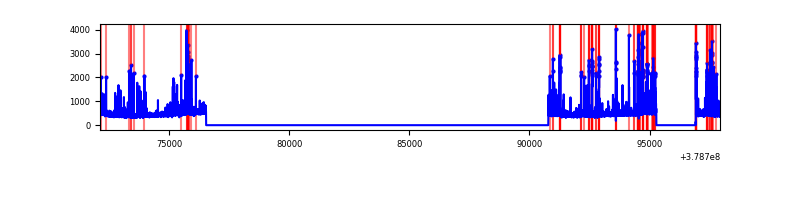 |
| C | 25811 | 9922 | 64 | 64 | 0.25% | 0.65% | 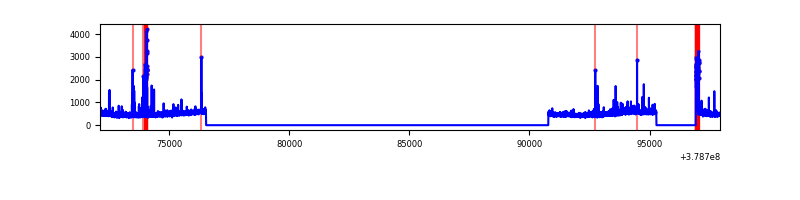 |
| D | 25811 | 9922 | 601 | 601 | 2.33% | 6.06% | 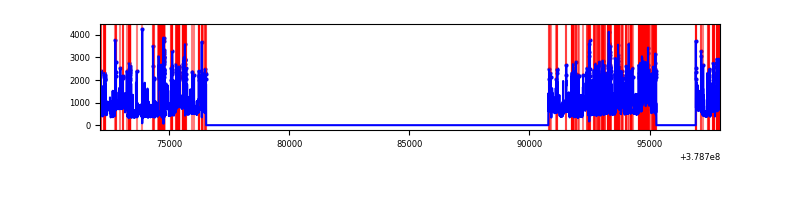 |
Top three noisy pixels from each quadrant. If the there are fewer than three noisy pixels in the level2.evt file, extra rows are filled as -1
| Pixel properties | Quadrant properties | ||||||
|---|---|---|---|---|---|---|---|
| Quadrant | DetID | PixID | Counts | Sigma | Mean | Median | Sigma |
| A | 15 | 169 | 4278903 | 20948.5 | 1029 | 1005 | 204.2 |
| A | 13 | 6 | 32484 | 154.15 | 1029 | 1005 | 204.2 |
| A | 13 | 254 | 14733 | 67.22 | 1029 | 1005 | 204.2 |
| B | 5 | 172 | 835457 | 3924.92 | 1116 | 1087 | 212.6 |
| B | 15 | 85 | 59133 | 273.05 | 1116 | 1087 | 212.6 |
| B | 0 | 229 | 40795 | 186.79 | 1116 | 1087 | 212.6 |
| C | 15 | 214 | 416648 | 1644.29 | 1096 | 1104 | 252.7 |
| C | 9 | 187 | 206188 | 811.51 | 1096 | 1104 | 252.7 |
| C | 3 | 233 | 142977 | 561.38 | 1096 | 1104 | 252.7 |
| D | 8 | 195 | 2054375 | 7890.86 | 1072 | 1043 | 260.2 |
| D | 12 | 235 | 1083641 | 4160.37 | 1072 | 1043 | 260.2 |
| D | 13 | 249 | 616183 | 2363.95 | 1072 | 1043 | 260.2 |
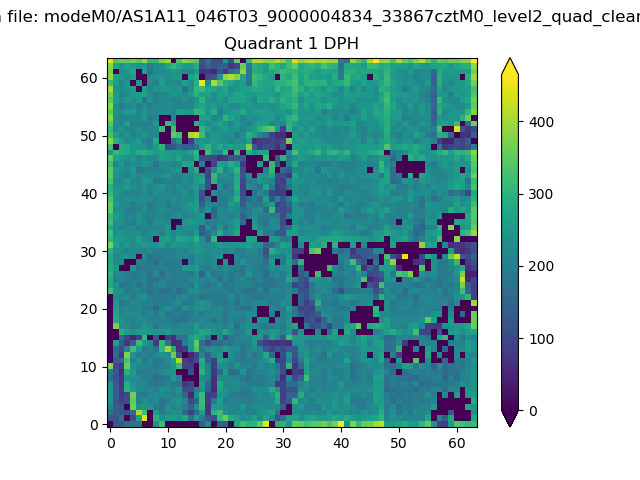
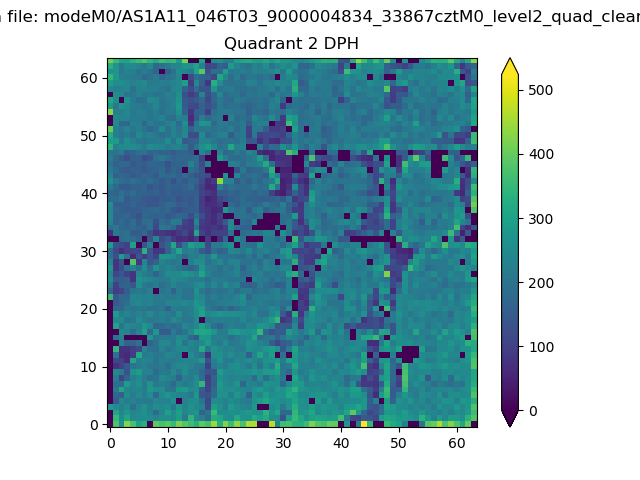
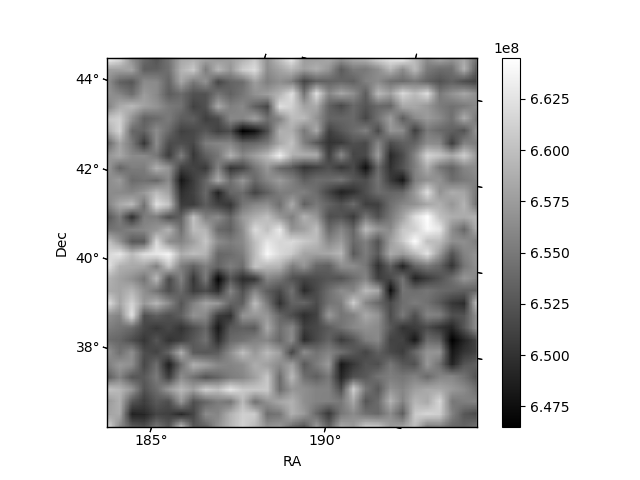
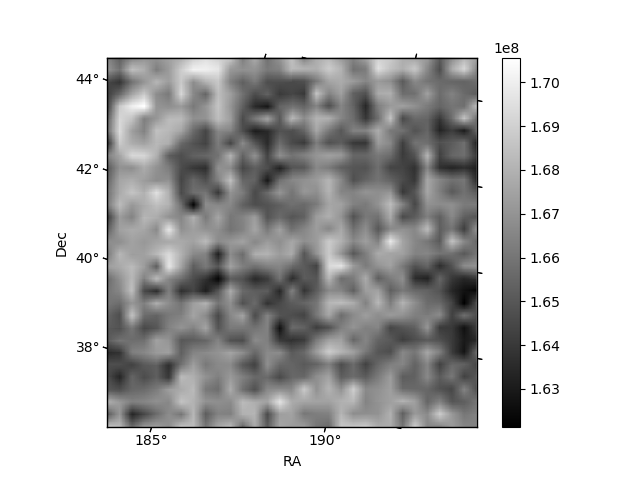
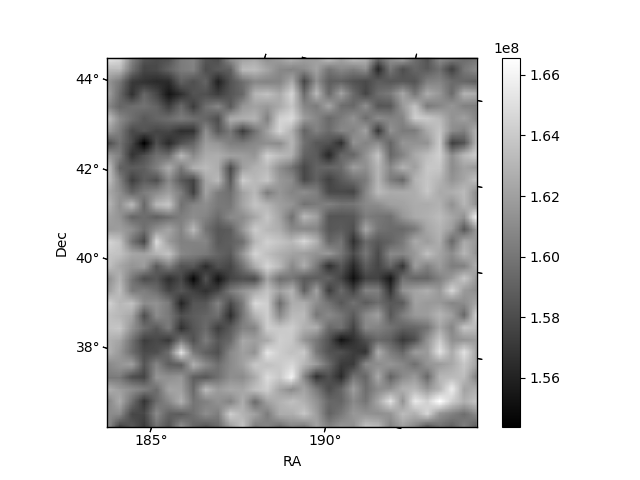
Histogram calculated using DETX and DETY for each event in the final _common_clean file
| Quadrant A |  |
 |
Quadrant B |
|---|---|---|---|
| Quadrant D | 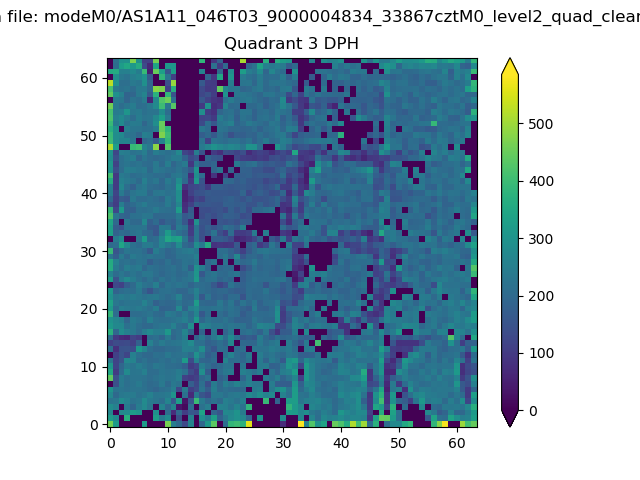 |
 |
Quadrant C |
| Plot type | Count rate plots | Images |
|---|---|---|
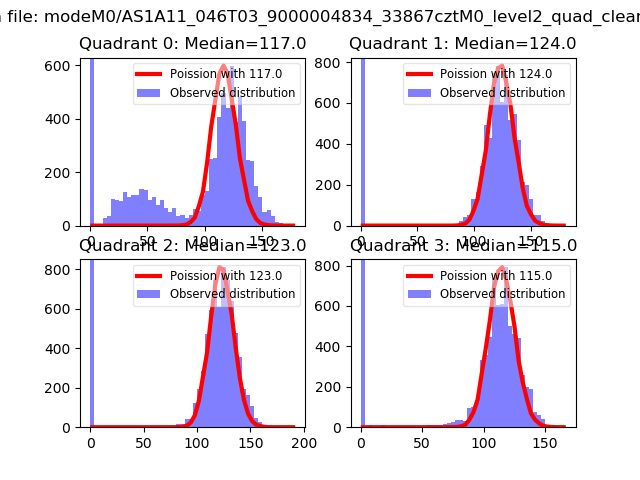
| Comparison with Poisson distribution Blue bars denote a histogram of data divided into 1 sec bins. Red curve is a Poisson curve with rate = median count rate of data. |
 |
 |
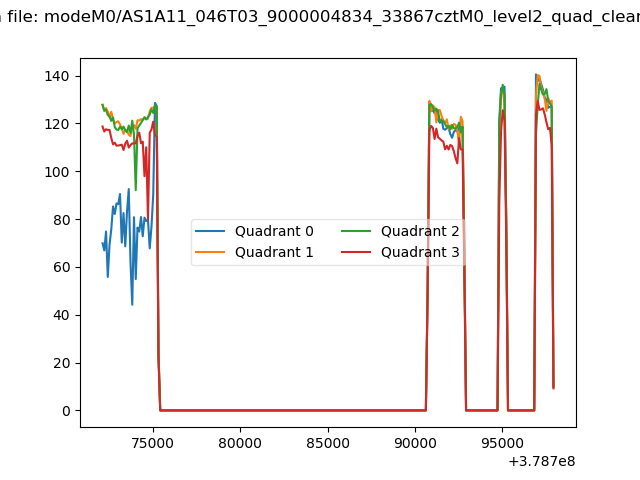
| Quadrant-wise count rates Data is divided into 100 sec bins |
 |
|
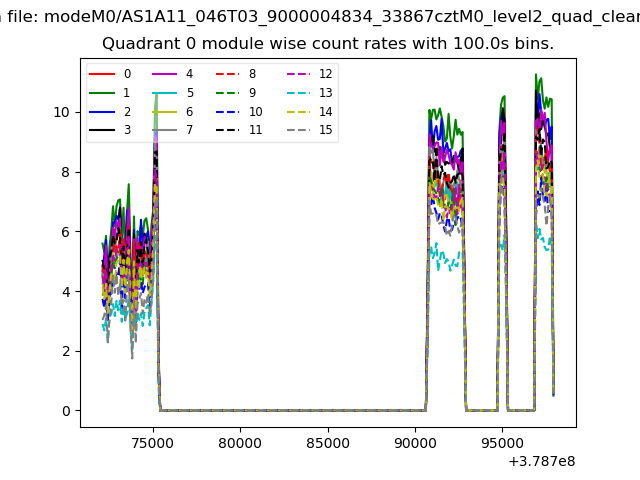
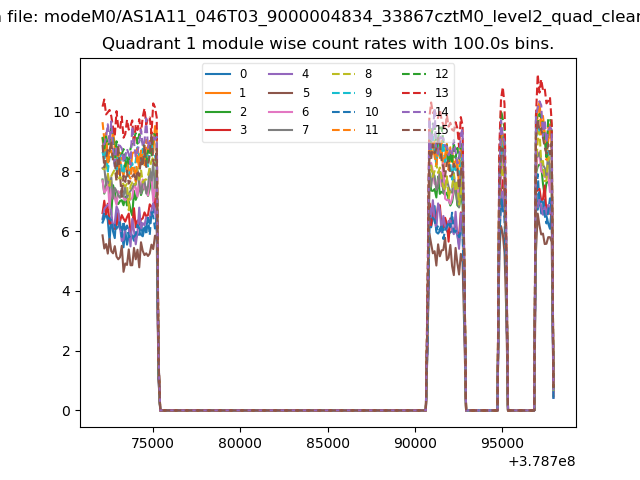
| Module-wise count rates for Quadrant A Data is divided into 100 sec bins |
 |
 |
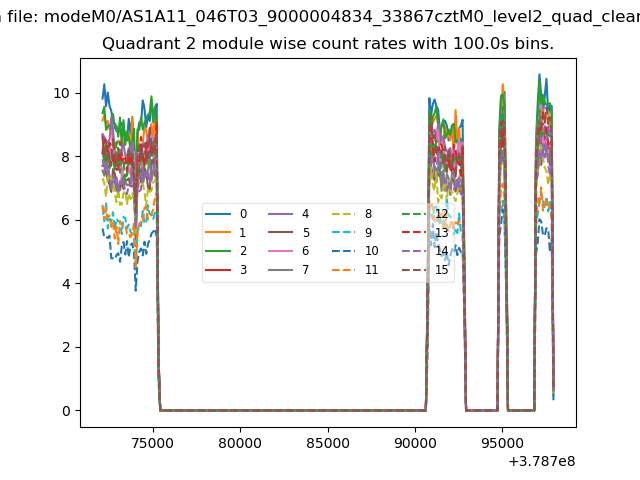
| Module-wise count rates for Quadrant B Data is divided into 100 sec bins |
 |
 |
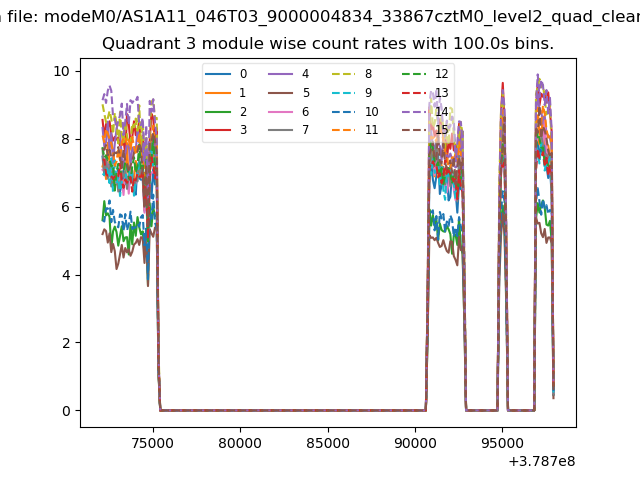
| Module-wise count rates for Quadrant C Data is divided into 100 sec bins |
 |
 |
| Module-wise count rates for Quadrant D Data is divided into 100 sec bins |
 |
 |
| Parameter | Plot |
|---|---|
| CZT HV Monitor | 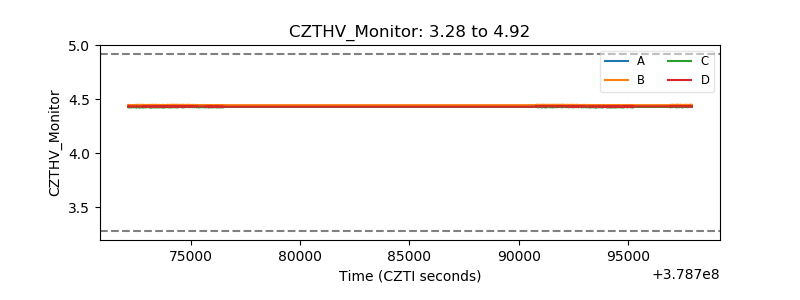 |
| D_VDD | 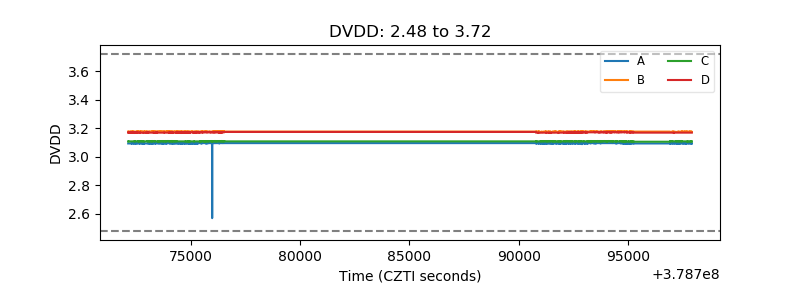 |
| Temperature 1 | 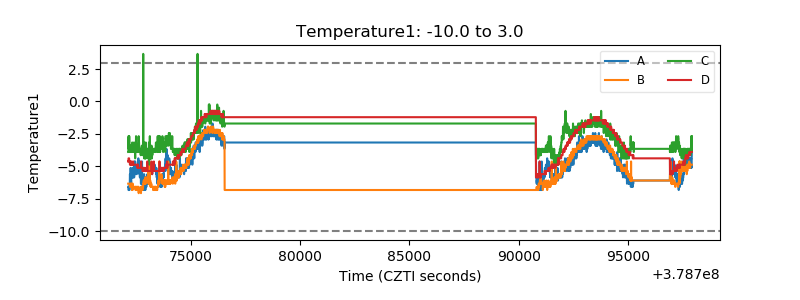 |
| Veto HV Monitor | 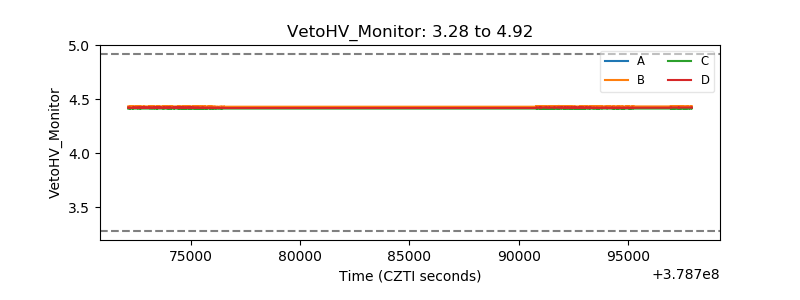 |
| Veto LLD | 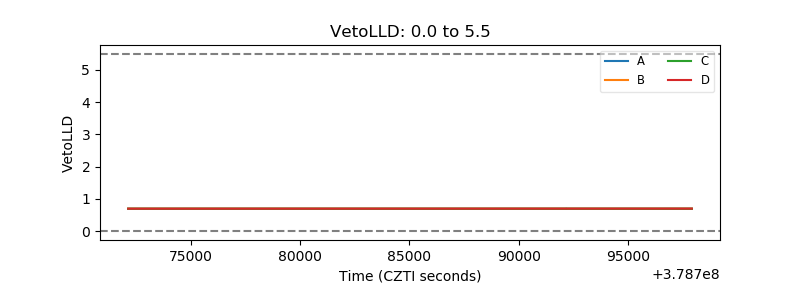 |
| Alpha Counter | 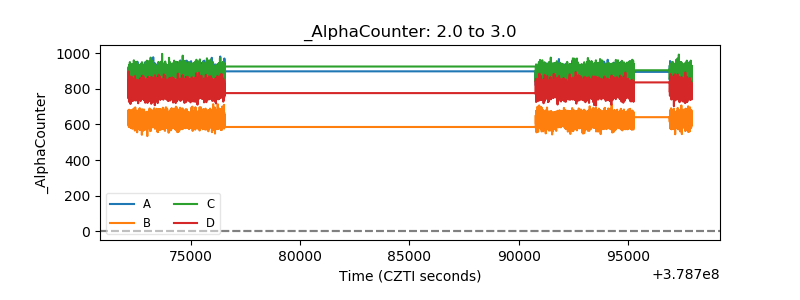 |
| _CPM_Rate | 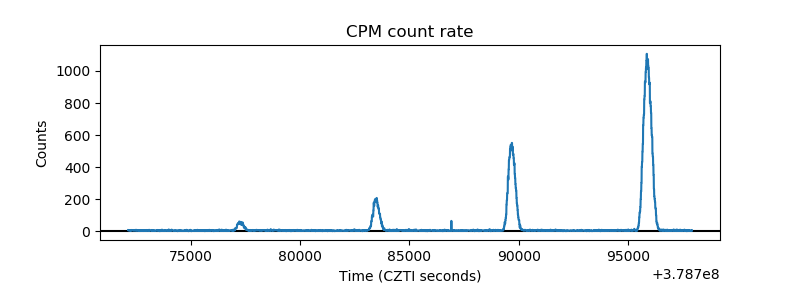 |
| CZT Counter | 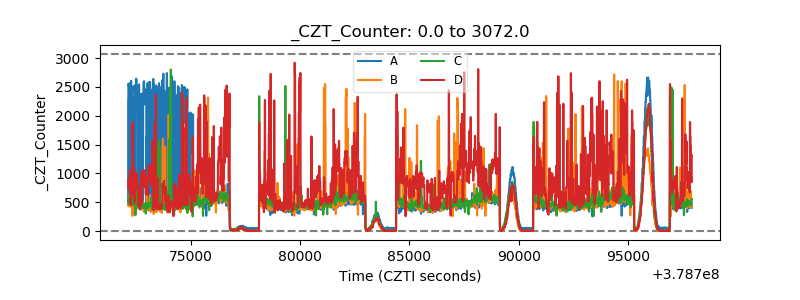 |
| +2.5 Volts monitor | 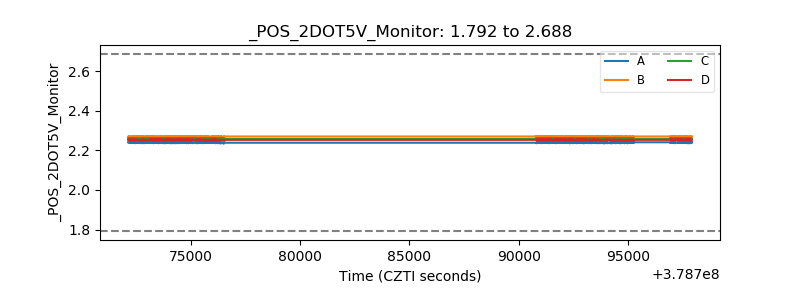 |
| +5 Volts monitor |  |
| _ROLL_ROT | 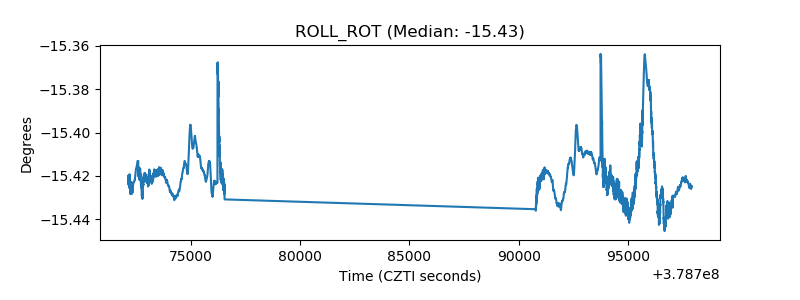 |
| _Roll_DEC | 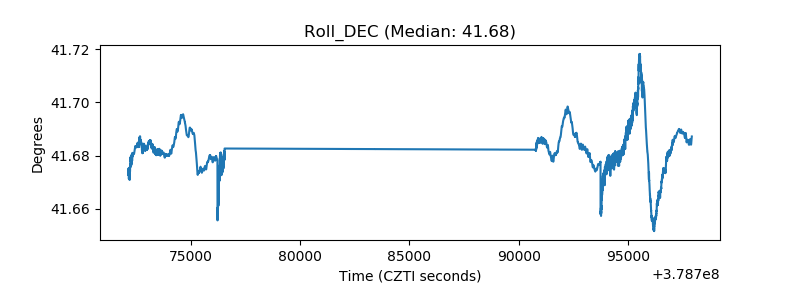 |
| _Roll_RA | 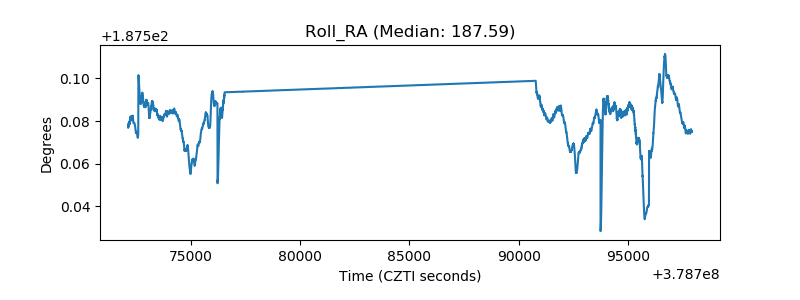 |
| Veto Counter | 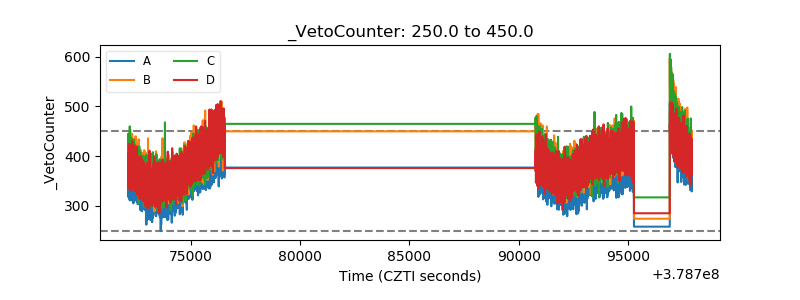 |