| Param | Original file | Final file |
|---|---|---|
| Filename | modeM0/AS1A11_046T03_9000004834_33870cztM0_level2.evt | modeM0/AS1A11_046T03_9000004834_33870cztM0_level2_quad_clean.evt |
| Size (bytes) | 461,335,680 | 71,254,080 |
| Size | 440.0 MB | 68.0 MB |
| Events in quadrant A | 2,505,399 | 464,230 |
| Events in quadrant B | 3,141,881 | 460,271 |
| Events in quadrant C | 2,944,153 | 455,961 |
| Events in quadrant D | 5,031,932 | 417,164 |
| Mode M9 | |||
|---|---|---|---|
| Quadrant | BADHDUFLAG | Total packets | Discarded packets |
| A | 0 | 19 | 0 |
| B | 0 | 19 | 0 |
| C | 0 | 19 | 0 |
| D | 0 | 19 | 0 |
| Mode M0 | |||
|---|---|---|---|
| Quadrant | BADHDUFLAG | Total packets | Discarded packets |
| A | 0 | 10416 | 3 |
| B | 0 | 12406 | 2 |
| C | 0 | 11643 | 2 |
| D | 0 | 18409 | 2 |
| Mode SS | |||
|---|---|---|---|
| Quadrant | BADHDUFLAG | Total packets | Discarded packets |
| A | 0 | 106 | 0 |
| B | 0 | 106 | 0 |
| C | 0 | 106 | 0 |
| D | 0 | 106 | 0 |
| Quadrant | Total seconds | Saturated seconds | Saturation percentage |
|---|---|---|---|
| A | 5130 | 3 | 0.058480% |
| B | 5130 | 142 | 2.768031% |
| C | 5130 | 36 | 0.701754% |
| D | 5130 | 319 | 6.218324% |
Noise dominated data is calculated using 1-second bins in cleaned event files. If a bin has >2000 counts, and if more than 50% of those come from <1% of pixels, then it is considered to be noise-dominated and hence unusable.
| Quadrant | # 1 sec bins | Bins with >0 counts | Bins with >2000 counts | High rate bins dominated by noise | Noise dominated (total time) | Noise dominated (detector-on time) | Marked lightcurve |
|---|---|---|---|---|---|---|---|
| A | 7043 | 5131 | 0 | 0 | 0.00% | 0.00% | 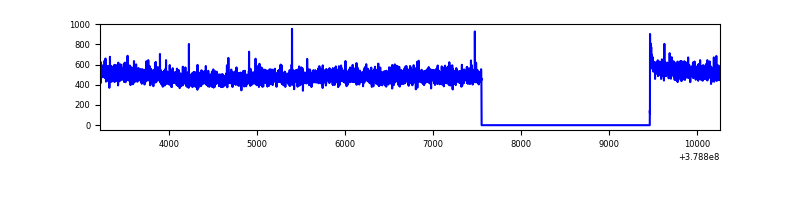 |
| B | 7043 | 5131 | 83 | 83 | 1.18% | 1.62% | 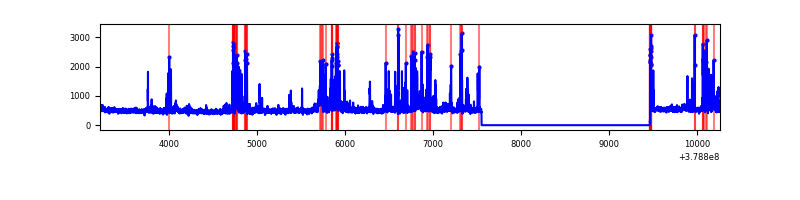 |
| C | 7043 | 5131 | 31 | 31 | 0.44% | 0.60% | 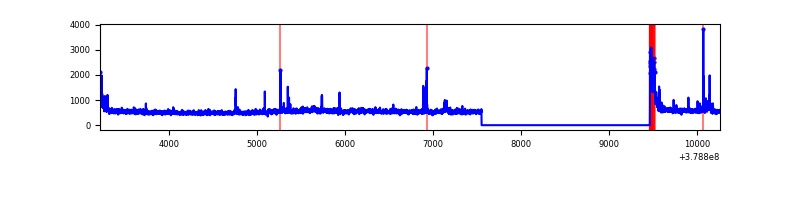 |
| D | 7043 | 5131 | 303 | 303 | 4.30% | 5.91% | 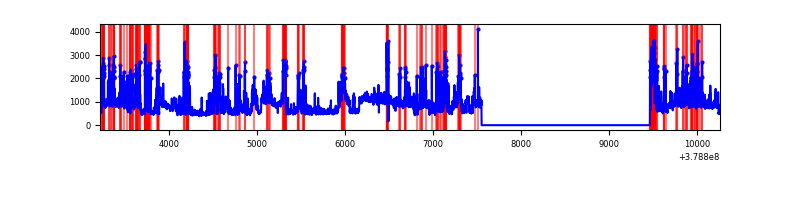 |
Top three noisy pixels from each quadrant. If the there are fewer than three noisy pixels in the level2.evt file, extra rows are filled as -1
| Pixel properties | Quadrant properties | ||||||
|---|---|---|---|---|---|---|---|
| Quadrant | DetID | PixID | Counts | Sigma | Mean | Median | Sigma |
| A | 13 | 6 | 15350 | 115.79 | 643 | 630 | 127.1 |
| A | 10 | 83 | 8877 | 64.87 | 643 | 630 | 127.1 |
| A | 13 | 254 | 7845 | 56.76 | 643 | 630 | 127.1 |
| B | 5 | 172 | 569049 | 4854.78 | 623 | 610 | 117.1 |
| B | 4 | 232 | 25130 | 209.41 | 623 | 610 | 117.1 |
| B | 0 | 199 | 20427 | 169.25 | 623 | 610 | 117.1 |
| C | 15 | 214 | 225104 | 1585.49 | 614 | 620 | 141.6 |
| C | 0 | 10 | 161807 | 1138.43 | 614 | 620 | 141.6 |
| C | 3 | 233 | 100872 | 708.06 | 614 | 620 | 141.6 |
| D | 8 | 195 | 1256836 | 8483.35 | 606 | 590 | 148.1 |
| D | 2 | 250 | 315932 | 2129.49 | 606 | 590 | 148.1 |
| D | 12 | 235 | 298435 | 2011.33 | 606 | 590 | 148.1 |
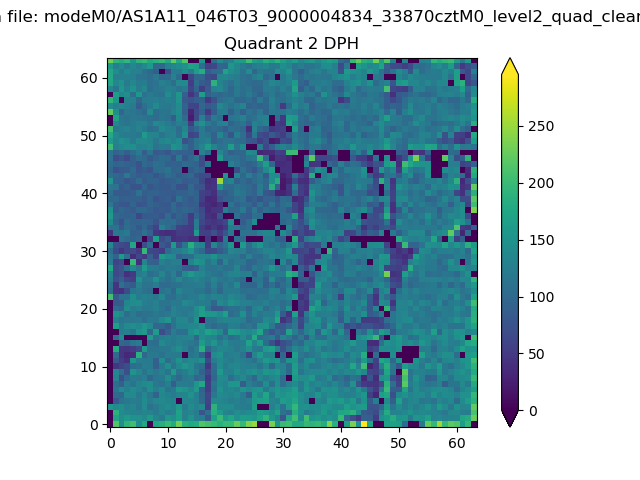
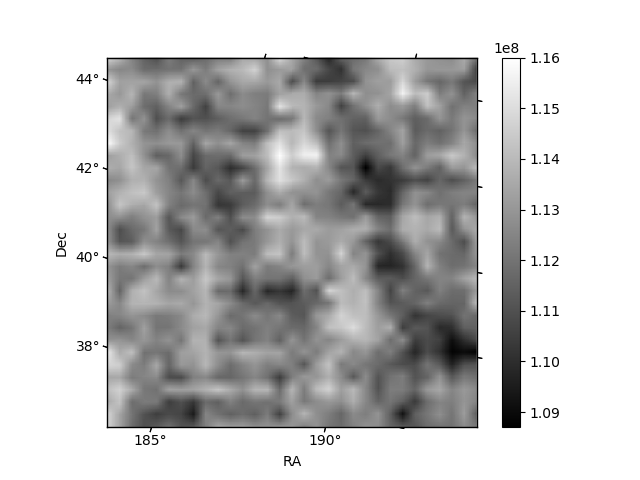
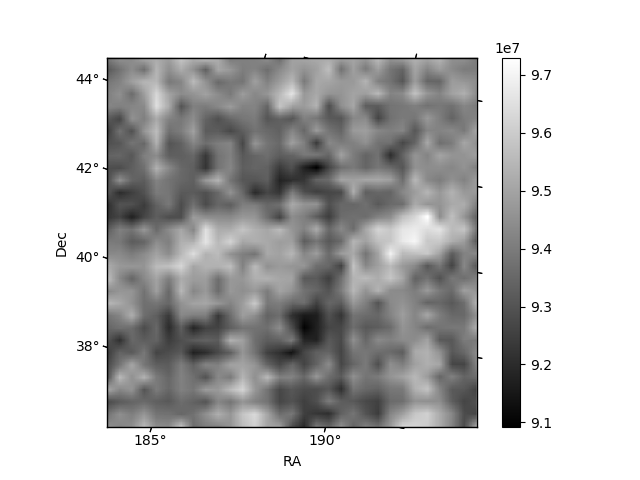
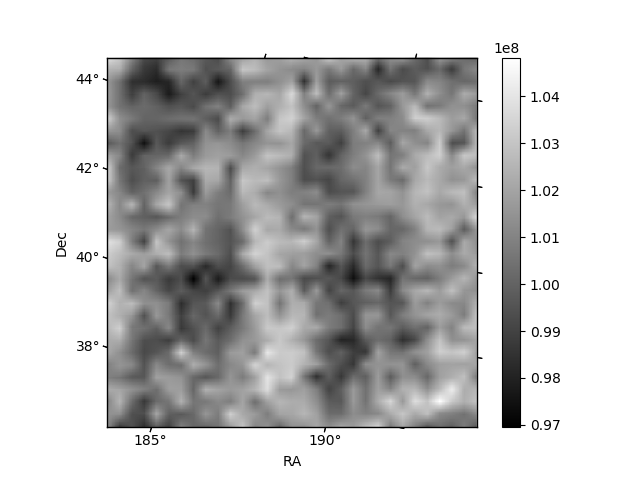
Histogram calculated using DETX and DETY for each event in the final _common_clean file
| Quadrant A |  |
 |
Quadrant B |
|---|---|---|---|
| Quadrant D | 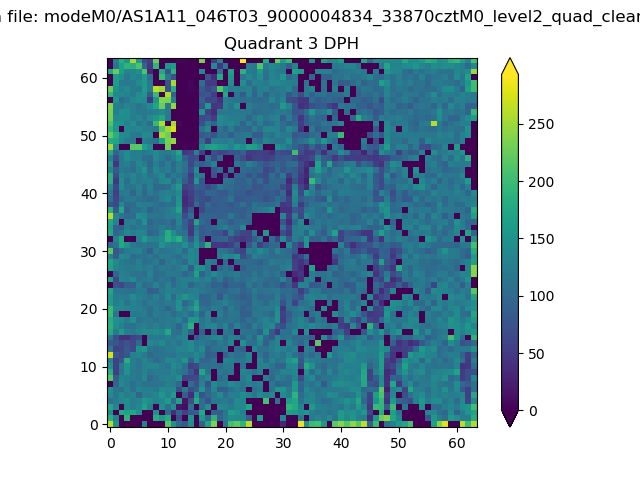 |
 |
Quadrant C |
| Plot type | Count rate plots | Images |
|---|---|---|
| Comparison with Poisson distribution Blue bars denote a histogram of data divided into 1 sec bins. Red curve is a Poisson curve with rate = median count rate of data. |
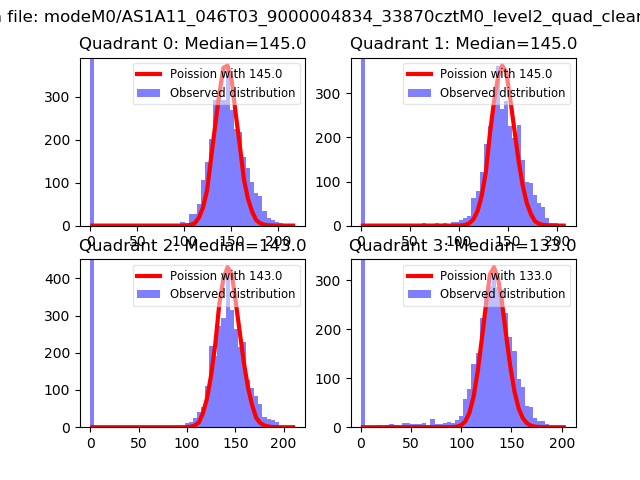 |
 |
| Quadrant-wise count rates Data is divided into 100 sec bins |
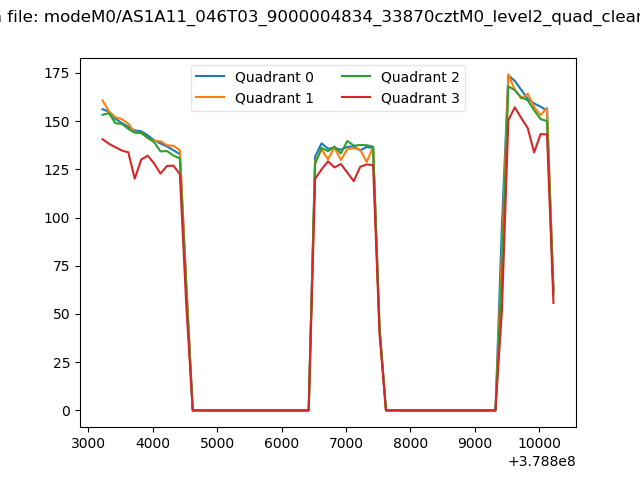 |
|
| Module-wise count rates for Quadrant A Data is divided into 100 sec bins |
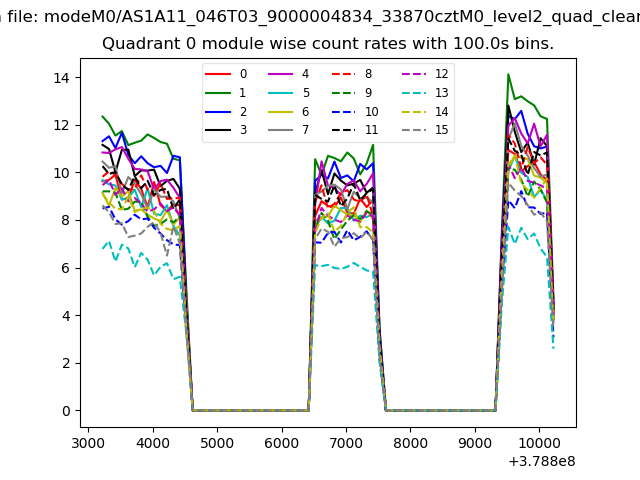 |
 |
| Module-wise count rates for Quadrant B Data is divided into 100 sec bins |
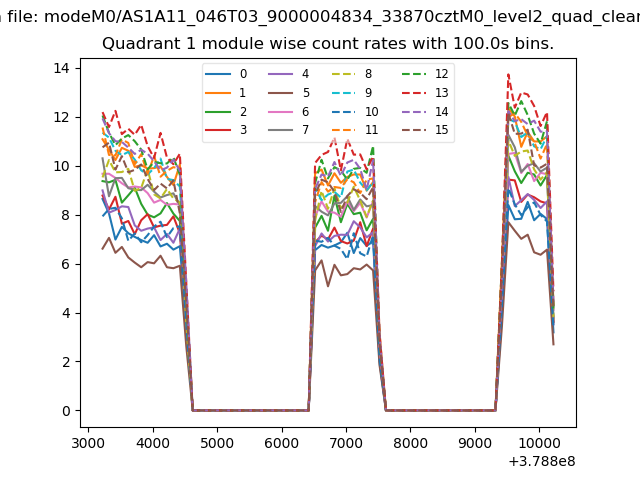 |
 |
| Module-wise count rates for Quadrant C Data is divided into 100 sec bins |
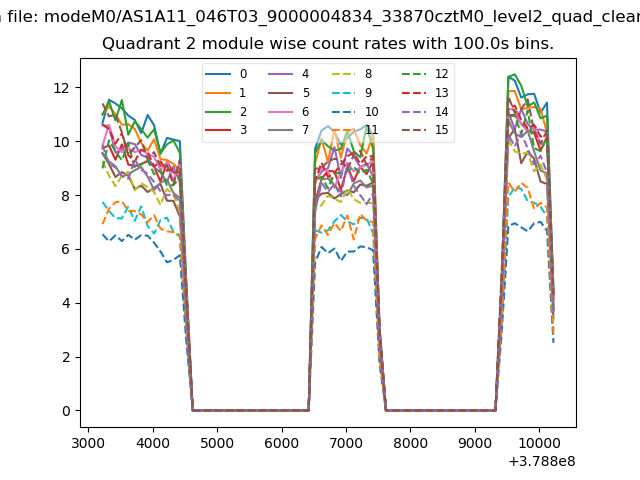 |
 |
| Module-wise count rates for Quadrant D Data is divided into 100 sec bins |
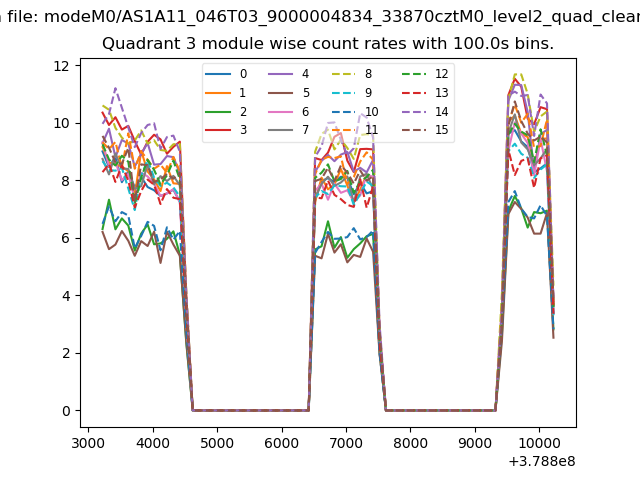 |
 |
| Parameter | Plot |
|---|---|
| CZT HV Monitor | 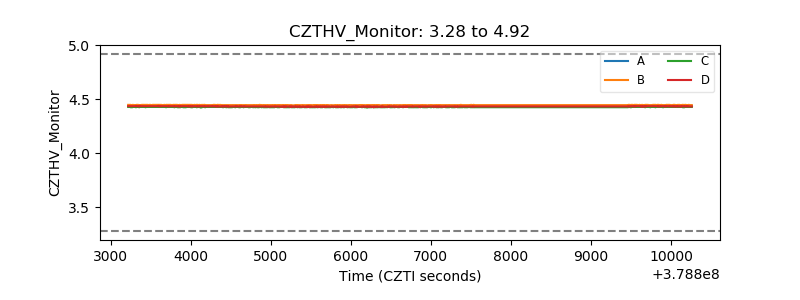 |
| D_VDD | 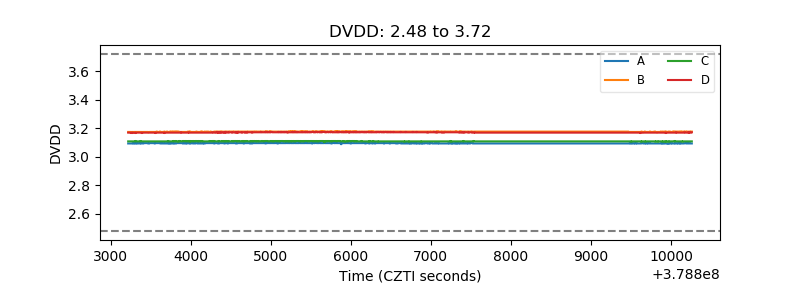 |
| Temperature 1 | 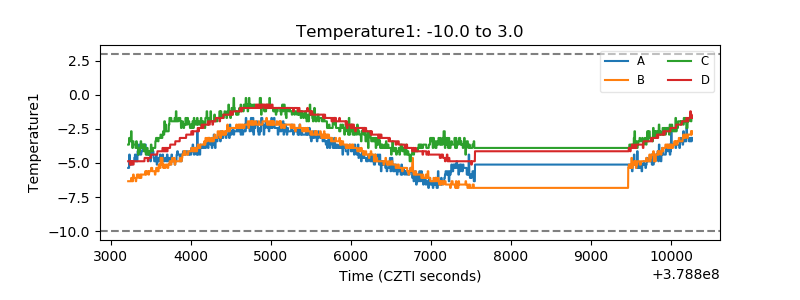 |
| Veto HV Monitor |  |
| Veto LLD | 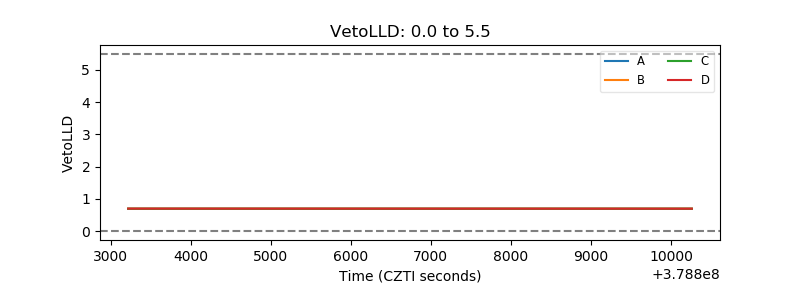 |
| Alpha Counter | 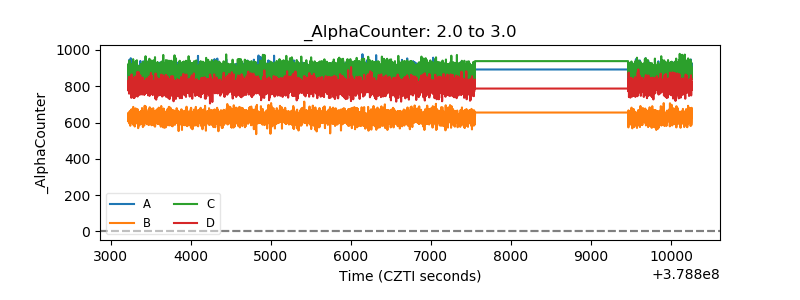 |
| _CPM_Rate | 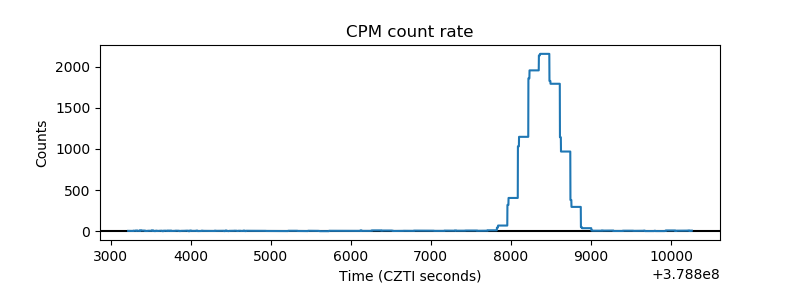 |
| CZT Counter | 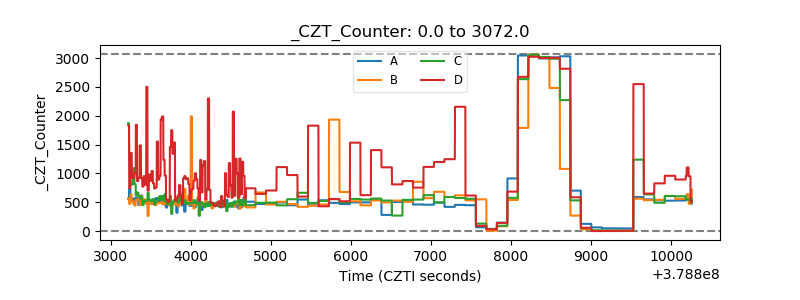 |
| +2.5 Volts monitor |  |
| +5 Volts monitor |  |
| _ROLL_ROT | 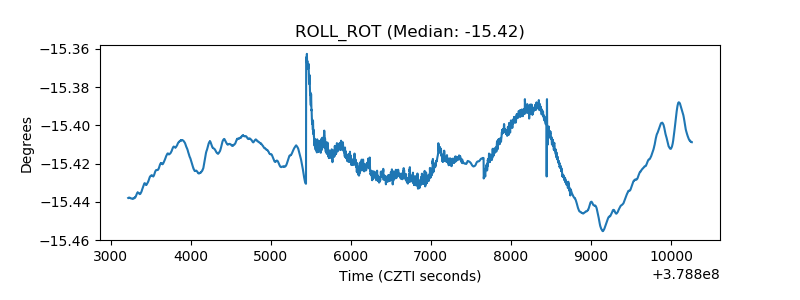 |
| _Roll_DEC |  |
| _Roll_RA |  |
| Veto Counter | 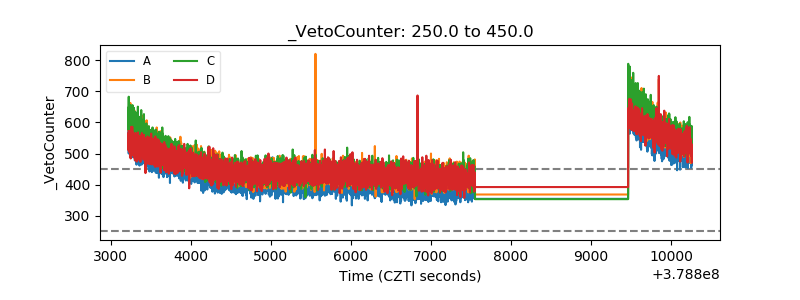 |