| Param | Original file | Final file |
|---|---|---|
| Filename | modeM0/AS1A11_046T03_9000004834_33871cztM0_level2.evt | modeM0/AS1A11_046T03_9000004834_33871cztM0_level2_quad_clean.evt |
| Size (bytes) | 372,542,400 | 42,742,080 |
| Size | 355.3 MB | 40.8 MB |
| Events in quadrant A | 1,866,730 | 269,769 |
| Events in quadrant B | 2,856,221 | 262,039 |
| Events in quadrant C | 2,360,229 | 263,382 |
| Events in quadrant D | 3,944,859 | 233,897 |
| Mode M0 | |||
|---|---|---|---|
| Quadrant | BADHDUFLAG | Total packets | Discarded packets |
| A | 0 | 7590 | 0 |
| B | 0 | 10745 | 0 |
| C | 0 | 9519 | 0 |
| D | 0 | 14322 | 0 |
| Mode SS | |||
|---|---|---|---|
| Quadrant | BADHDUFLAG | Total packets | Discarded packets |
| A | 0 | 74 | 0 |
| B | 0 | 74 | 0 |
| C | 0 | 74 | 0 |
| D | 0 | 74 | 0 |
| Quadrant | Total seconds | Saturated seconds | Saturation percentage |
|---|---|---|---|
| A | 3745 | 8 | 0.213618% |
| B | 3745 | 295 | 7.877170% |
| C | 3745 | 11 | 0.293725% |
| D | 3745 | 374 | 9.986649% |
Noise dominated data is calculated using 1-second bins in cleaned event files. If a bin has >2000 counts, and if more than 50% of those come from <1% of pixels, then it is considered to be noise-dominated and hence unusable.
| Quadrant | # 1 sec bins | Bins with >0 counts | Bins with >2000 counts | High rate bins dominated by noise | Noise dominated (total time) | Noise dominated (detector-on time) | Marked lightcurve |
|---|---|---|---|---|---|---|---|
| A | 3745 | 3745 | 0 | 0 | 0.00% | 0.00% | 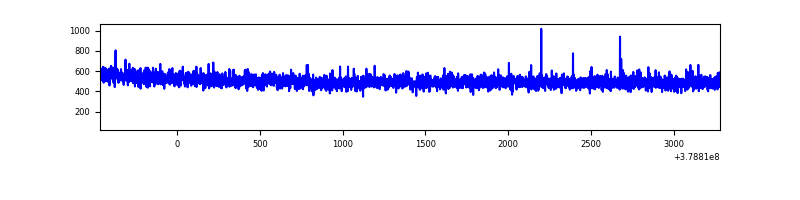 |
| B | 3745 | 3745 | 195 | 195 | 5.21% | 5.21% | 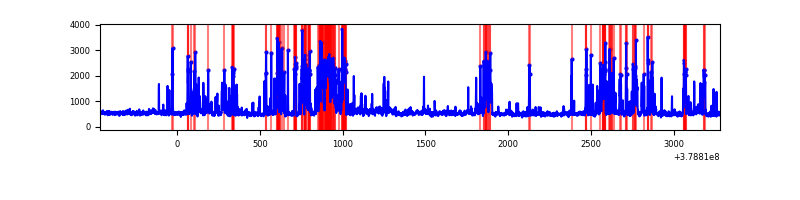 |
| C | 3745 | 3745 | 7 | 7 | 0.19% | 0.19% | 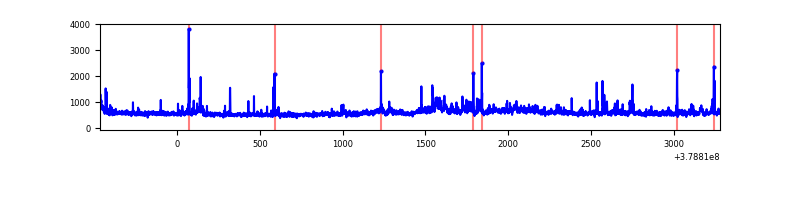 |
| D | 3745 | 3745 | 321 | 321 | 8.57% | 8.57% | 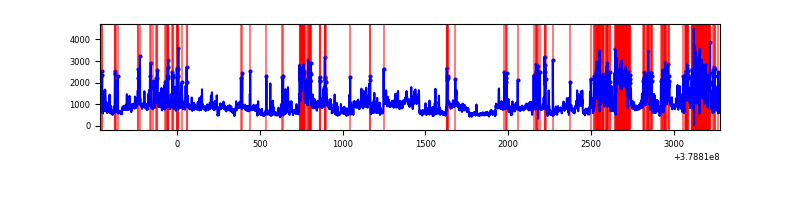 |
Top three noisy pixels from each quadrant. If the there are fewer than three noisy pixels in the level2.evt file, extra rows are filled as -1
| Pixel properties | Quadrant properties | ||||||
|---|---|---|---|---|---|---|---|
| Quadrant | DetID | PixID | Counts | Sigma | Mean | Median | Sigma |
| A | 13 | 6 | 12661 | 127.6 | 480 | 472 | 95.5 |
| A | 13 | 254 | 6243 | 60.41 | 480 | 472 | 95.5 |
| A | 3 | 137 | 4306 | 40.14 | 480 | 472 | 95.5 |
| B | 5 | 172 | 944858 | 10981.41 | 454 | 443 | 86.0 |
| B | 0 | 199 | 28720 | 328.8 | 454 | 443 | 86.0 |
| B | 0 | 229 | 19884 | 226.05 | 454 | 443 | 86.0 |
| C | 3 | 233 | 265431 | 2494.43 | 458 | 462 | 106.2 |
| C | 15 | 214 | 160453 | 1506.16 | 458 | 462 | 106.2 |
| C | 0 | 10 | 96506 | 904.16 | 458 | 462 | 106.2 |
| D | 8 | 195 | 861591 | 7871.54 | 450 | 439 | 109.4 |
| D | 12 | 235 | 655784 | 5990.32 | 450 | 439 | 109.4 |
| D | 1 | 47 | 213186 | 1944.66 | 450 | 439 | 109.4 |
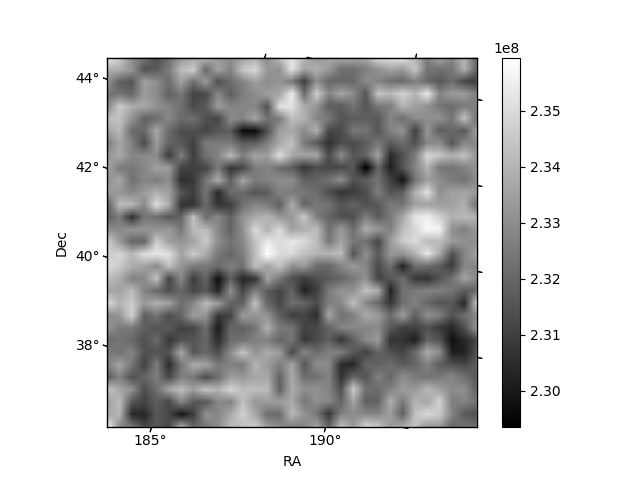
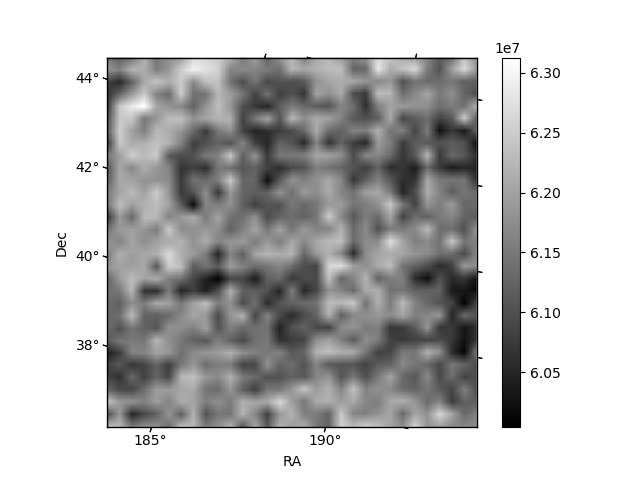
Histogram calculated using DETX and DETY for each event in the final _common_clean file
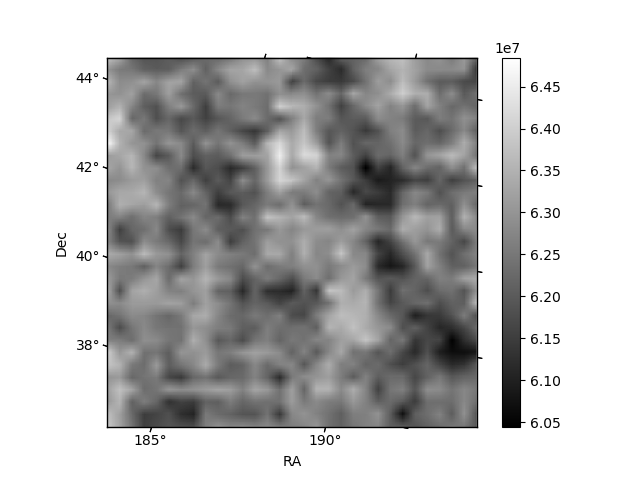
| Quadrant A | 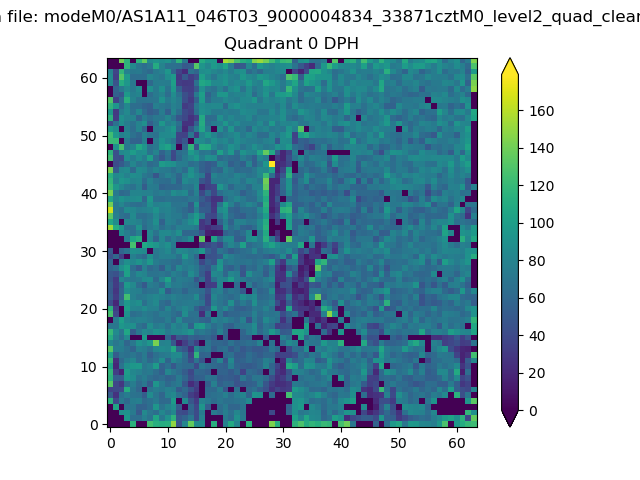 |
 |
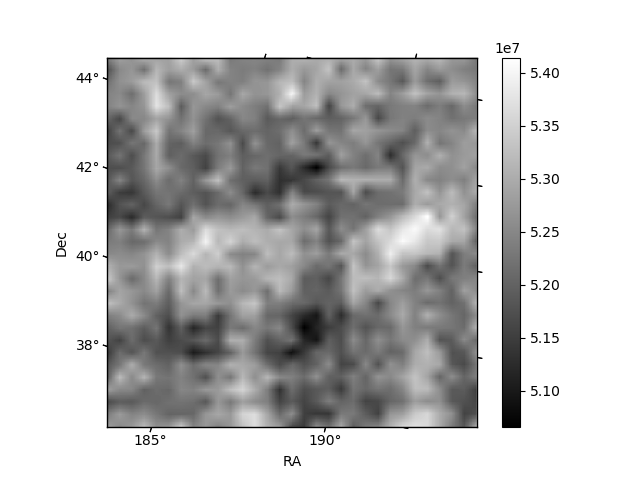
Quadrant B |
|---|---|---|---|
| Quadrant D | 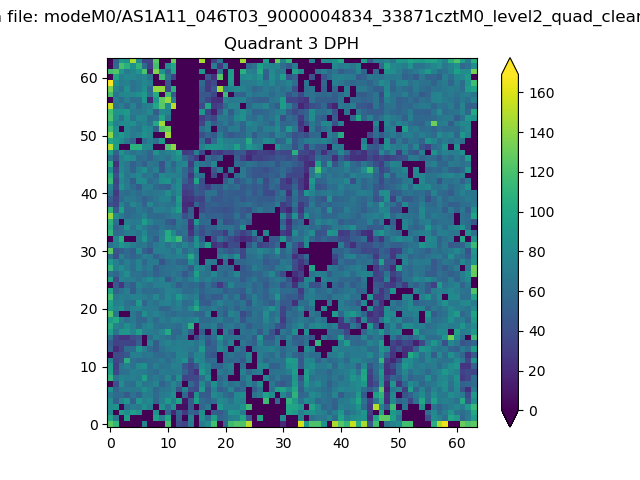 |
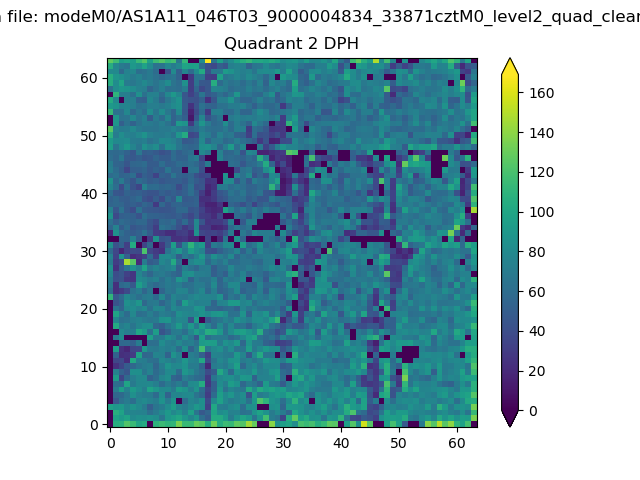 |
Quadrant C |
| Plot type | Count rate plots | Images |
|---|---|---|
| Comparison with Poisson distribution Blue bars denote a histogram of data divided into 1 sec bins. Red curve is a Poisson curve with rate = median count rate of data. |
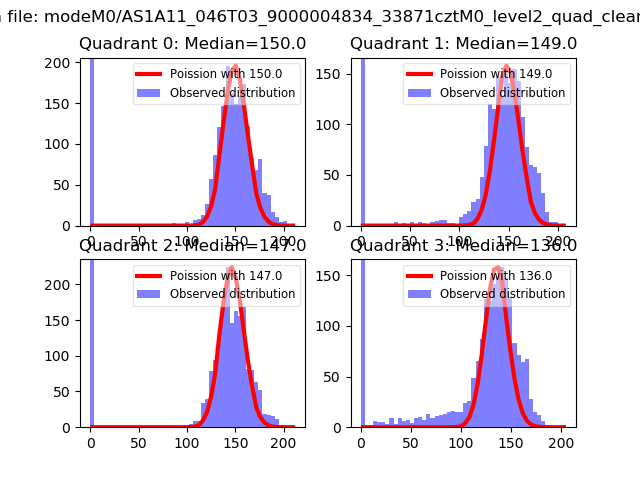 |
 |
| Quadrant-wise count rates Data is divided into 100 sec bins |
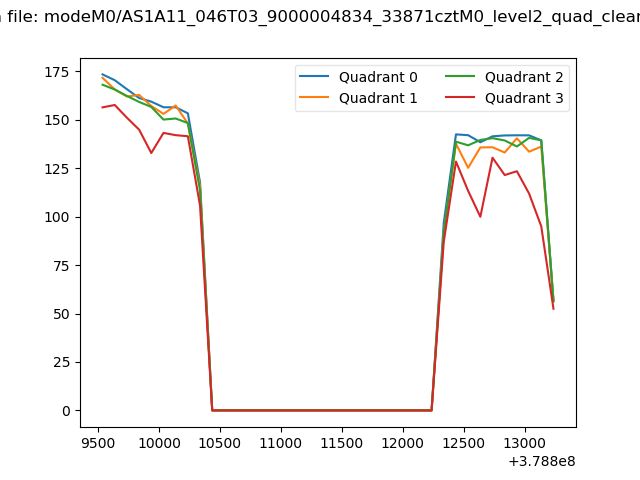 |
|
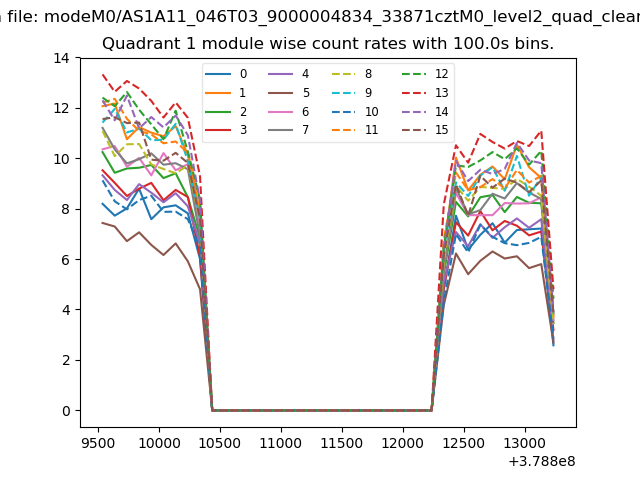
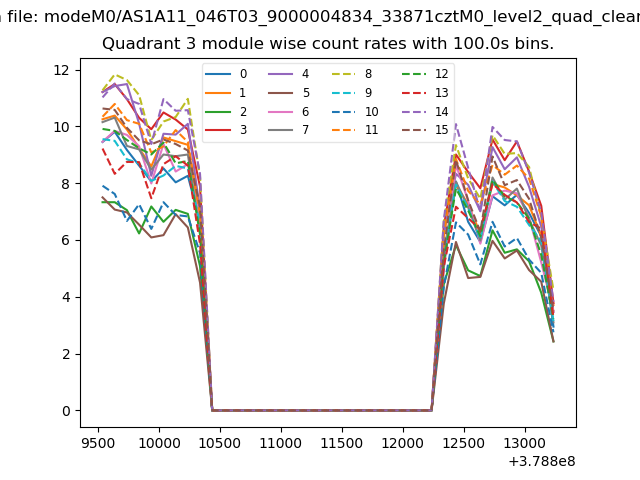
| Module-wise count rates for Quadrant A Data is divided into 100 sec bins |
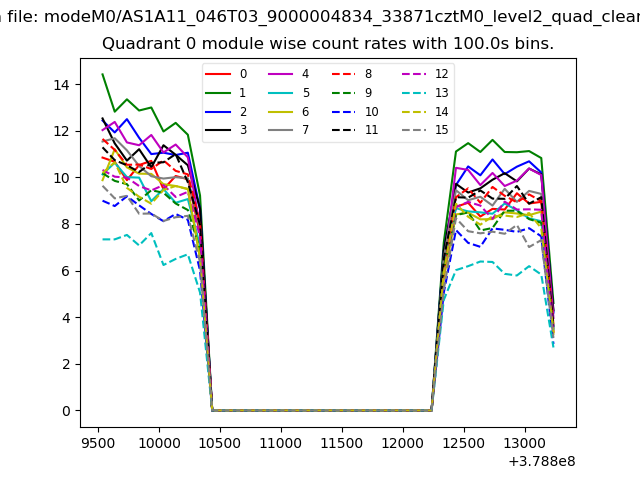 |
 |
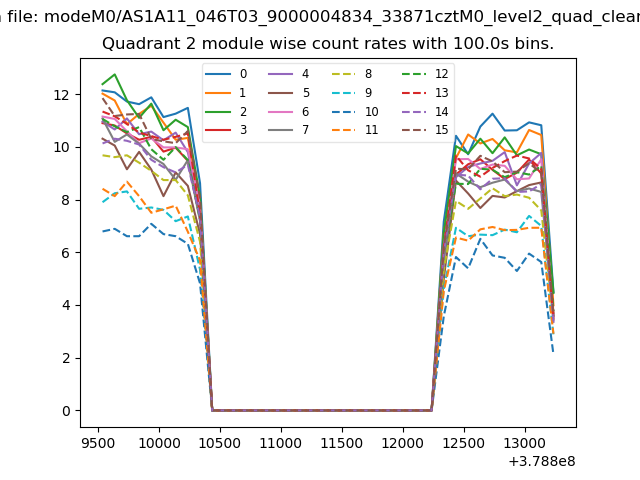
| Module-wise count rates for Quadrant B Data is divided into 100 sec bins |
 |
 |
| Module-wise count rates for Quadrant C Data is divided into 100 sec bins |
 |
 |
| Module-wise count rates for Quadrant D Data is divided into 100 sec bins |
 |
 |
| Parameter | Plot |
|---|---|
| CZT HV Monitor | 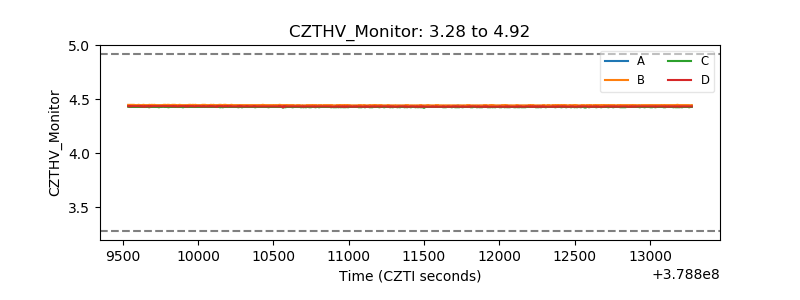 |
| D_VDD | 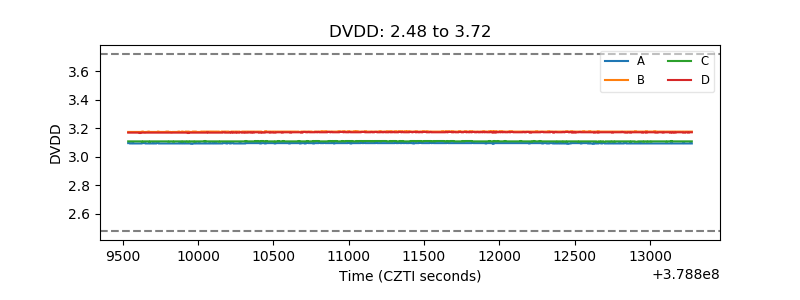 |
| Temperature 1 | 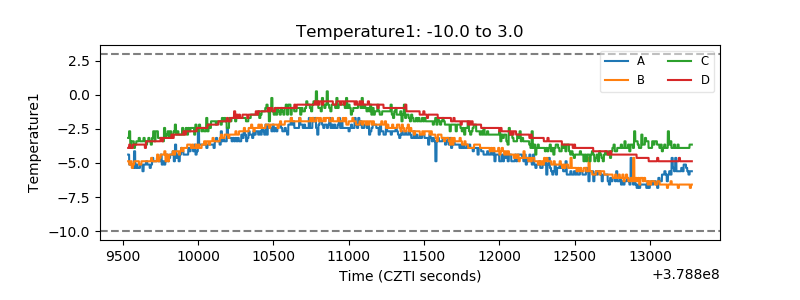 |
| Veto HV Monitor | 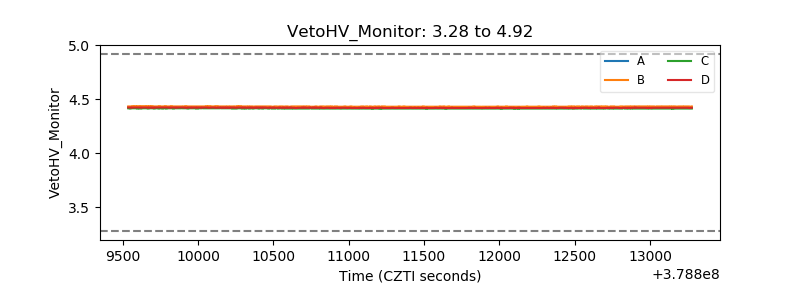 |
| Veto LLD | 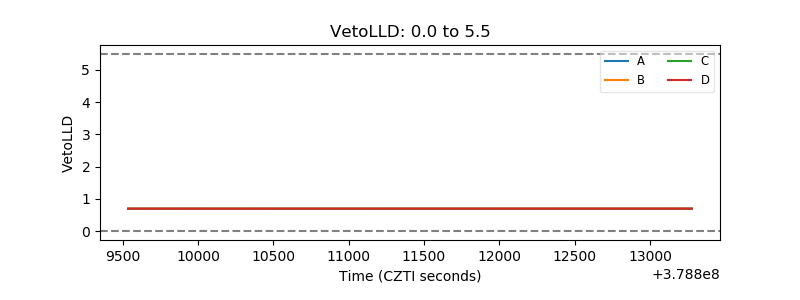 |
| Alpha Counter | 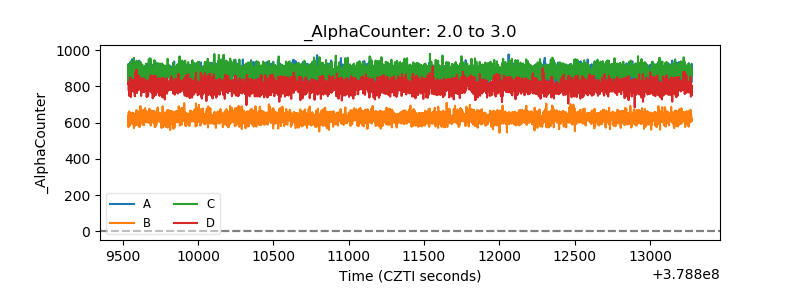 |
| _CPM_Rate | 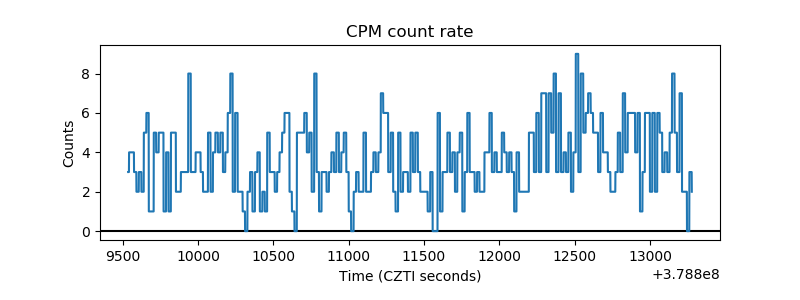 |
| CZT Counter | 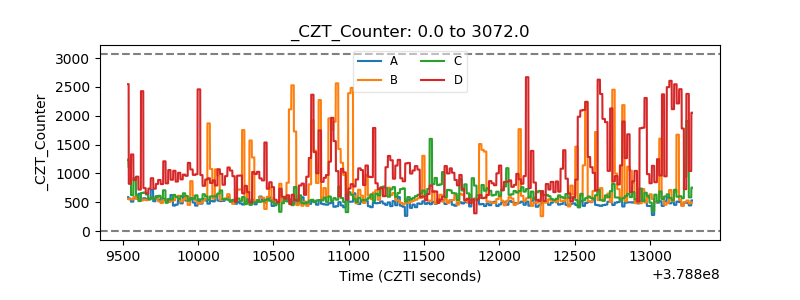 |
| +2.5 Volts monitor | 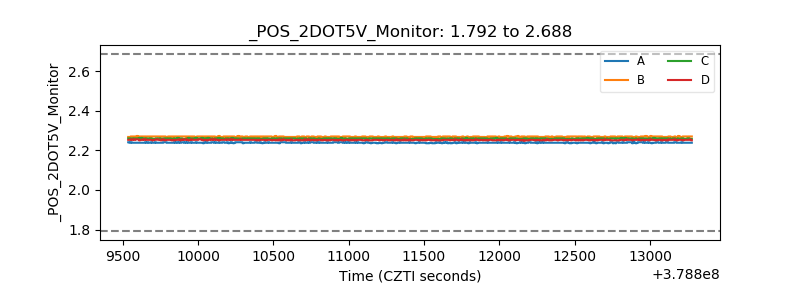 |
| +5 Volts monitor | 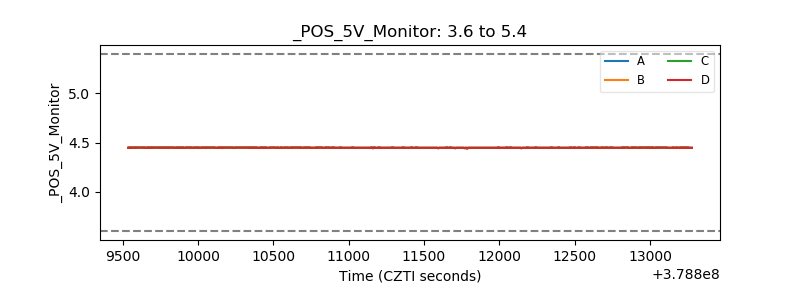 |
| _ROLL_ROT | 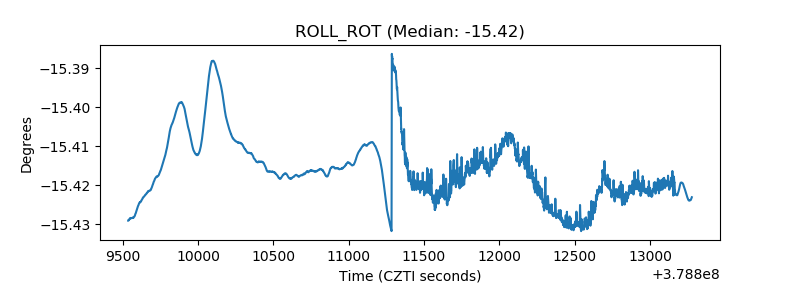 |
| _Roll_DEC |  |
| _Roll_RA | 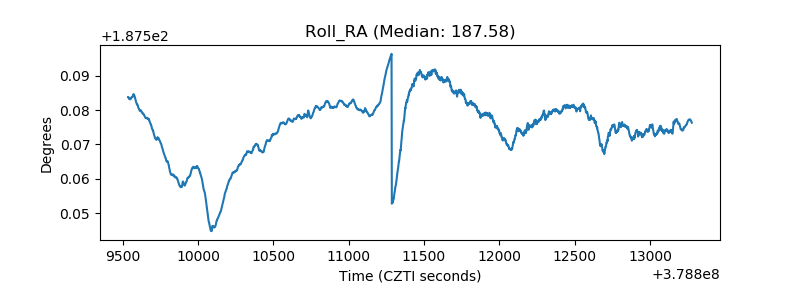 |
| Veto Counter | 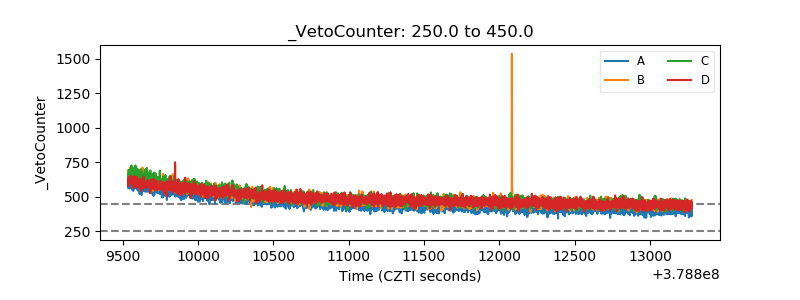 |