| Param | Original file | Final file |
|---|---|---|
| Filename | modeM0/AS1T04_089T01_9000004832cztM0_level2.fits | modeM0/AS1T04_089T01_9000004832cztM0_level2_quad_clean.evt |
| Size (bytes) | 249,396,480 | 201,245,760 |
| Size | 237.8 MB | 191.9 MB |
| Events in quadrant A | 1,589,482 | 1,190,287 |
| Events in quadrant B | 1,465,198 | 1,119,606 |
| Events in quadrant C | 1,538,698 | 1,137,439 |
| Events in quadrant D | 1,315,662 | 1,001,865 |
| Mode M0 | |||
|---|---|---|---|
| Quadrant | BADHDUFLAG | Total packets | Discarded packets |
| A | 0 | 50201 | 0 |
| B | 0 | 61411 | 0 |
| C | 0 | 54894 | 0 |
| D | 0 | 79691 | 0 |
| Mode M9 | |||
|---|---|---|---|
| Quadrant | BADHDUFLAG | Total packets | Discarded packets |
| A | 0 | 121 | 0 |
| B | 0 | 121 | 0 |
| C | 0 | 121 | 0 |
| D | 0 | 121 | 0 |
| Mode SS | |||
|---|---|---|---|
| Quadrant | BADHDUFLAG | Total packets | Discarded packets |
| A | 0 | 490 | 0 |
| B | 0 | 490 | 0 |
| C | 0 | 490 | 0 |
| D | 0 | 490 | 0 |
| Quadrant | Total seconds | Saturated seconds | Saturation percentage |
|---|---|---|---|
| A | 23895 | 30 | 0.125549% |
| B | 23899 | 1062 | 4.443701% |
| C | 23896 | 274 | 1.146635% |
| D | 23893 | 819 | 3.427782% |
Noise dominated data is calculated using 1-second bins in cleaned event files. If a bin has >2000 counts, and if more than 50% of those come from <1% of pixels, then it is considered to be noise-dominated and hence unusable.
| Quadrant | # 1 sec bins | Bins with >0 counts | Bins with >2000 counts | High rate bins dominated by noise | Noise dominated (total time) | Noise dominated (detector-on time) | Marked lightcurve |
|---|---|---|---|---|---|---|---|
| A | 36018 | 23904 | 0 | 0 | 0.00% | 0.00% |  |
| B | 36018 | 23869 | 0 | 0 | 0.00% | 0.00% |  |
| C | 36018 | 23906 | 0 | 0 | 0.00% | 0.00% |  |
| D | 36018 | 23847 | 0 | 0 | 0.00% | 0.00% |  |
Top three noisy pixels from each quadrant. If the there are fewer than three noisy pixels in the level2.evt file, extra rows are filled as -1
| Pixel properties | Quadrant properties | ||||||
|---|---|---|---|---|---|---|---|
| Quadrant | DetID | PixID | Counts | Sigma | Mean | Median | Sigma |
| A | 9 | 19 | 1304 | 8.96 | 414 | 393 | 101.6 |
| A | 0 | 29 | 1289 | 8.82 | 414 | 393 | 101.6 |
| A | 7 | 110 | 1207 | 8.01 | 414 | 393 | 101.6 |
| B | 2 | 9 | 1283 | 11.78 | 388 | 373 | 77.2 |
| B | 3 | 80 | 1212 | 10.86 | 388 | 373 | 77.2 |
| B | 2 | 8 | 999 | 8.11 | 388 | 373 | 77.2 |
| C | 1 | 81 | 1298 | 8.83 | 406 | 386 | 103.3 |
| C | 3 | 202 | 1216 | 8.04 | 406 | 386 | 103.3 |
| C | 1 | 80 | 1208 | 7.96 | 406 | 386 | 103.3 |
| D | 7 | 3 | 984 | 6.44 | 377 | 349 | 98.5 |
| D | 10 | 189 | 970 | 6.3 | 377 | 349 | 98.5 |
| D | 10 | 113 | 969 | 6.29 | 377 | 349 | 98.5 |
Histogram calculated using DETX and DETY for each event in the final _common_clean file
| Quadrant A | 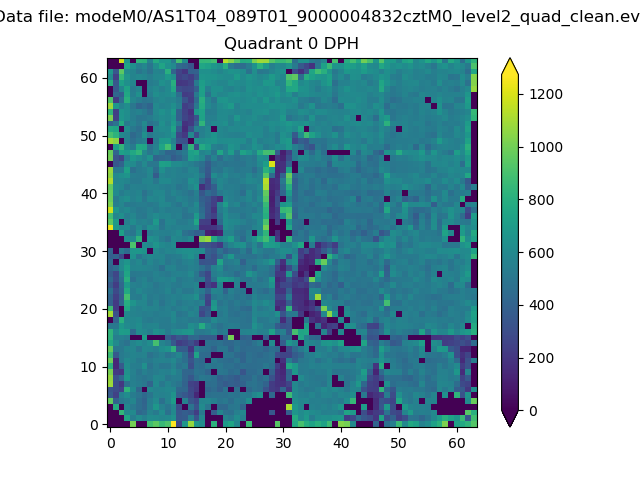 |
 |
Quadrant B |
|---|---|---|---|
| Quadrant D | 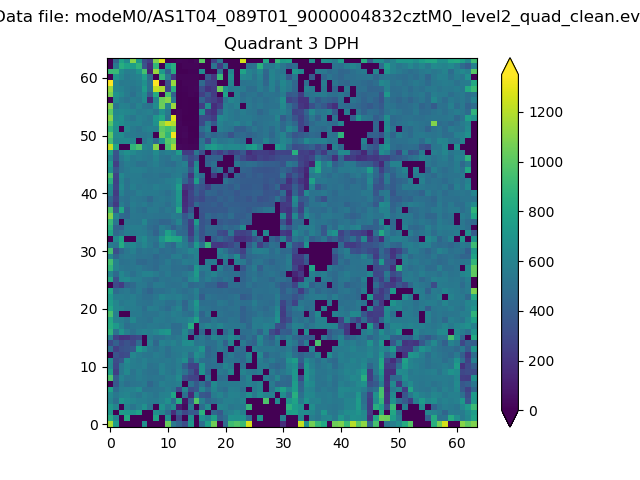 |
 |
Quadrant C |
| Plot type | Count rate plots | Images |
|---|---|---|
| Comparison with Poisson distribution Blue bars denote a histogram of data divided into 1 sec bins. Red curve is a Poisson curve with rate = median count rate of data. |
 |
 |
| Quadrant-wise count rates Data is divided into 100 sec bins |
 |
|
| Module-wise count rates for Quadrant A Data is divided into 100 sec bins |
 |
 |
| Module-wise count rates for Quadrant B Data is divided into 100 sec bins |
 |
 |
| Module-wise count rates for Quadrant C Data is divided into 100 sec bins |
 |
 |
| Module-wise count rates for Quadrant D Data is divided into 100 sec bins |
 |
 |
| Parameter | Plot |
|---|---|
| CZT HV Monitor |  |
| D_VDD |  |
| Temperature 1 |  |
| Veto HV Monitor |  |
| Veto LLD |  |
| Alpha Counter |  |
| _CPM_Rate |  |
| CZT Counter |  |
| +2.5 Volts monitor |  |
| +5 Volts monitor |  |
| _ROLL_ROT |  |
| _Roll_DEC |  |
| _Roll_RA |  |
| Veto Counter |  |