| Param | Original file | Final file |
|---|---|---|
| Filename | modeM0/AS1T04_089T01_9000004832_33860cztM0_level2.evt | modeM0/AS1T04_089T01_9000004832_33860cztM0_level2_quad_clean.evt |
| Size (bytes) | 431,562,240 | 69,632,640 |
| Size | 411.6 MB | 66.4 MB |
| Events in quadrant A | 2,534,500 | 447,398 |
| Events in quadrant B | 3,285,496 | 429,948 |
| Events in quadrant C | 2,797,017 | 448,273 |
| Events in quadrant D | 4,107,054 | 425,630 |
| Mode M0 | |||
|---|---|---|---|
| Quadrant | BADHDUFLAG | Total packets | Discarded packets |
| A | 0 | 10486 | 3 |
| B | 0 | 12985 | 2 |
| C | 0 | 11214 | 2 |
| D | 0 | 15716 | 2 |
| Mode M9 | |||
|---|---|---|---|
| Quadrant | BADHDUFLAG | Total packets | Discarded packets |
| A | 0 | 31 | 0 |
| B | 0 | 31 | 0 |
| C | 0 | 31 | 0 |
| D | 0 | 32 | 0 |
| Mode SS | |||
|---|---|---|---|
| Quadrant | BADHDUFLAG | Total packets | Discarded packets |
| A | 0 | 104 | 0 |
| B | 0 | 104 | 0 |
| C | 0 | 104 | 0 |
| D | 0 | 104 | 0 |
| Quadrant | Total seconds | Saturated seconds | Saturation percentage |
|---|---|---|---|
| A | 5094 | 8 | 0.157048% |
| B | 5094 | 261 | 5.123675% |
| C | 5094 | 78 | 1.531213% |
| D | 5094 | 84 | 1.648999% |
Noise dominated data is calculated using 1-second bins in cleaned event files. If a bin has >2000 counts, and if more than 50% of those come from <1% of pixels, then it is considered to be noise-dominated and hence unusable.
| Quadrant | # 1 sec bins | Bins with >0 counts | Bins with >2000 counts | High rate bins dominated by noise | Noise dominated (total time) | Noise dominated (detector-on time) | Marked lightcurve |
|---|---|---|---|---|---|---|---|
| A | 7096 | 5095 | 0 | 0 | 0.00% | 0.00% |  |
| B | 7096 | 5095 | 179 | 179 | 2.52% | 3.51% | 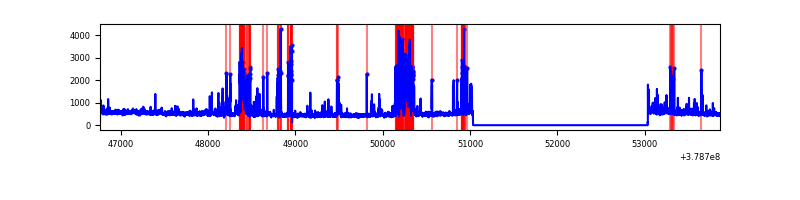 |
| C | 7096 | 5095 | 51 | 51 | 0.72% | 1.00% | 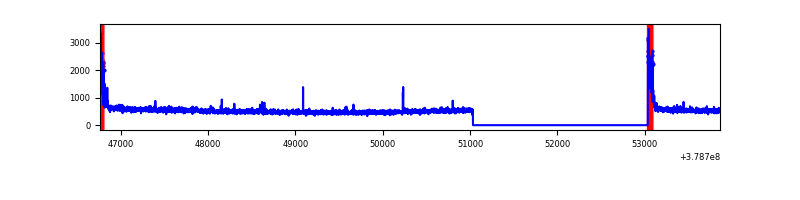 |
| D | 7096 | 5095 | 65 | 65 | 0.92% | 1.28% | 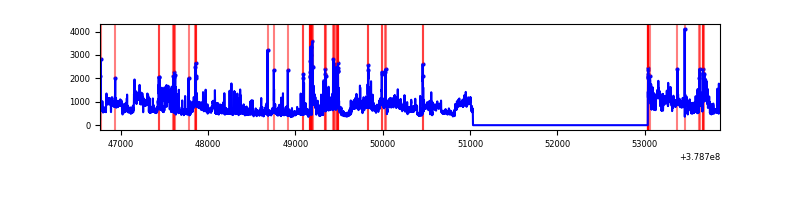 |
Top three noisy pixels from each quadrant. If the there are fewer than three noisy pixels in the level2.evt file, extra rows are filled as -1
| Pixel properties | Quadrant properties | ||||||
|---|---|---|---|---|---|---|---|
| Quadrant | DetID | PixID | Counts | Sigma | Mean | Median | Sigma |
| A | 15 | 169 | 146164 | 1178.41 | 613 | 601 | 123.5 |
| A | 10 | 83 | 11509 | 88.31 | 613 | 601 | 123.5 |
| A | 13 | 6 | 9522 | 72.22 | 613 | 601 | 123.5 |
| B | 5 | 172 | 781276 | 6916.37 | 596 | 582 | 112.9 |
| B | 0 | 229 | 37481 | 326.9 | 596 | 582 | 112.9 |
| B | 15 | 222 | 24850 | 215.0 | 596 | 582 | 112.9 |
| C | 15 | 214 | 219587 | 1592.7 | 597 | 603 | 137.5 |
| C | 0 | 10 | 190993 | 1384.73 | 597 | 603 | 137.5 |
| C | 3 | 233 | 27050 | 192.35 | 597 | 603 | 137.5 |
| D | 8 | 195 | 1041697 | 6449.32 | 593 | 582 | 161.4 |
| D | 12 | 235 | 154287 | 952.15 | 593 | 582 | 161.4 |
| D | 2 | 250 | 103314 | 636.39 | 593 | 582 | 161.4 |
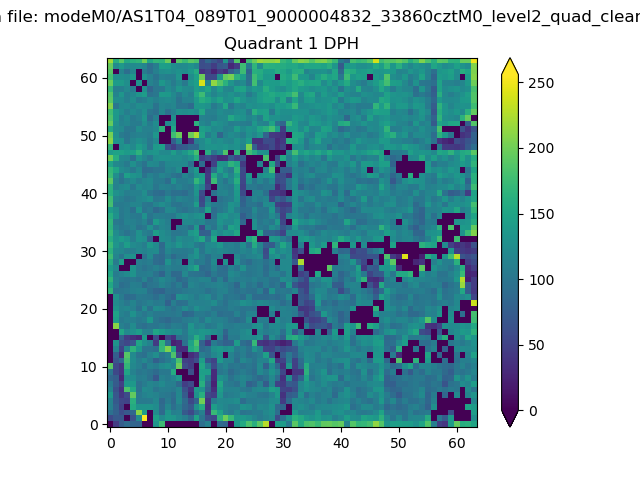
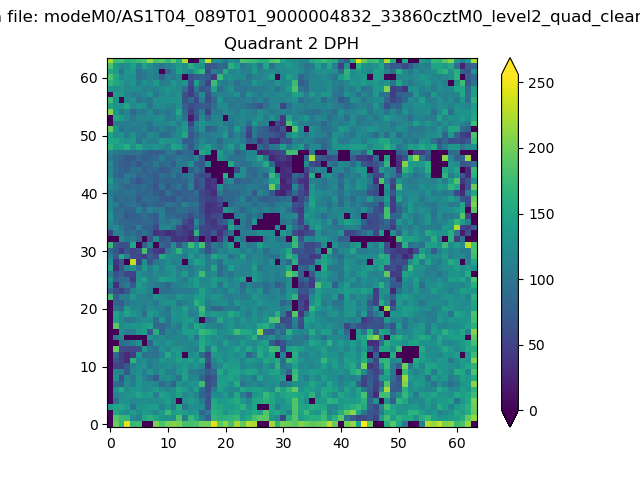
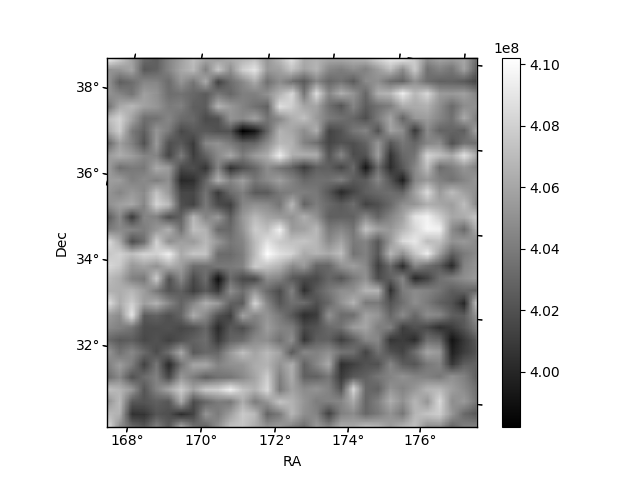
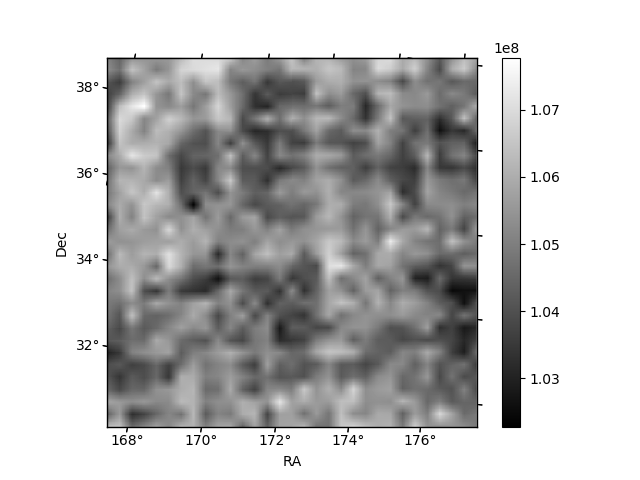
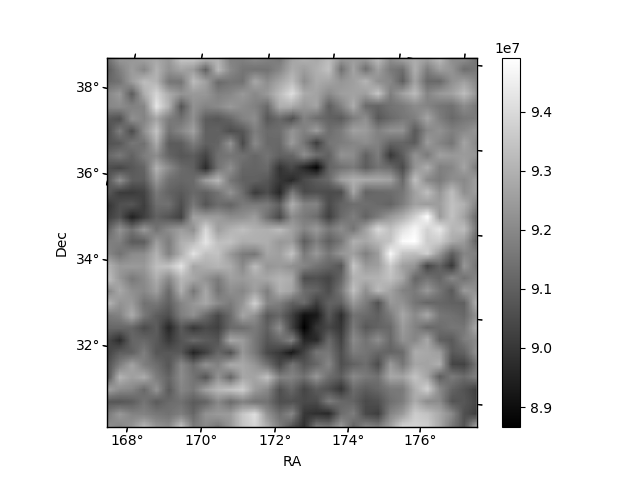
Histogram calculated using DETX and DETY for each event in the final _common_clean file
| Quadrant A | 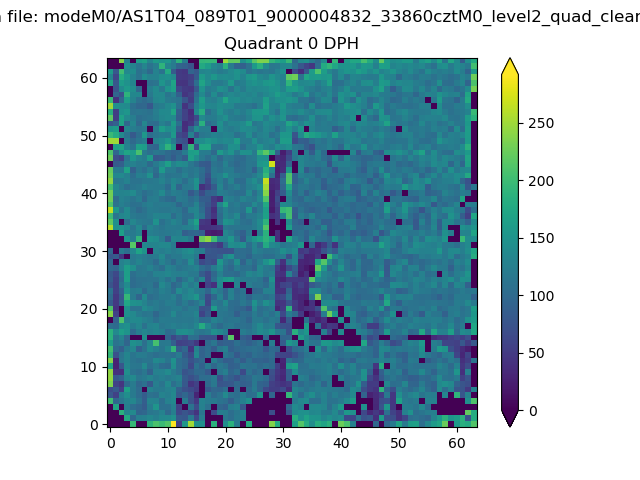 |
 |
Quadrant B |
|---|---|---|---|
| Quadrant D | 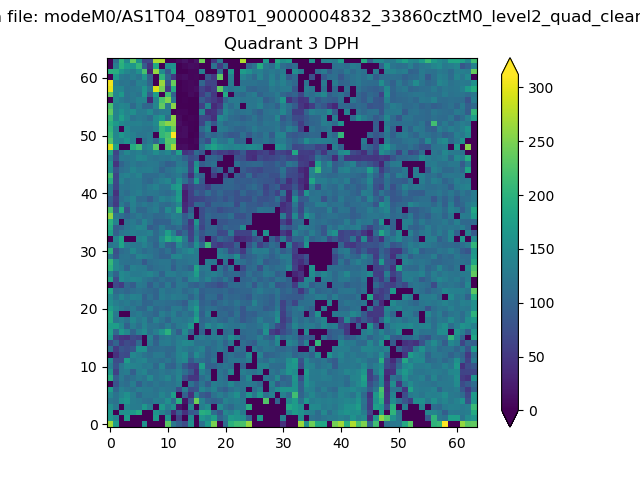 |
 |
Quadrant C |
| Plot type | Count rate plots | Images |
|---|---|---|
| Comparison with Poisson distribution Blue bars denote a histogram of data divided into 1 sec bins. Red curve is a Poisson curve with rate = median count rate of data. |
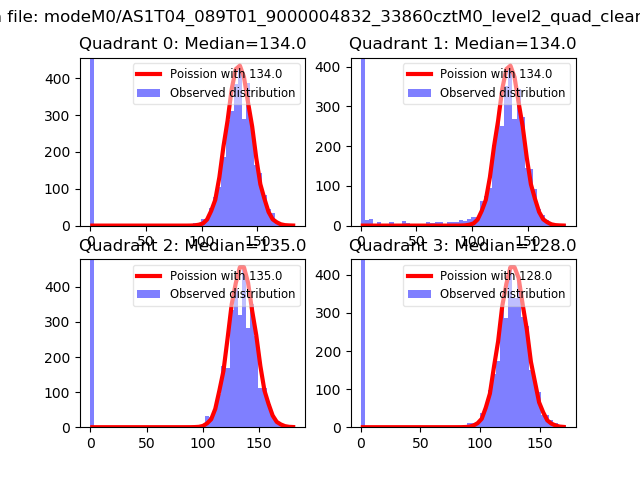 |
 |
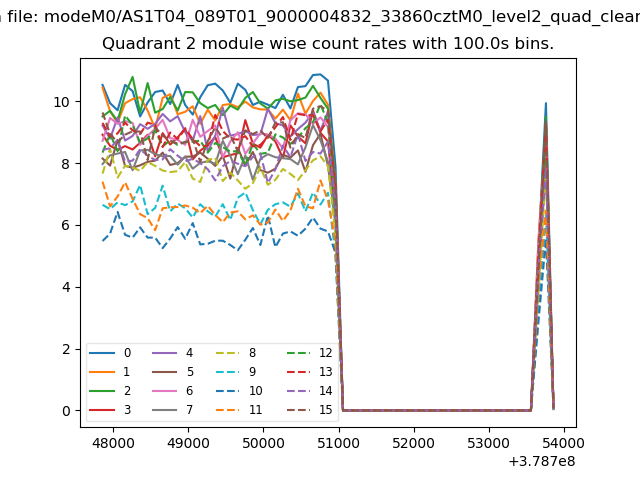
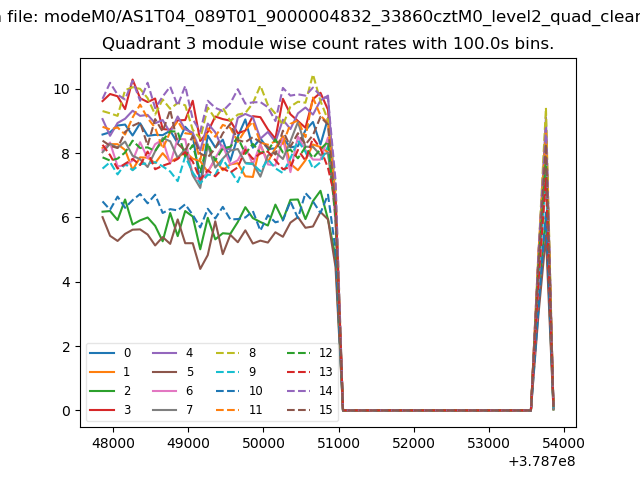
| Quadrant-wise count rates Data is divided into 100 sec bins |
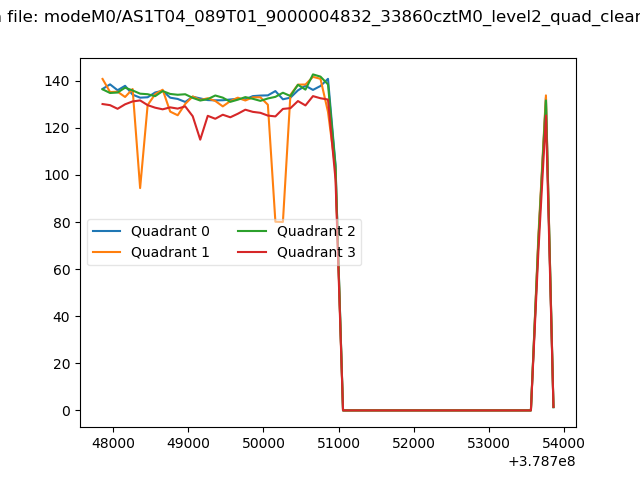 |
|
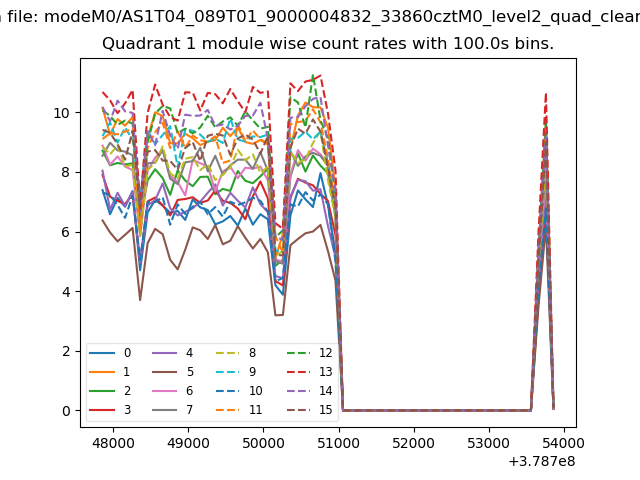
| Module-wise count rates for Quadrant A Data is divided into 100 sec bins |
 |
 |
| Module-wise count rates for Quadrant B Data is divided into 100 sec bins |
 |
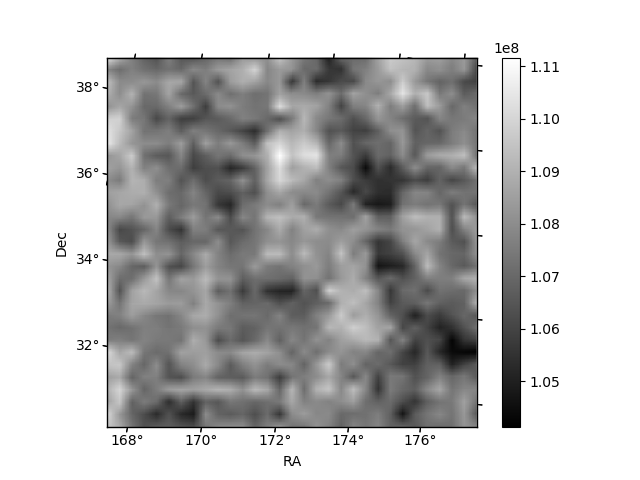 |
| Module-wise count rates for Quadrant C Data is divided into 100 sec bins |
 |
 |
| Module-wise count rates for Quadrant D Data is divided into 100 sec bins |
 |
 |
| Parameter | Plot |
|---|---|
| CZT HV Monitor |  |
| D_VDD | 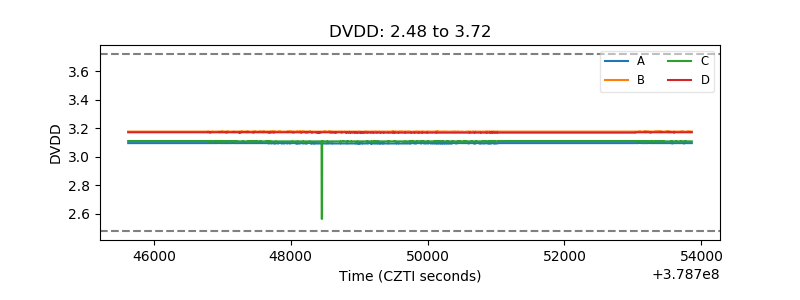 |
| Temperature 1 | 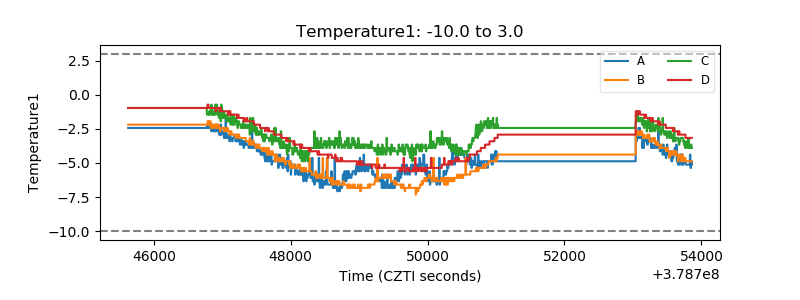 |
| Veto HV Monitor | 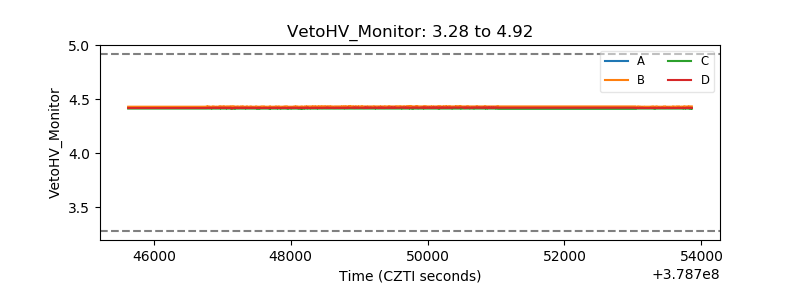 |
| Veto LLD |  |
| Alpha Counter | 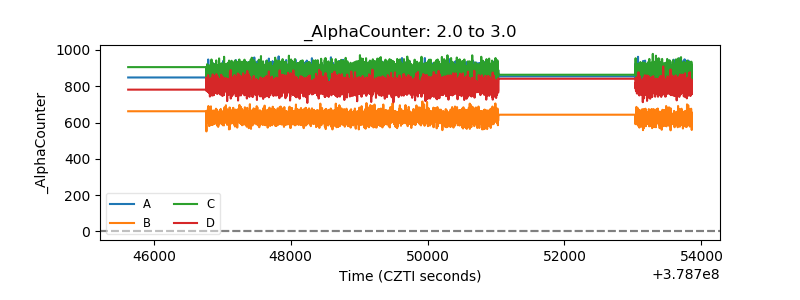 |
| _CPM_Rate | 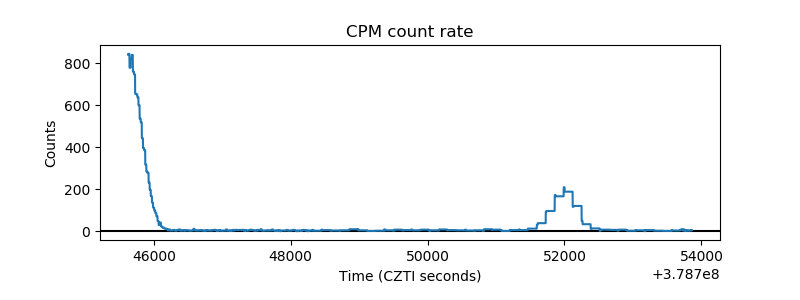 |
| CZT Counter | 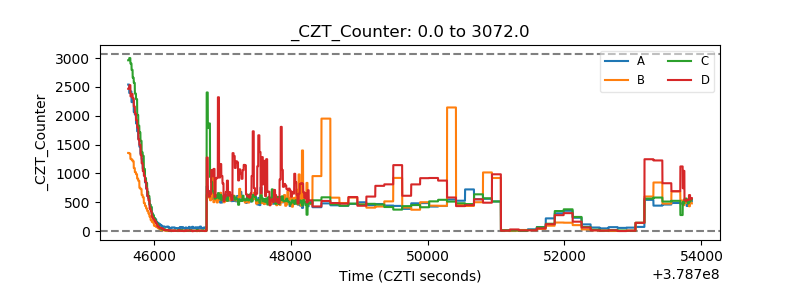 |
| +2.5 Volts monitor |  |
| +5 Volts monitor |  |
| _ROLL_ROT |  |
| _Roll_DEC | 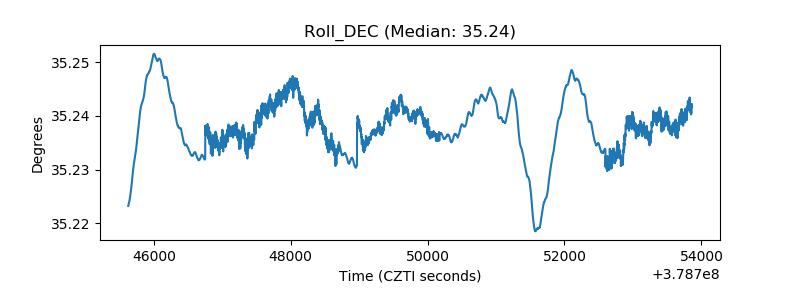 |
| _Roll_RA | 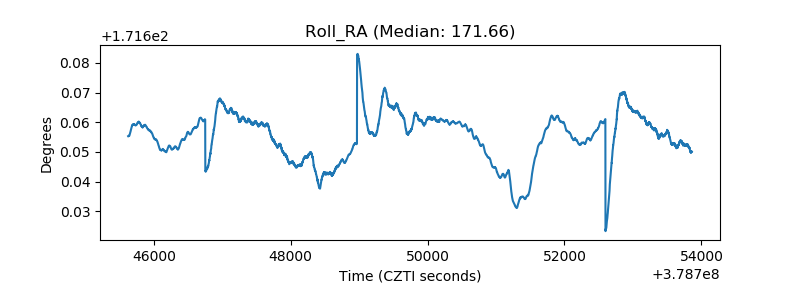 |
| Veto Counter | 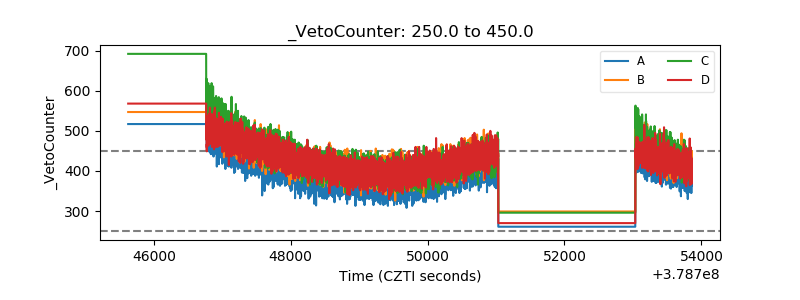 |