| Param | Original file | Final file |
|---|---|---|
| Filename | modeM0/AS1T04_089T01_9000004832_33861cztM0_level2.evt | modeM0/AS1T04_089T01_9000004832_33861cztM0_level2_quad_clean.evt |
| Size (bytes) | 197,087,040 | 32,713,920 |
| Size | 188.0 MB | 31.2 MB |
| Events in quadrant A | 1,103,331 | 210,273 |
| Events in quadrant B | 1,425,813 | 206,015 |
| Events in quadrant C | 1,256,760 | 208,646 |
| Events in quadrant D | 2,024,077 | 198,797 |
| Mode M0 | |||
|---|---|---|---|
| Quadrant | BADHDUFLAG | Total packets | Discarded packets |
| A | 0 | 4689 | 1 |
| B | 0 | 5745 | 1 |
| C | 0 | 5074 | 1 |
| D | 0 | 7560 | 1 |
| Mode M9 | |||
|---|---|---|---|
| Quadrant | BADHDUFLAG | Total packets | Discarded packets |
| A | 0 | 12 | 0 |
| B | 0 | 12 | 0 |
| C | 0 | 12 | 0 |
| D | 0 | 13 | 0 |
| Mode SS | |||
|---|---|---|---|
| Quadrant | BADHDUFLAG | Total packets | Discarded packets |
| A | 0 | 46 | 0 |
| B | 0 | 46 | 0 |
| C | 0 | 46 | 0 |
| D | 0 | 46 | 0 |
| Quadrant | Total seconds | Saturated seconds | Saturation percentage |
|---|---|---|---|
| A | 2309 | 2 | 0.086618% |
| B | 2309 | 77 | 3.334777% |
| C | 2309 | 51 | 2.208748% |
| D | 2309 | 60 | 2.598528% |
Noise dominated data is calculated using 1-second bins in cleaned event files. If a bin has >2000 counts, and if more than 50% of those come from <1% of pixels, then it is considered to be noise-dominated and hence unusable.
| Quadrant | # 1 sec bins | Bins with >0 counts | Bins with >2000 counts | High rate bins dominated by noise | Noise dominated (total time) | Noise dominated (detector-on time) | Marked lightcurve |
|---|---|---|---|---|---|---|---|
| A | 2309 | 2309 | 0 | 0 | 0.00% | 0.00% |  |
| B | 2309 | 2309 | 52 | 52 | 2.25% | 2.25% | 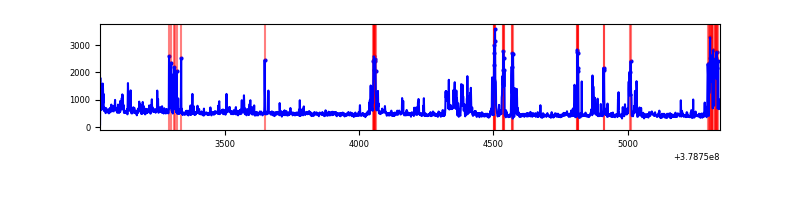 |
| C | 2309 | 2309 | 35 | 35 | 1.52% | 1.52% |  |
| D | 2309 | 2309 | 50 | 50 | 2.17% | 2.17% |  |
Top three noisy pixels from each quadrant. If the there are fewer than three noisy pixels in the level2.evt file, extra rows are filled as -1
| Pixel properties | Quadrant properties | ||||||
|---|---|---|---|---|---|---|---|
| Quadrant | DetID | PixID | Counts | Sigma | Mean | Median | Sigma |
| A | 15 | 169 | 59487 | 1072.25 | 266 | 262 | 55.2 |
| A | 13 | 6 | 8028 | 140.6 | 266 | 262 | 55.2 |
| A | 10 | 83 | 5771 | 99.74 | 266 | 262 | 55.2 |
| B | 5 | 172 | 184389 | 3512.33 | 263 | 256 | 52.4 |
| B | 0 | 229 | 108055 | 2056.26 | 263 | 256 | 52.4 |
| B | 15 | 222 | 24761 | 467.43 | 263 | 256 | 52.4 |
| C | 0 | 10 | 114026 | 1864.76 | 260 | 262 | 61.0 |
| C | 15 | 214 | 98552 | 1611.12 | 260 | 262 | 61.0 |
| C | 3 | 233 | 14727 | 237.1 | 260 | 262 | 61.0 |
| D | 8 | 195 | 631261 | 9097.56 | 257 | 251 | 69.4 |
| D | 2 | 249 | 105820 | 1522.04 | 257 | 251 | 69.4 |
| D | 7 | 38 | 77922 | 1119.82 | 257 | 251 | 69.4 |
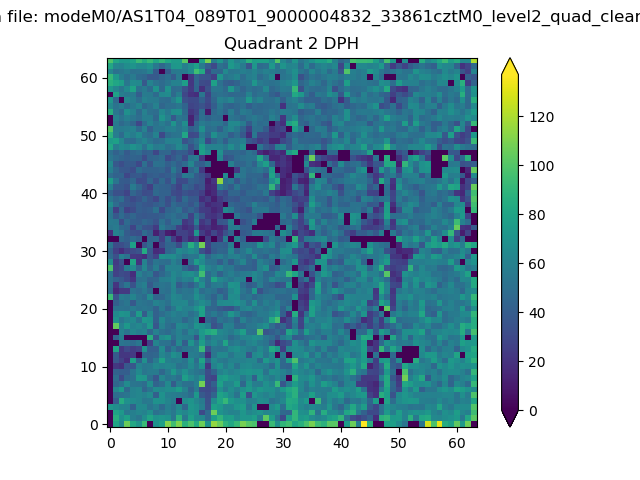
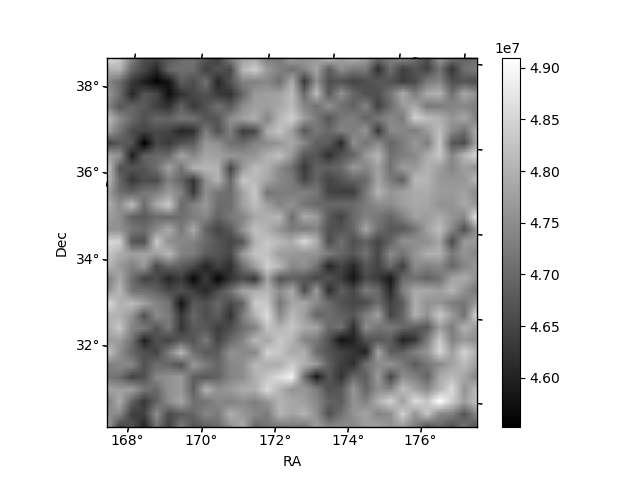
Histogram calculated using DETX and DETY for each event in the final _common_clean file
| Quadrant A | 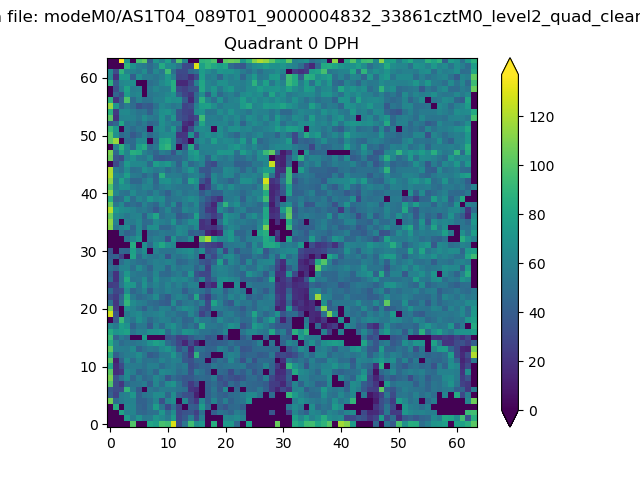 |
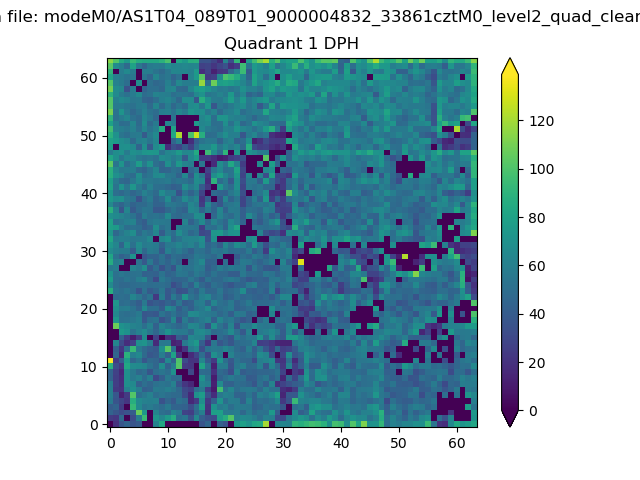 |
Quadrant B |
|---|---|---|---|
| Quadrant D | 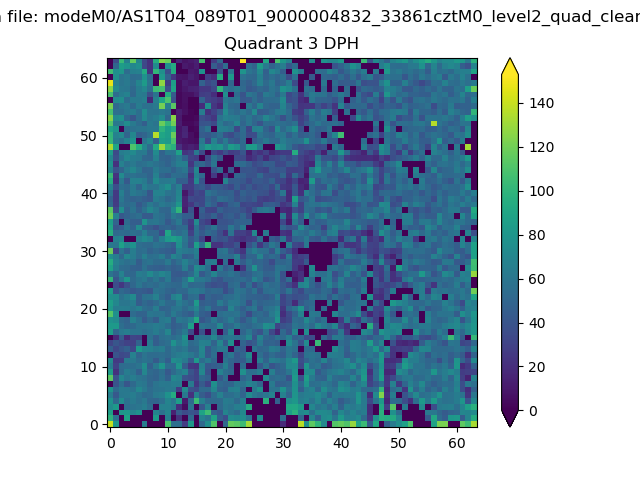 |
 |
Quadrant C |
| Plot type | Count rate plots | Images |
|---|---|---|
| Comparison with Poisson distribution Blue bars denote a histogram of data divided into 1 sec bins. Red curve is a Poisson curve with rate = median count rate of data. |
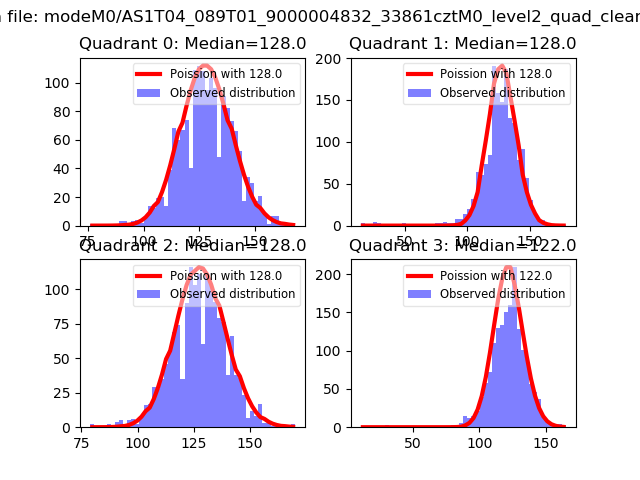 |
 |
| Quadrant-wise count rates Data is divided into 100 sec bins |
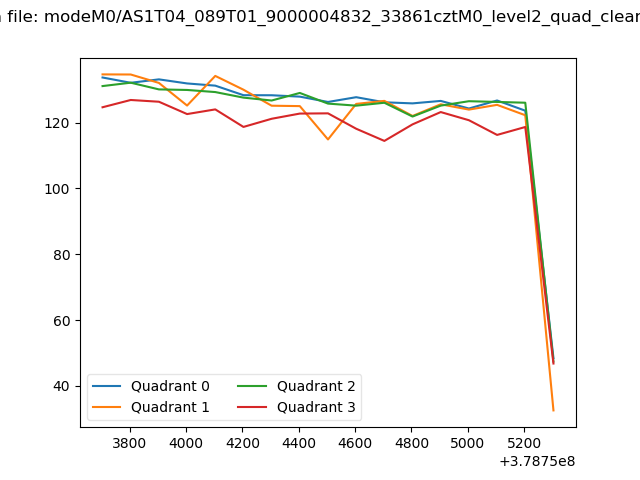 |
|
| Module-wise count rates for Quadrant A Data is divided into 100 sec bins |
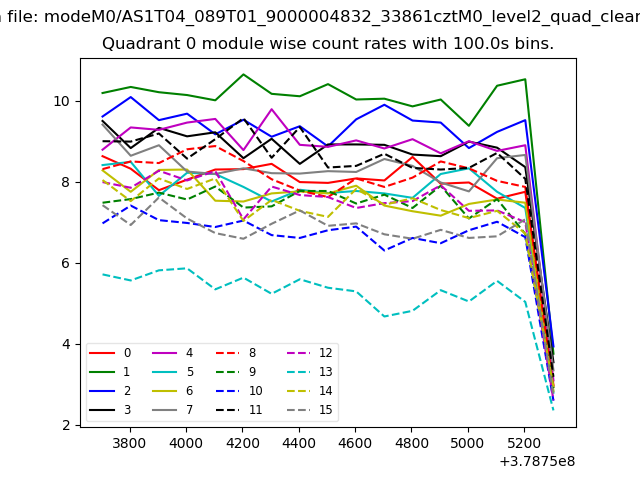 |
 |
| Module-wise count rates for Quadrant B Data is divided into 100 sec bins |
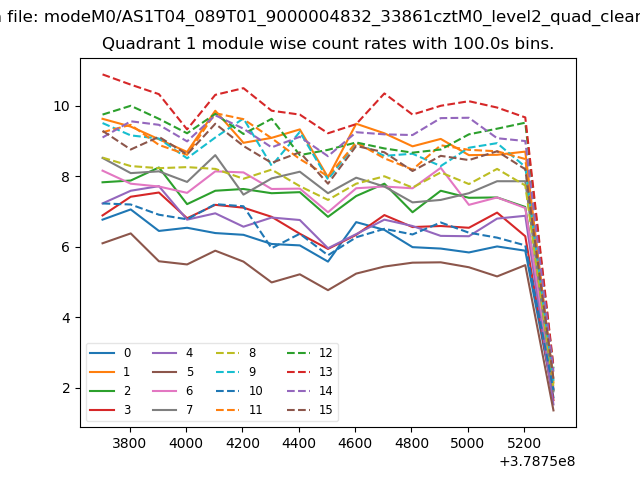 |
 |
| Module-wise count rates for Quadrant C Data is divided into 100 sec bins |
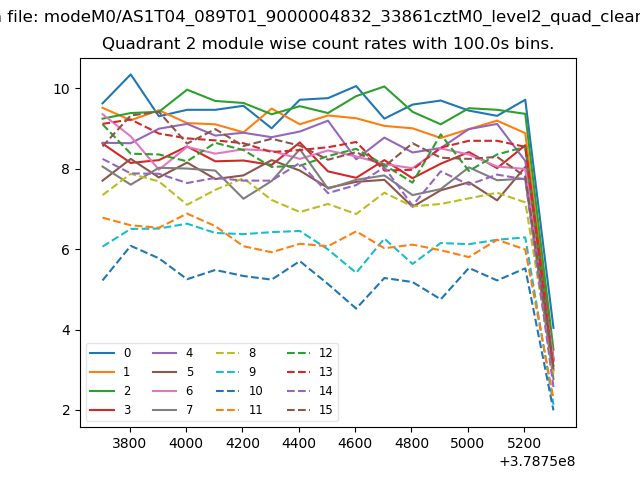 |
 |
| Module-wise count rates for Quadrant D Data is divided into 100 sec bins |
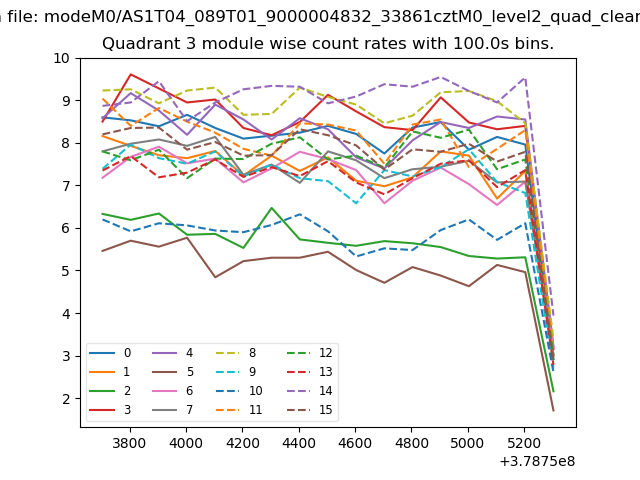 |
 |
| Parameter | Plot |
|---|---|
| CZT HV Monitor | 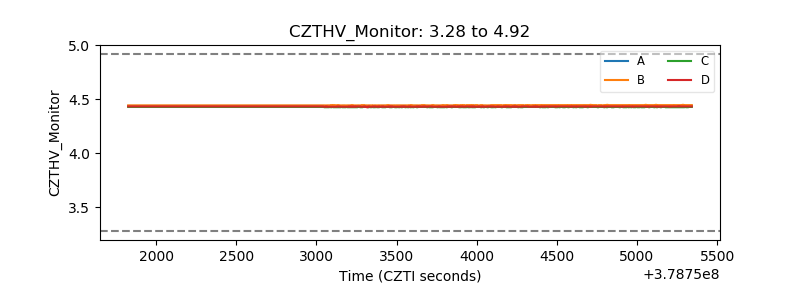 |
| D_VDD | 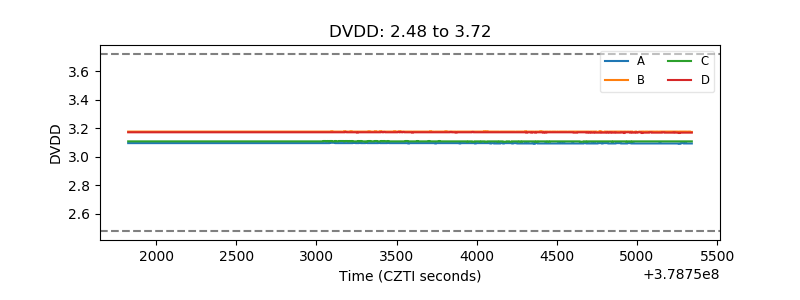 |
| Temperature 1 | 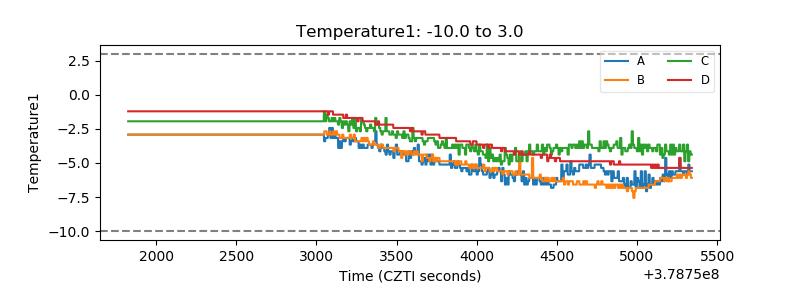 |
| Veto HV Monitor | 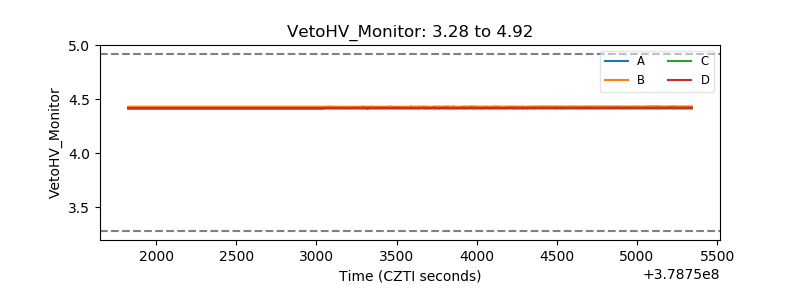 |
| Veto LLD | 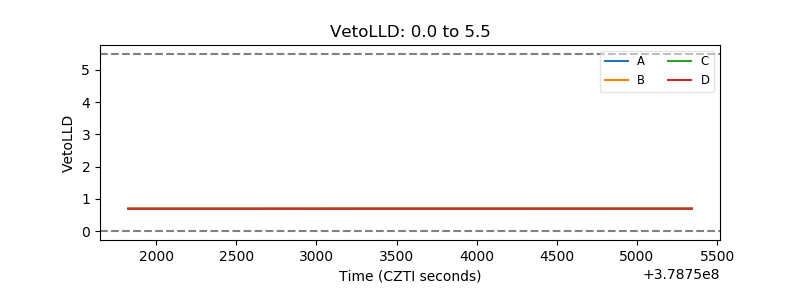 |
| Alpha Counter | 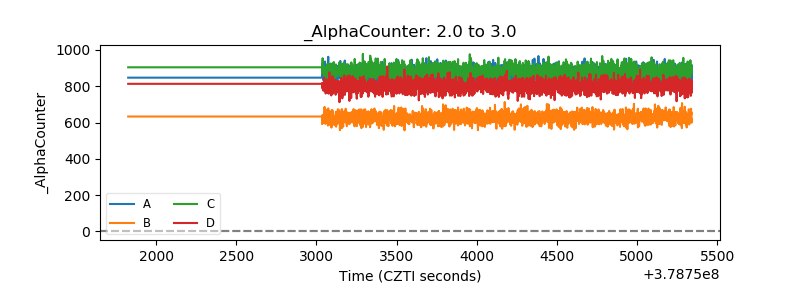 |
| _CPM_Rate | 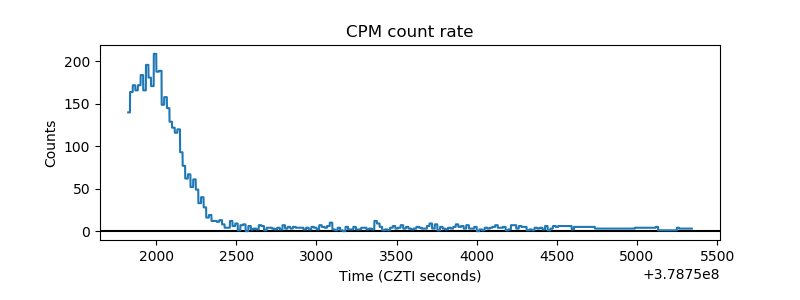 |
| CZT Counter | 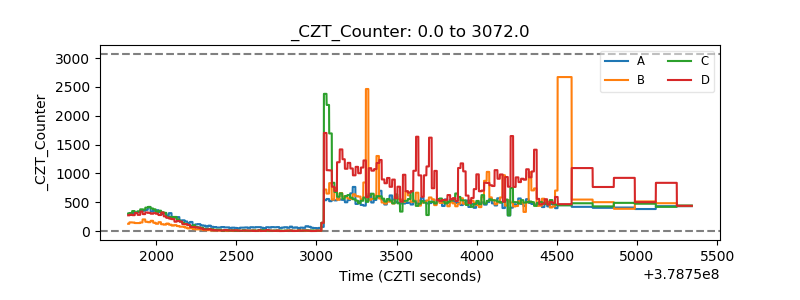 |
| +2.5 Volts monitor |  |
| +5 Volts monitor |  |
| _ROLL_ROT | 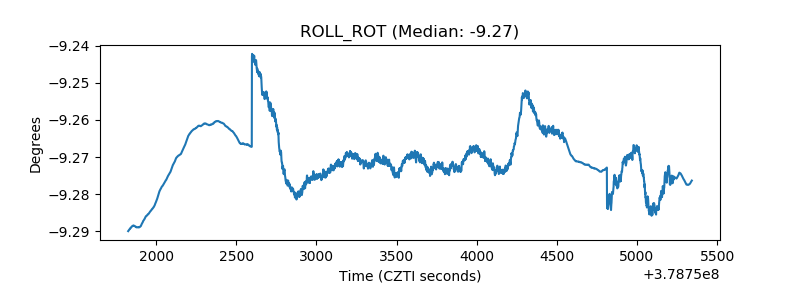 |
| _Roll_DEC | 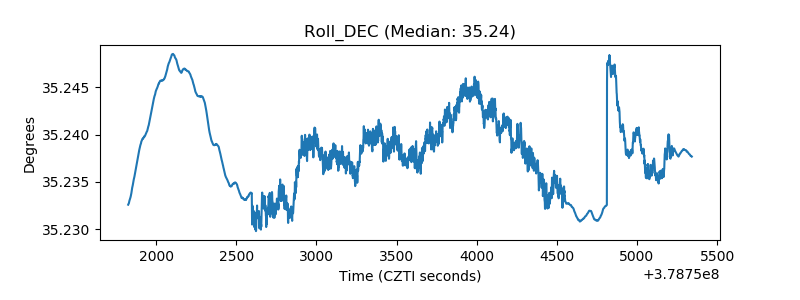 |
| _Roll_RA | 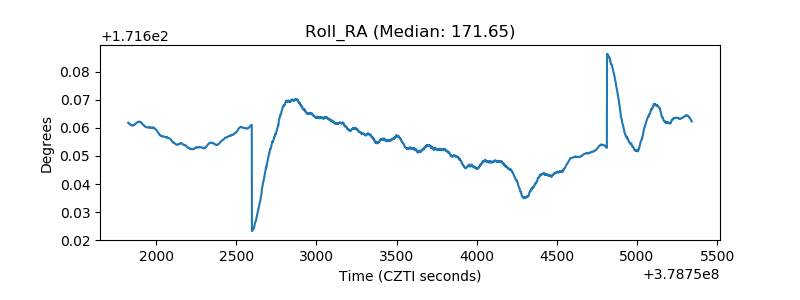 |
| Veto Counter | 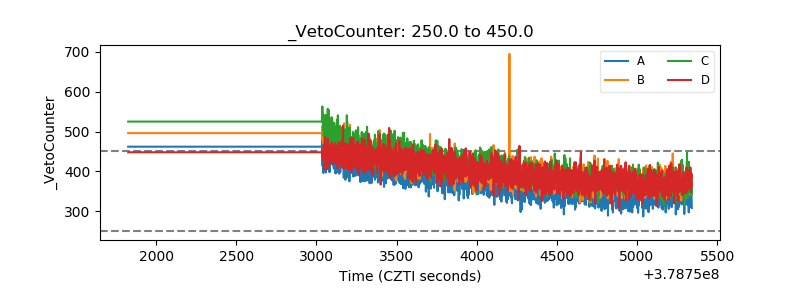 |