| Param | Original file | Final file |
|---|---|---|
| Filename | modeM0/AS1A11_003T10_9000004838cztM0_level2.fits | modeM0/AS1A11_003T10_9000004838cztM0_level2_quad_clean.evt |
| Size (bytes) | 246,957,120 | 241,038,720 |
| Size | 235.5 MB | 229.9 MB |
| Events in quadrant A | 1,491,182 | 1,435,550 |
| Events in quadrant B | 1,434,292 | 1,427,567 |
| Events in quadrant C | 1,474,094 | 1,375,415 |
| Events in quadrant D | 1,265,452 | 1,247,607 |
| Mode M0 | |||
|---|---|---|---|
| Quadrant | BADHDUFLAG | Total packets | Discarded packets |
| A | 0 | 65554 | 0 |
| B | 0 | 62938 | 0 |
| C | 0 | 60997 | 0 |
| D | 0 | 74214 | 0 |
| Mode M9 | |||
|---|---|---|---|
| Quadrant | BADHDUFLAG | Total packets | Discarded packets |
| A | 0 | 75 | 0 |
| B | 0 | 75 | 0 |
| C | 0 | 75 | 0 |
| D | 0 | 75 | 0 |
| Mode SS | |||
|---|---|---|---|
| Quadrant | BADHDUFLAG | Total packets | Discarded packets |
| A | 0 | 536 | 0 |
| B | 0 | 536 | 0 |
| C | 0 | 536 | 0 |
| D | 0 | 536 | 0 |
| Quadrant | Total seconds | Saturated seconds | Saturation percentage |
|---|---|---|---|
| A | 26368 | 1168 | 4.429612% |
| B | 26368 | 715 | 2.711620% |
| C | 26368 | 464 | 1.759709% |
| D | 26368 | 1286 | 4.877124% |
Noise dominated data is calculated using 1-second bins in cleaned event files. If a bin has >2000 counts, and if more than 50% of those come from <1% of pixels, then it is considered to be noise-dominated and hence unusable.
| Quadrant | # 1 sec bins | Bins with >0 counts | Bins with >2000 counts | High rate bins dominated by noise | Noise dominated (total time) | Noise dominated (detector-on time) | Marked lightcurve |
|---|---|---|---|---|---|---|---|
| A | 33773 | 26368 | 0 | 0 | 0.00% | 0.00% |  |
| B | 33773 | 26366 | 0 | 0 | 0.00% | 0.00% |  |
| C | 33773 | 26367 | 0 | 0 | 0.00% | 0.00% |  |
| D | 33773 | 26351 | 0 | 0 | 0.00% | 0.00% |  |
Top three noisy pixels from each quadrant. If the there are fewer than three noisy pixels in the level2.evt file, extra rows are filled as -1
| Pixel properties | Quadrant properties | ||||||
|---|---|---|---|---|---|---|---|
| Quadrant | DetID | PixID | Counts | Sigma | Mean | Median | Sigma |
| A | 9 | 19 | 1208 | 8.6 | 388 | 365 | 98.0 |
| A | 7 | 110 | 1202 | 8.54 | 388 | 365 | 98.0 |
| A | 0 | 29 | 1201 | 8.53 | 388 | 365 | 98.0 |
| B | 2 | 9 | 1242 | 11.64 | 380 | 364 | 75.4 |
| B | 3 | 80 | 1134 | 10.21 | 380 | 364 | 75.4 |
| B | 2 | 8 | 994 | 8.35 | 380 | 364 | 75.4 |
| C | 1 | 80 | 1225 | 8.66 | 390 | 367 | 99.1 |
| C | 1 | 81 | 1207 | 8.48 | 390 | 367 | 99.1 |
| C | 3 | 158 | 1015 | 6.54 | 390 | 367 | 99.1 |
| D | 3 | 14 | 983 | 6.69 | 362 | 332 | 97.3 |
| D | 7 | 3 | 939 | 6.24 | 362 | 332 | 97.3 |
| D | 4 | 160 | 922 | 6.06 | 362 | 332 | 97.3 |
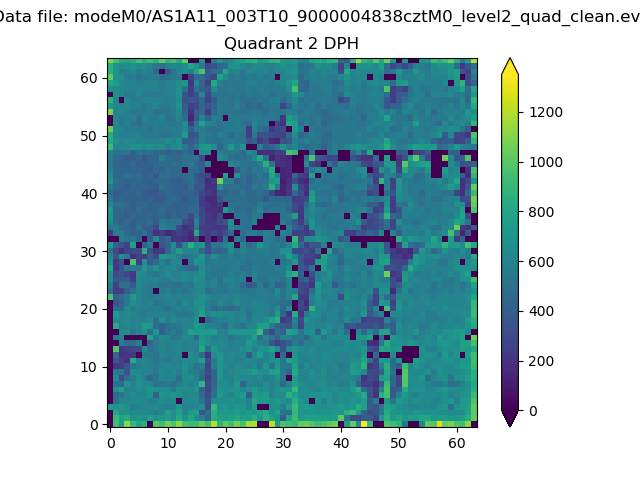
Histogram calculated using DETX and DETY for each event in the final _common_clean file
| Quadrant A | 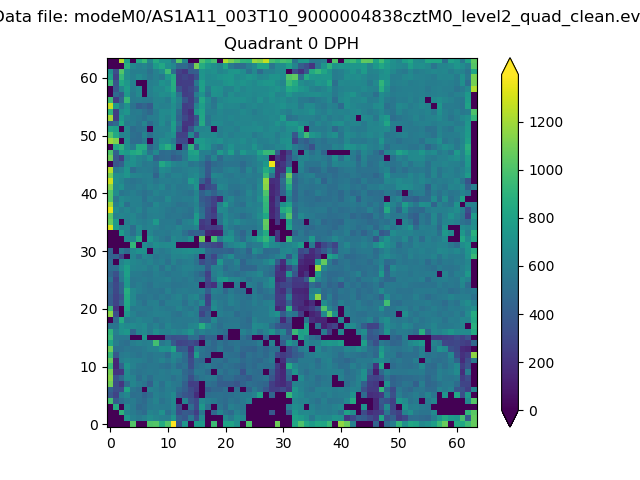 |
 |
Quadrant B |
|---|---|---|---|
| Quadrant D |  |
 |
Quadrant C |
| Plot type | Count rate plots | Images |
|---|---|---|
| Comparison with Poisson distribution Blue bars denote a histogram of data divided into 1 sec bins. Red curve is a Poisson curve with rate = median count rate of data. |
 |
 |
| Quadrant-wise count rates Data is divided into 100 sec bins |
 |
|
| Module-wise count rates for Quadrant A Data is divided into 100 sec bins |
 |
 |
| Module-wise count rates for Quadrant B Data is divided into 100 sec bins |
 |
 |
| Module-wise count rates for Quadrant C Data is divided into 100 sec bins |
 |
 |
| Module-wise count rates for Quadrant D Data is divided into 100 sec bins |
 |
 |
| Parameter | Plot |
|---|---|
| CZT HV Monitor |  |
| D_VDD | 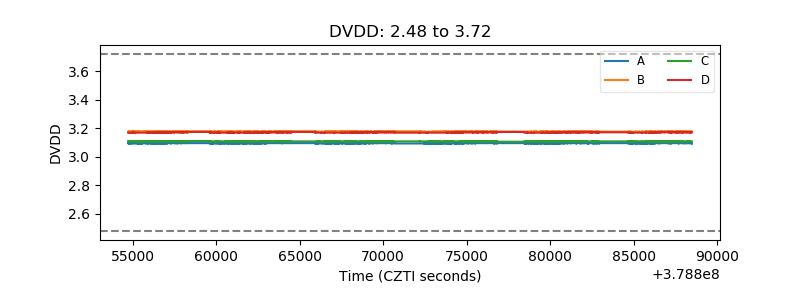 |
| Temperature 1 |  |
| Veto HV Monitor |  |
| Veto LLD |  |
| Alpha Counter |  |
| _CPM_Rate |  |
| CZT Counter |  |
| +2.5 Volts monitor |  |
| +5 Volts monitor |  |
| _ROLL_ROT |  |
| _Roll_DEC |  |
| _Roll_RA |  |
| Veto Counter |  |