| Param | Original file | Final file |
|---|---|---|
| Filename | modeM0/AS1A11_003T10_9000004838_33878cztM0_level2.evt | modeM0/AS1A11_003T10_9000004838_33878cztM0_level2_quad_clean.evt |
| Size (bytes) | 65,177,280 | 15,168,960 |
| Size | 62.2 MB | 14.5 MB |
| Events in quadrant A | 340,173 | 102,371 |
| Events in quadrant B | 402,553 | 102,167 |
| Events in quadrant C | 416,609 | 98,217 |
| Events in quadrant D | 753,813 | 89,508 |
| Mode M0 | |||
|---|---|---|---|
| Quadrant | BADHDUFLAG | Total packets | Discarded packets |
| A | 0 | 1684 | 1 |
| B | 0 | 1800 | 0 |
| C | 0 | 1739 | 0 |
| D | 0 | 2833 | 0 |
| Mode SS | |||
|---|---|---|---|
| Quadrant | BADHDUFLAG | Total packets | Discarded packets |
| A | 0 | 18 | 0 |
| B | 0 | 18 | 0 |
| C | 0 | 18 | 0 |
| D | 0 | 18 | 0 |
| Quadrant | Total seconds | Saturated seconds | Saturation percentage |
|---|---|---|---|
| A | 842 | 0 | 0.000000% |
| B | 842 | 6 | 0.712589% |
| C | 842 | 0 | 0.000000% |
| D | 842 | 90 | 10.688836% |
Noise dominated data is calculated using 1-second bins in cleaned event files. If a bin has >2000 counts, and if more than 50% of those come from <1% of pixels, then it is considered to be noise-dominated and hence unusable.
| Quadrant | # 1 sec bins | Bins with >0 counts | Bins with >2000 counts | High rate bins dominated by noise | Noise dominated (total time) | Noise dominated (detector-on time) | Marked lightcurve |
|---|---|---|---|---|---|---|---|
| A | 842 | 842 | 0 | 0 | 0.00% | 0.00% | 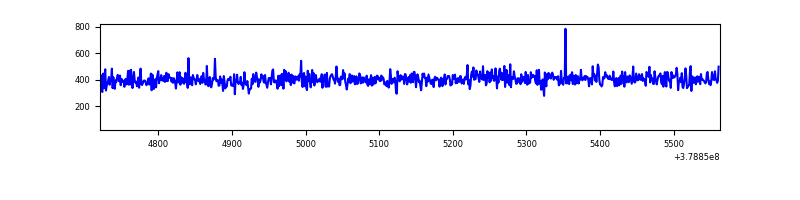 |
| B | 842 | 842 | 5 | 5 | 0.59% | 0.59% | 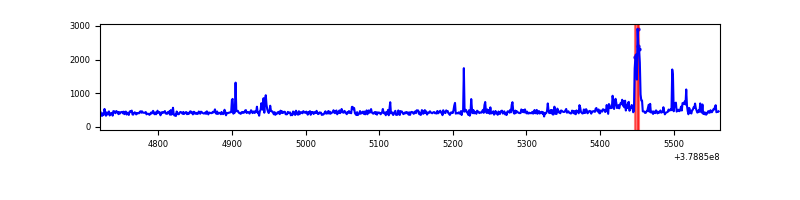 |
| C | 842 | 842 | 1 | 1 | 0.12% | 0.12% | 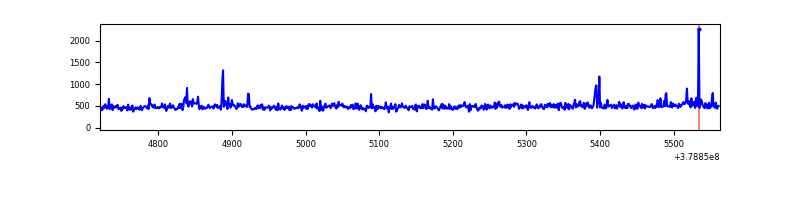 |
| D | 842 | 842 | 85 | 85 | 10.10% | 10.10% | 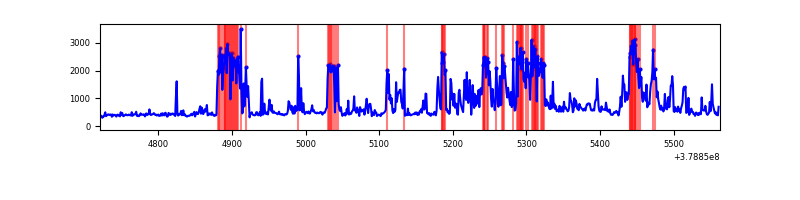 |
Top three noisy pixels from each quadrant. If the there are fewer than three noisy pixels in the level2.evt file, extra rows are filled as -1
| Pixel properties | Quadrant properties | ||||||
|---|---|---|---|---|---|---|---|
| Quadrant | DetID | PixID | Counts | Sigma | Mean | Median | Sigma |
| A | 13 | 254 | 1502 | 71.21 | 87 | 85 | 19.9 |
| A | 3 | 137 | 877 | 39.8 | 87 | 85 | 19.9 |
| A | 0 | 226 | 712 | 31.51 | 87 | 85 | 19.9 |
| B | 5 | 172 | 24753 | 1321.64 | 88 | 85 | 18.7 |
| B | 4 | 232 | 11012 | 585.44 | 88 | 85 | 18.7 |
| B | 4 | 251 | 7400 | 391.92 | 88 | 85 | 18.7 |
| C | 15 | 214 | 34673 | 1573.66 | 88 | 88 | 22.0 |
| C | 3 | 233 | 14794 | 669.14 | 88 | 88 | 22.0 |
| C | 0 | 207 | 7621 | 342.76 | 88 | 88 | 22.0 |
| D | 2 | 250 | 222743 | 10044.26 | 82 | 80 | 22.2 |
| D | 13 | 249 | 146119 | 6587.78 | 82 | 80 | 22.2 |
| D | 8 | 195 | 38099 | 1715.03 | 82 | 80 | 22.2 |
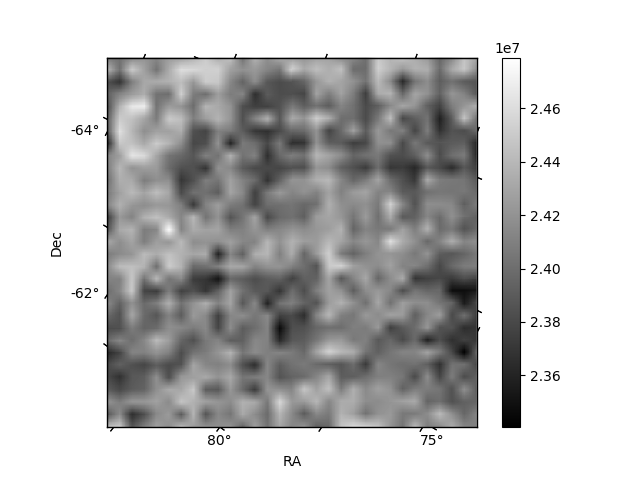
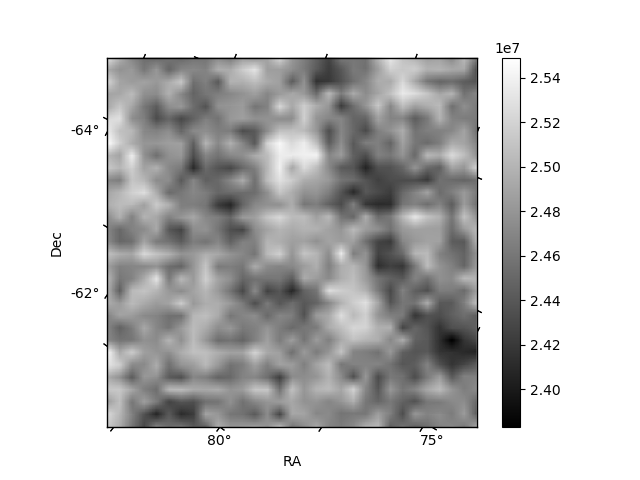
Histogram calculated using DETX and DETY for each event in the final _common_clean file
| Quadrant A |  |
 |
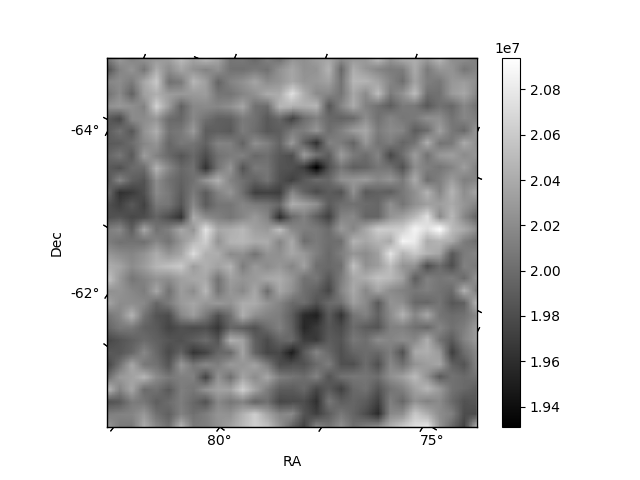
Quadrant B |
|---|---|---|---|
| Quadrant D | 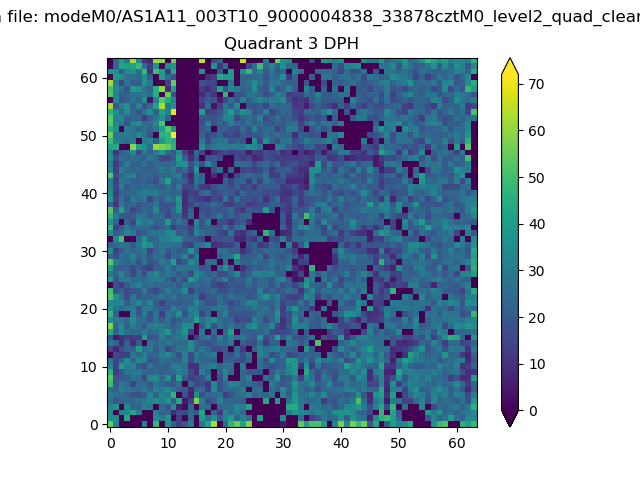 |
 |
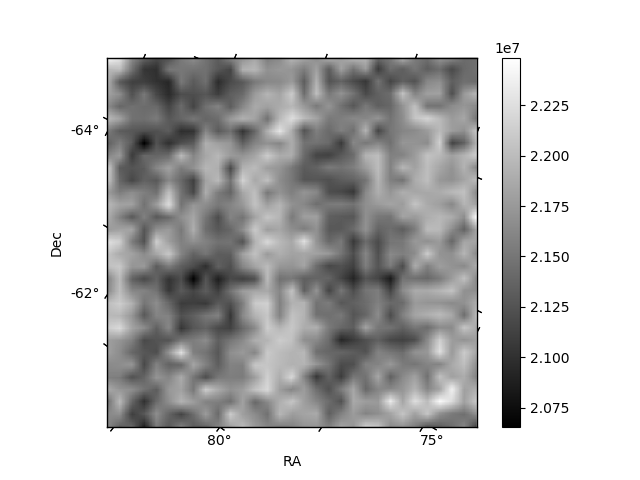
Quadrant C |
| Plot type | Count rate plots | Images |
|---|---|---|
| Comparison with Poisson distribution Blue bars denote a histogram of data divided into 1 sec bins. Red curve is a Poisson curve with rate = median count rate of data. |
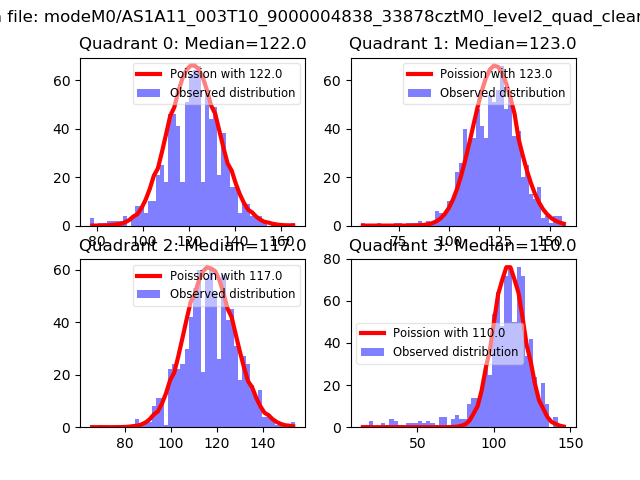 |
 |
| Quadrant-wise count rates Data is divided into 100 sec bins |
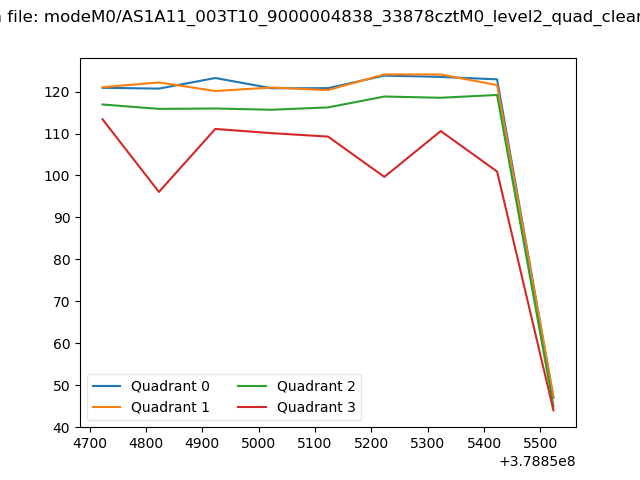 |
|
| Module-wise count rates for Quadrant A Data is divided into 100 sec bins |
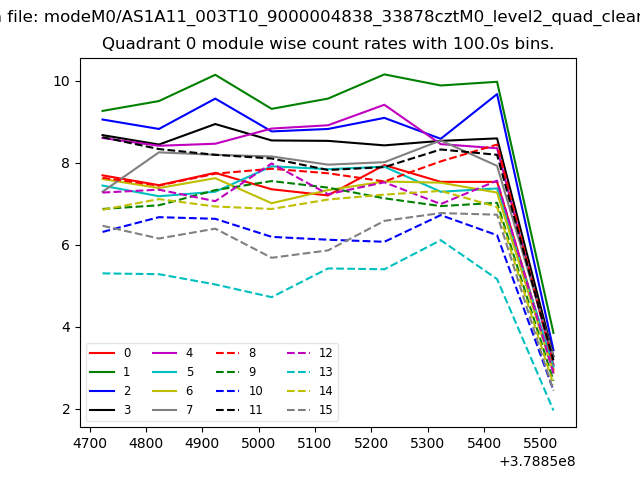 |
 |
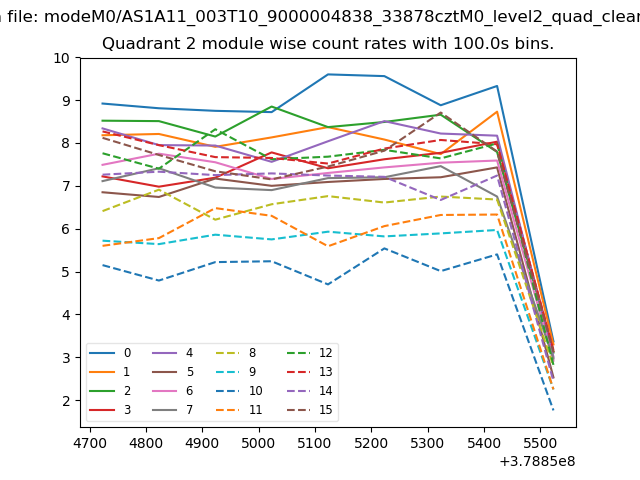
| Module-wise count rates for Quadrant B Data is divided into 100 sec bins |
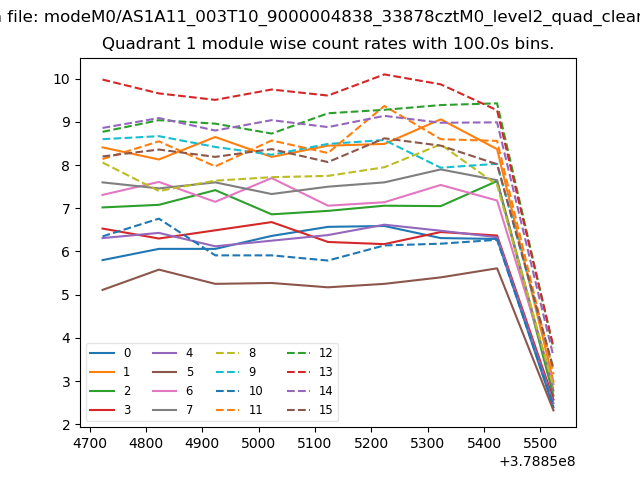 |
 |
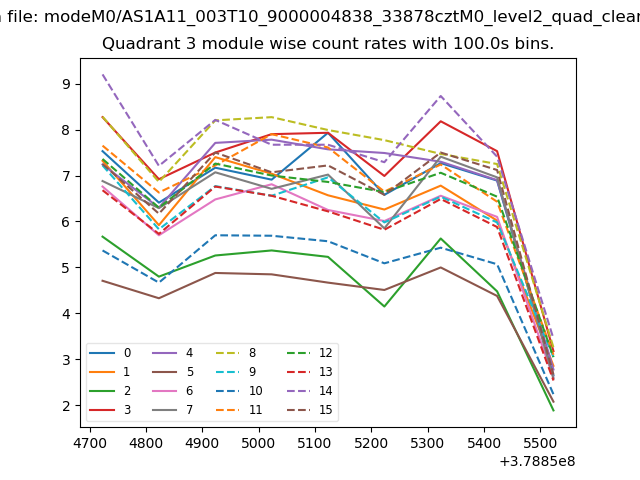
| Module-wise count rates for Quadrant C Data is divided into 100 sec bins |
 |
 |
| Module-wise count rates for Quadrant D Data is divided into 100 sec bins |
 |
 |
| Parameter | Plot |
|---|---|
| CZT HV Monitor |  |
| D_VDD | 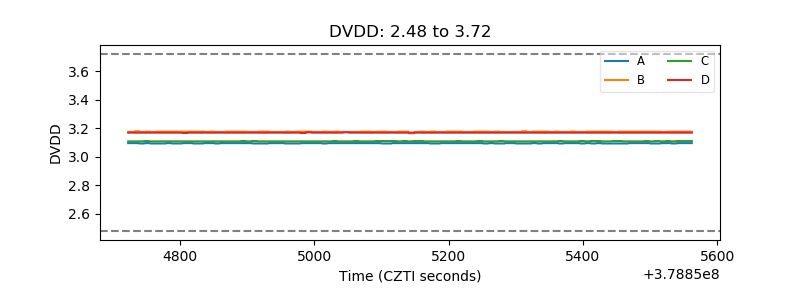 |
| Temperature 1 | 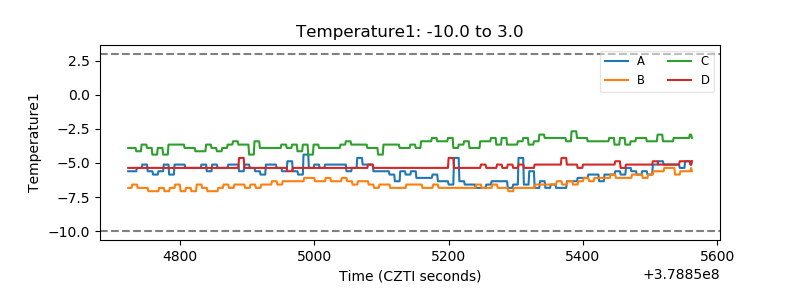 |
| Veto HV Monitor | 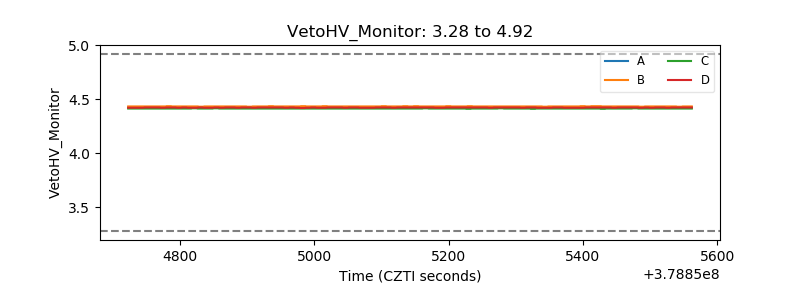 |
| Veto LLD | 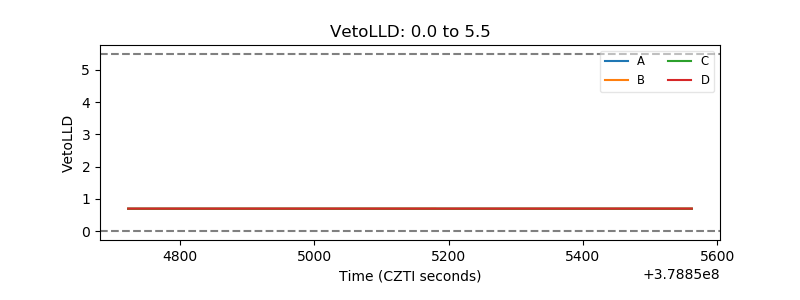 |
| Alpha Counter | 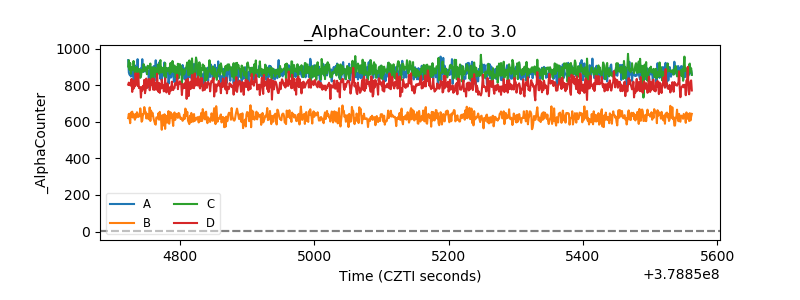 |
| _CPM_Rate | 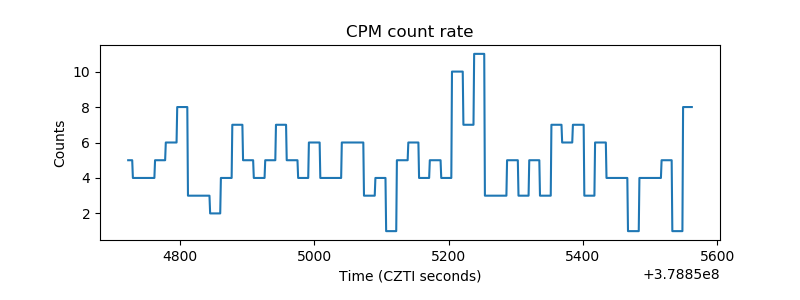 |
| CZT Counter | 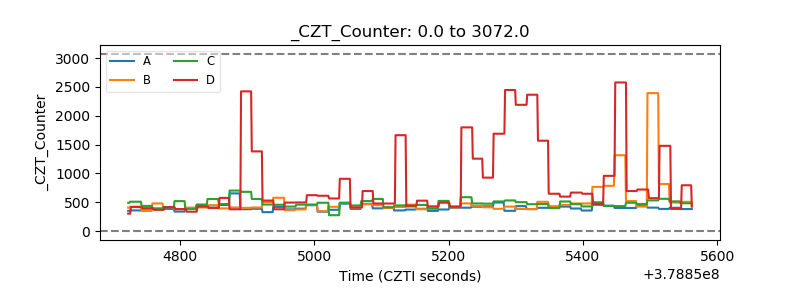 |
| +2.5 Volts monitor |  |
| +5 Volts monitor |  |
| _ROLL_ROT | 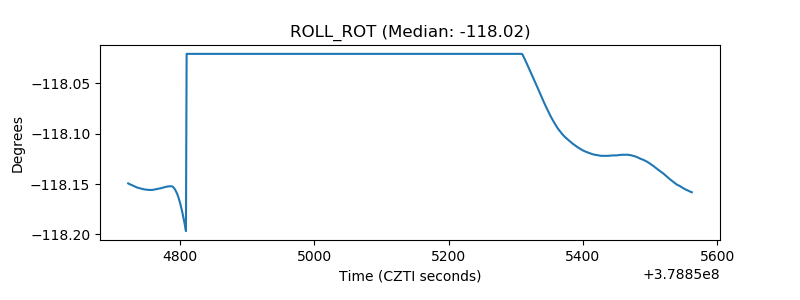 |
| _Roll_DEC | 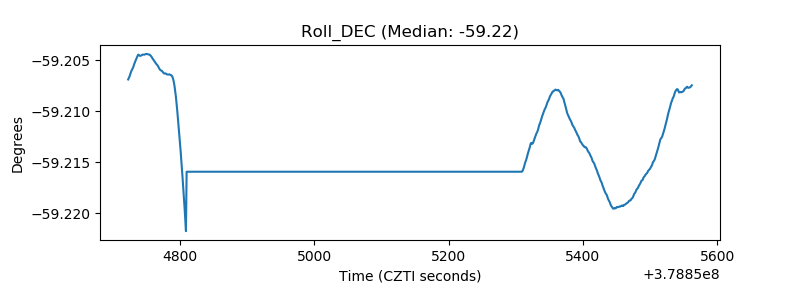 |
| _Roll_RA | 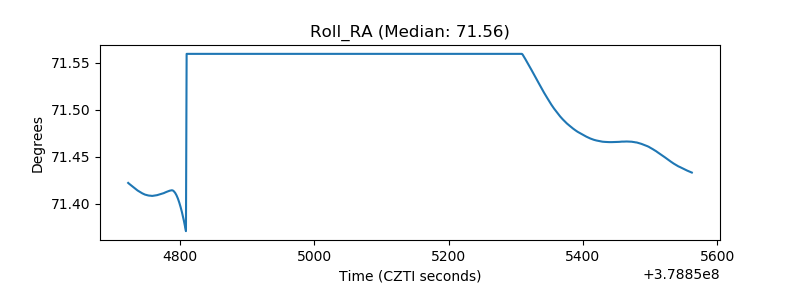 |
| Veto Counter | 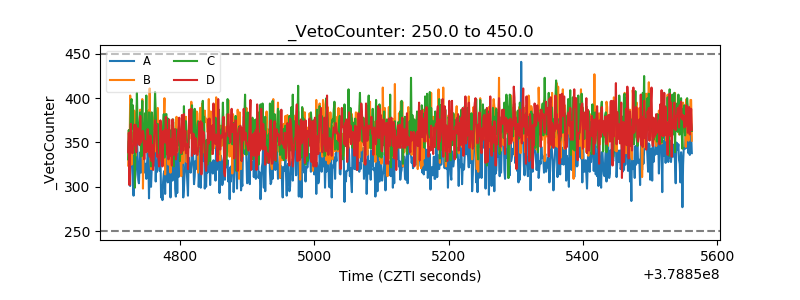 |