| Param | Original file | Final file |
|---|---|---|
| Filename | modeM0/AS1A11_003T10_9000004838_33880cztM0_level2.evt | modeM0/AS1A11_003T10_9000004838_33880cztM0_level2_quad_clean.evt |
| Size (bytes) | 1,082,134,080 | 183,090,240 |
| Size | 1.0 GB | 174.6 MB |
| Events in quadrant A | 6,371,846 | 1,179,169 |
| Events in quadrant B | 7,412,866 | 1,175,431 |
| Events in quadrant C | 8,265,003 | 1,149,316 |
| Events in quadrant D | 9,795,318 | 1,092,570 |
| Mode M0 | |||
|---|---|---|---|
| Quadrant | BADHDUFLAG | Total packets | Discarded packets |
| A | 0 | 27987 | 4 |
| B | 0 | 30954 | 3 |
| C | 0 | 32650 | 3 |
| D | 0 | 38316 | 3 |
| Mode M9 | |||
|---|---|---|---|
| Quadrant | BADHDUFLAG | Total packets | Discarded packets |
| A | 0 | 42 | 0 |
| B | 0 | 42 | 0 |
| C | 0 | 42 | 0 |
| D | 0 | 42 | 0 |
| Mode SS | |||
|---|---|---|---|
| Quadrant | BADHDUFLAG | Total packets | Discarded packets |
| A | 0 | 280 | 0 |
| B | 0 | 280 | 0 |
| C | 0 | 280 | 0 |
| D | 0 | 280 | 0 |
| Quadrant | Total seconds | Saturated seconds | Saturation percentage |
|---|---|---|---|
| A | 13735 | 30 | 0.218420% |
| B | 13735 | 202 | 1.470695% |
| C | 13735 | 315 | 2.293411% |
| D | 13735 | 537 | 3.909720% |
Noise dominated data is calculated using 1-second bins in cleaned event files. If a bin has >2000 counts, and if more than 50% of those come from <1% of pixels, then it is considered to be noise-dominated and hence unusable.
| Quadrant | # 1 sec bins | Bins with >0 counts | Bins with >2000 counts | High rate bins dominated by noise | Noise dominated (total time) | Noise dominated (detector-on time) | Marked lightcurve |
|---|---|---|---|---|---|---|---|
| A | 17854 | 13738 | 11 | 11 | 0.06% | 0.08% | 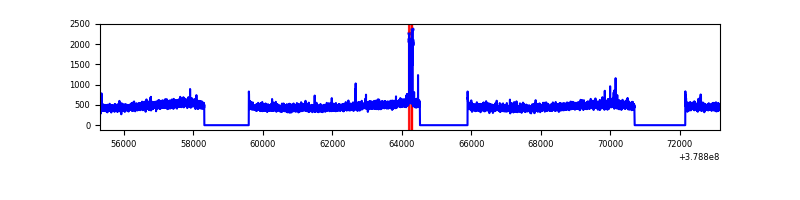 |
| B | 17854 | 13738 | 103 | 103 | 0.58% | 0.75% | 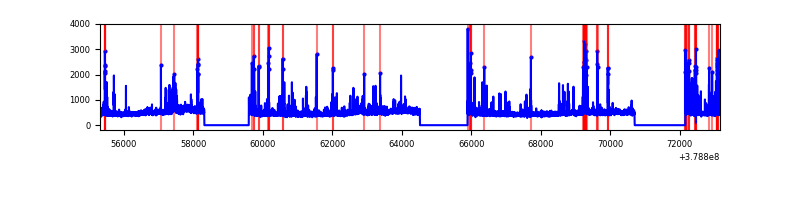 |
| C | 17854 | 13738 | 250 | 250 | 1.40% | 1.82% | 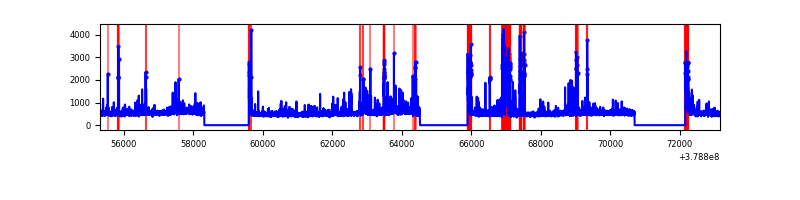 |
| D | 17854 | 13738 | 446 | 446 | 2.50% | 3.25% | 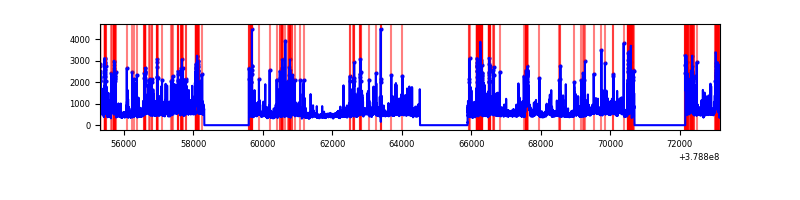 |
Top three noisy pixels from each quadrant. If the there are fewer than three noisy pixels in the level2.evt file, extra rows are filled as -1
| Pixel properties | Quadrant properties | ||||||
|---|---|---|---|---|---|---|---|
| Quadrant | DetID | PixID | Counts | Sigma | Mean | Median | Sigma |
| A | 15 | 169 | 109433 | 338.7 | 1605 | 1572 | 318.5 |
| A | 13 | 6 | 38210 | 115.05 | 1605 | 1572 | 318.5 |
| A | 13 | 254 | 23542 | 68.99 | 1605 | 1572 | 318.5 |
| B | 5 | 172 | 607126 | 2023.0 | 1591 | 1549 | 299.3 |
| B | 5 | 255 | 116478 | 383.93 | 1591 | 1549 | 299.3 |
| B | 4 | 251 | 93646 | 307.66 | 1591 | 1549 | 299.3 |
| C | 0 | 10 | 961225 | 2685.17 | 1557 | 1567 | 357.4 |
| C | 15 | 214 | 580664 | 1620.34 | 1557 | 1567 | 357.4 |
| C | 0 | 207 | 315252 | 877.71 | 1557 | 1567 | 357.4 |
| D | 12 | 235 | 1094199 | 2915.43 | 1544 | 1500 | 374.8 |
| D | 2 | 250 | 819722 | 2183.1 | 1544 | 1500 | 374.8 |
| D | 8 | 195 | 763728 | 2033.7 | 1544 | 1500 | 374.8 |
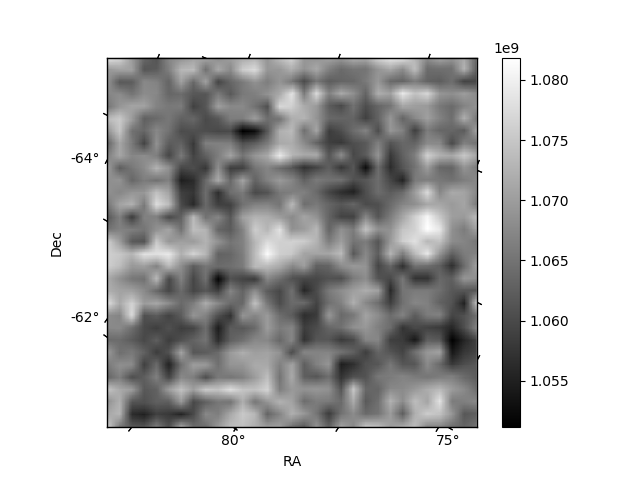
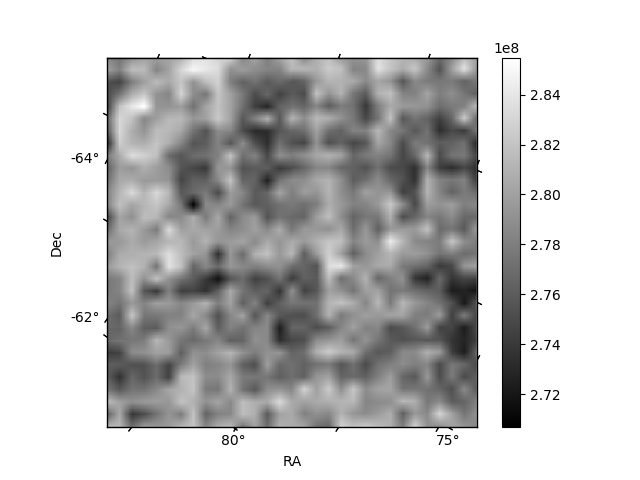
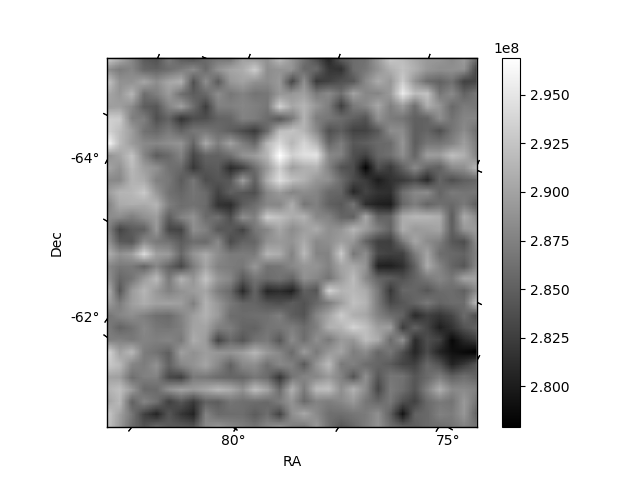
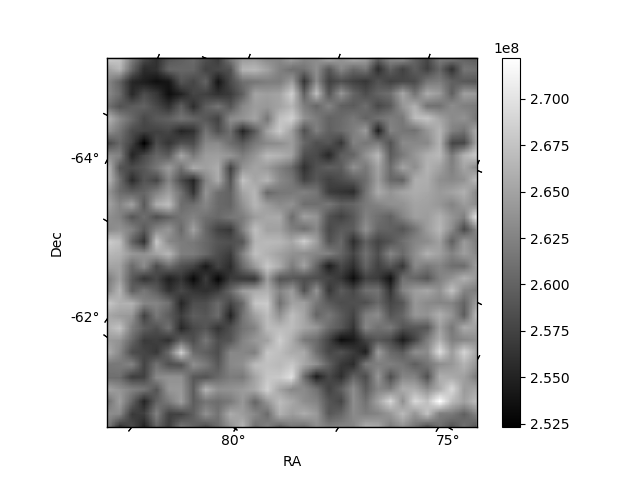
Histogram calculated using DETX and DETY for each event in the final _common_clean file
| Quadrant A | 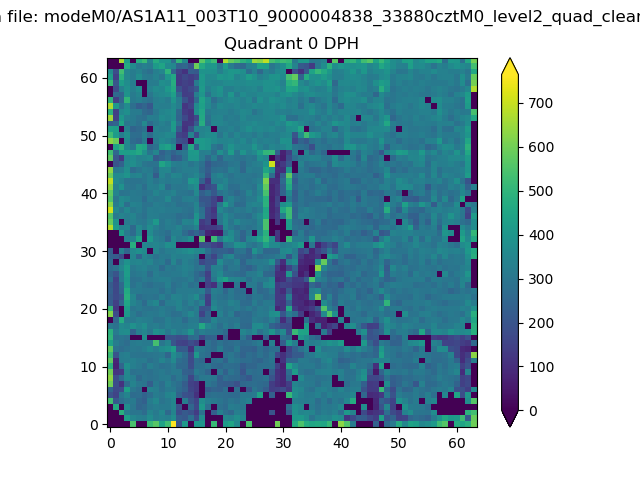 |
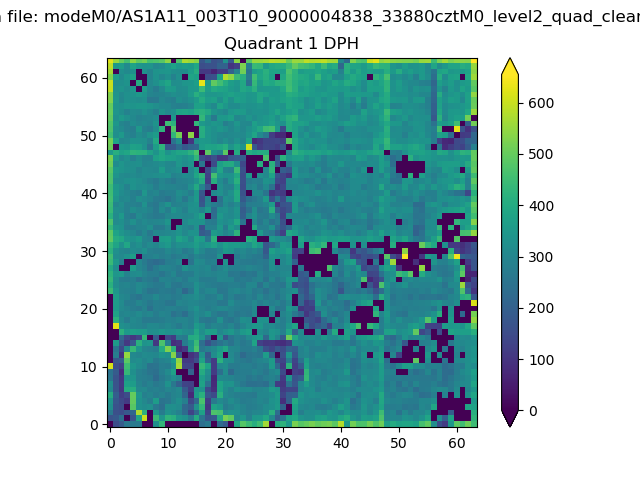 |
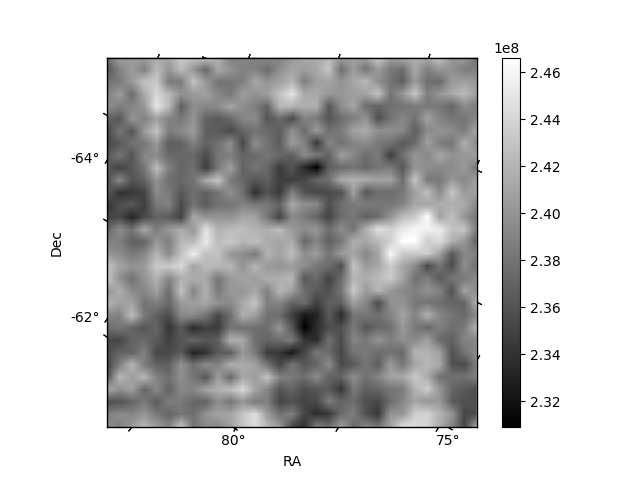
Quadrant B |
|---|---|---|---|
| Quadrant D | 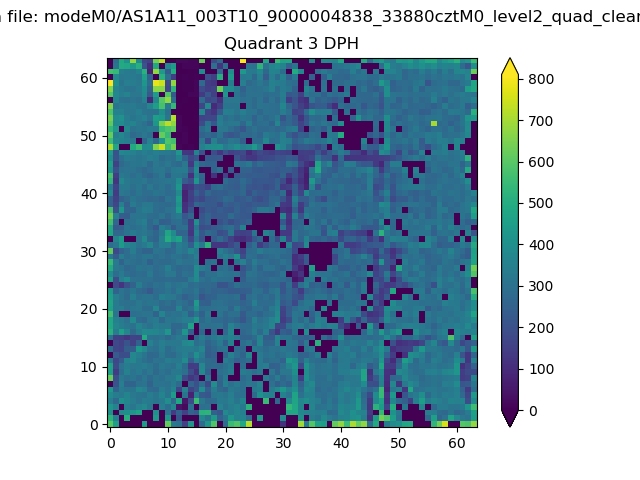 |
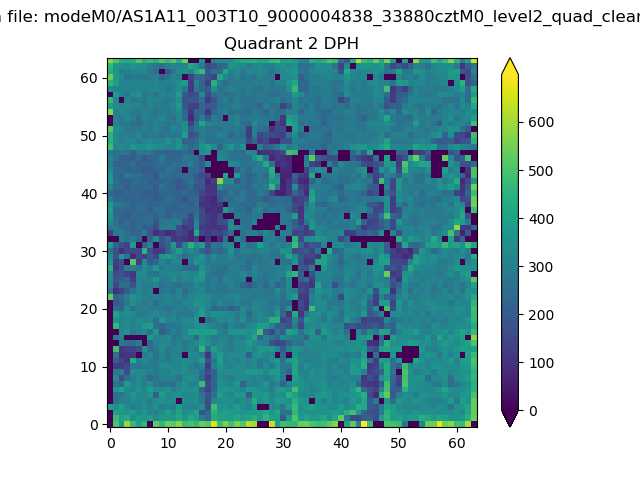 |
Quadrant C |
| Plot type | Count rate plots | Images |
|---|---|---|
| Comparison with Poisson distribution Blue bars denote a histogram of data divided into 1 sec bins. Red curve is a Poisson curve with rate = median count rate of data. |
 |
 |
| Quadrant-wise count rates Data is divided into 100 sec bins |
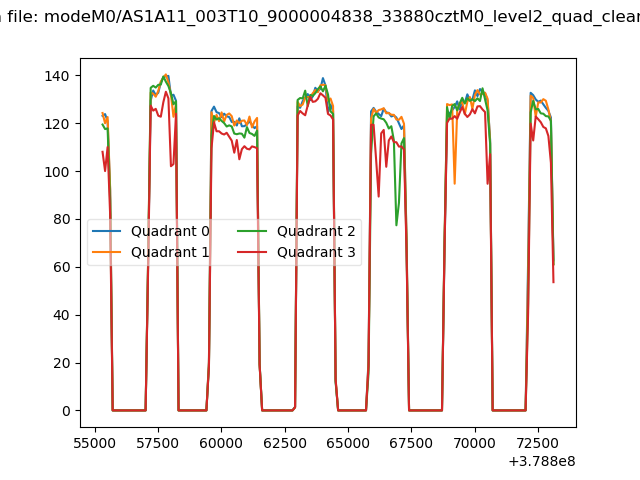 |
|
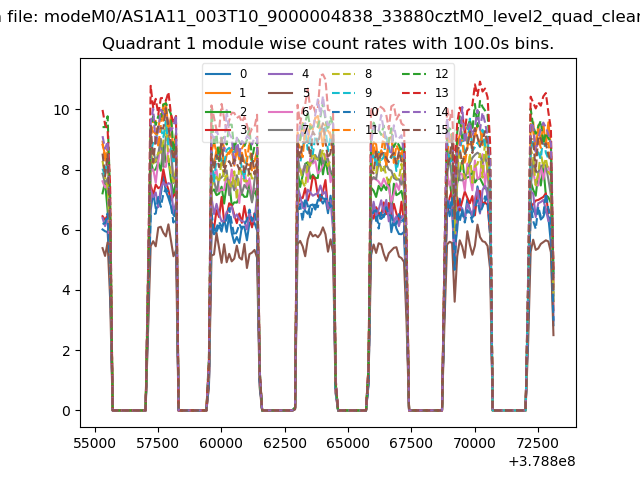
| Module-wise count rates for Quadrant A Data is divided into 100 sec bins |
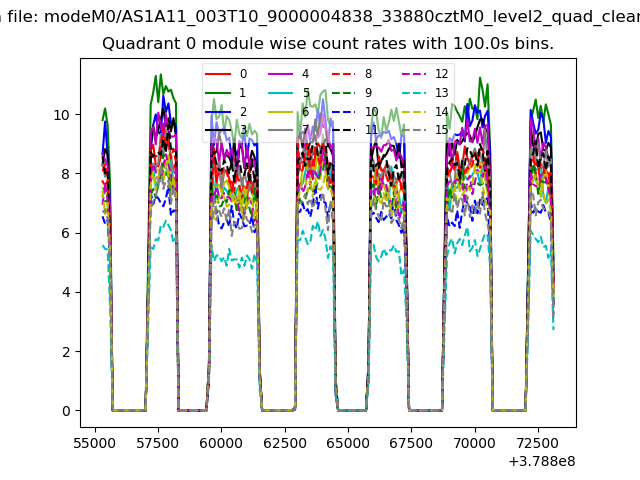 |
 |
| Module-wise count rates for Quadrant B Data is divided into 100 sec bins |
 |
 |
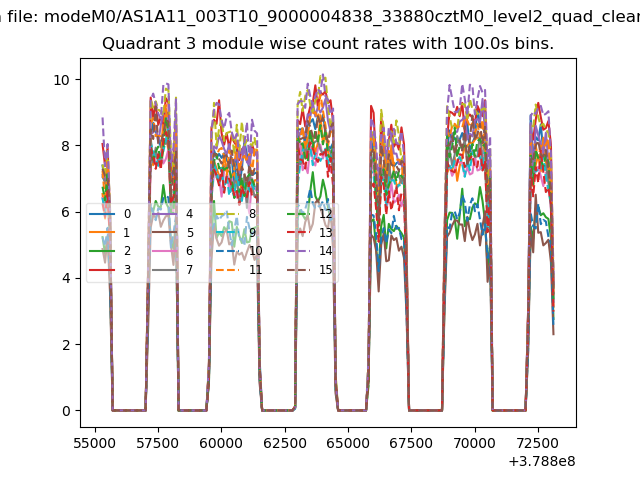
| Module-wise count rates for Quadrant C Data is divided into 100 sec bins |
 |
 |
| Module-wise count rates for Quadrant D Data is divided into 100 sec bins |
 |
 |
| Parameter | Plot |
|---|---|
| CZT HV Monitor |  |
| D_VDD | 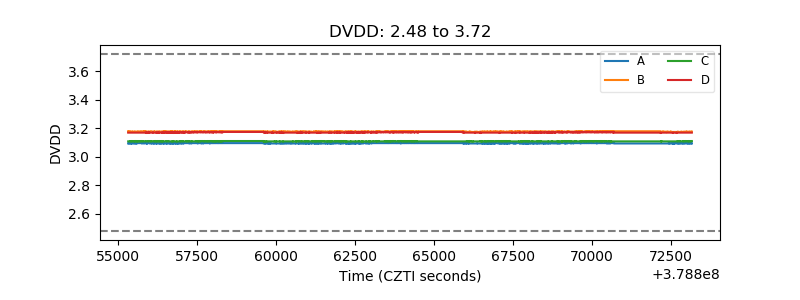 |
| Temperature 1 |  |
| Veto HV Monitor | 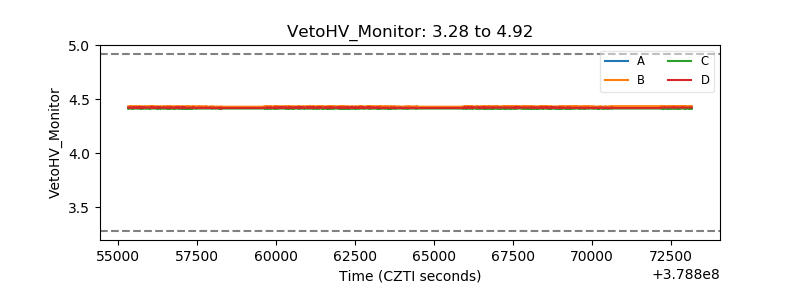 |
| Veto LLD | 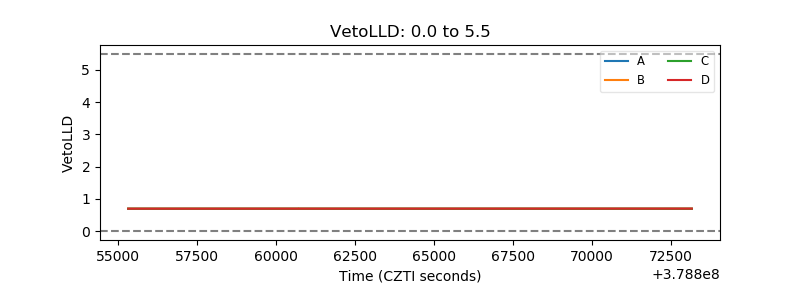 |
| Alpha Counter | 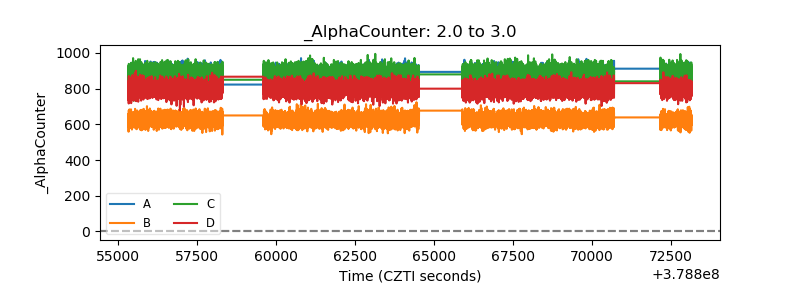 |
| _CPM_Rate | 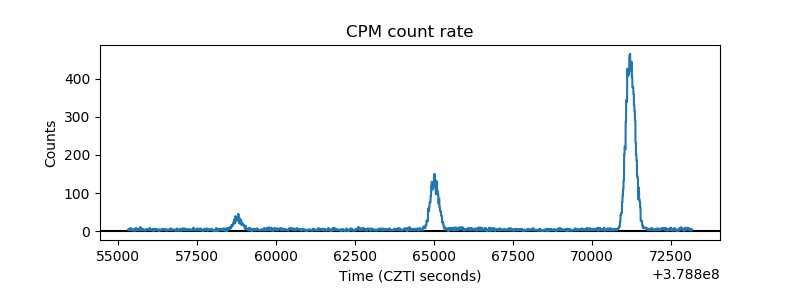 |
| CZT Counter | 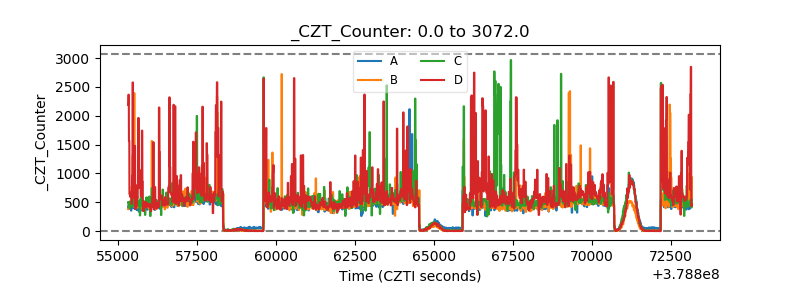 |
| +2.5 Volts monitor |  |
| +5 Volts monitor | 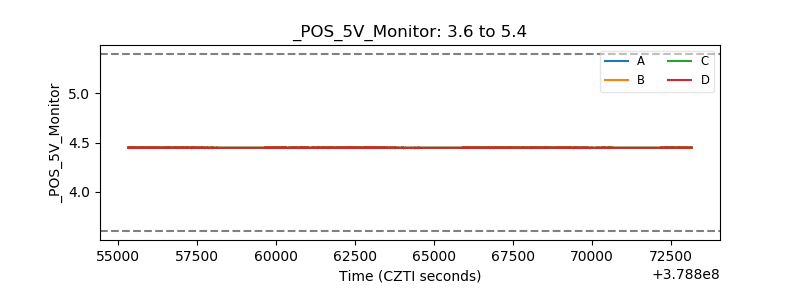 |
| _ROLL_ROT | 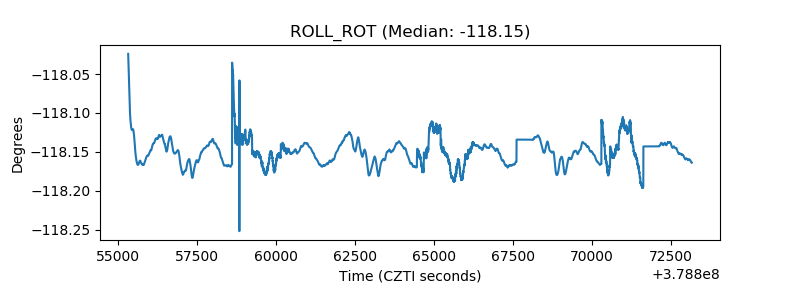 |
| _Roll_DEC | 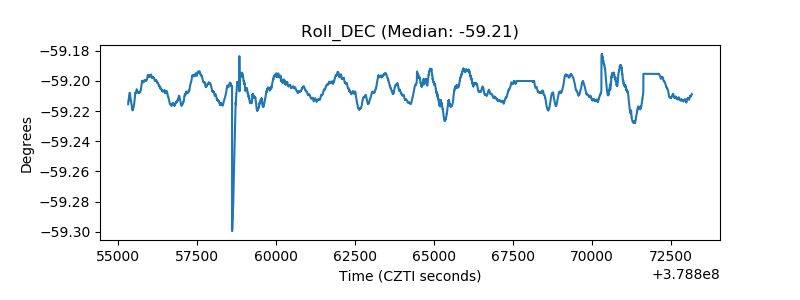 |
| _Roll_RA | 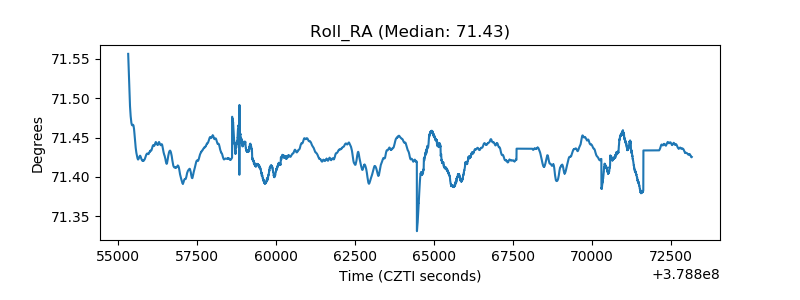 |
| Veto Counter | 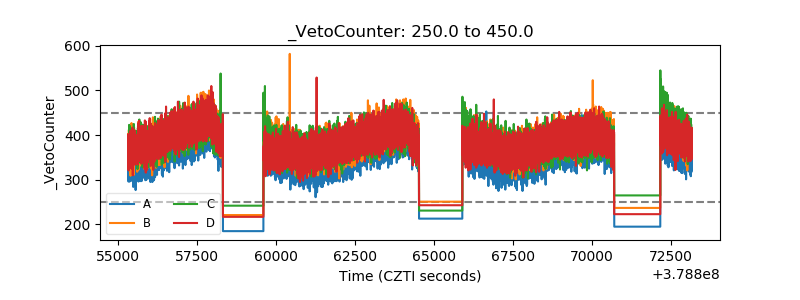 |