| Param | Original file | Final file |
|---|---|---|
| Filename | modeM0/AS1A11_003T10_9000004838_33881cztM0_level2.evt | modeM0/AS1A11_003T10_9000004838_33881cztM0_level2_quad_clean.evt |
| Size (bytes) | 450,812,160 | 76,443,840 |
| Size | 429.9 MB | 72.9 MB |
| Events in quadrant A | 2,555,741 | 495,344 |
| Events in quadrant B | 3,549,243 | 488,089 |
| Events in quadrant C | 3,075,891 | 486,259 |
| Events in quadrant D | 4,096,423 | 458,086 |
| Mode M0 | |||
|---|---|---|---|
| Quadrant | BADHDUFLAG | Total packets | Discarded packets |
| A | 0 | 11228 | 3 |
| B | 0 | 14190 | 2 |
| C | 0 | 12315 | 2 |
| D | 0 | 15795 | 2 |
| Mode M9 | |||
|---|---|---|---|
| Quadrant | BADHDUFLAG | Total packets | Discarded packets |
| A | 0 | 16 | 0 |
| B | 0 | 16 | 0 |
| C | 0 | 16 | 0 |
| D | 0 | 16 | 0 |
| Mode SS | |||
|---|---|---|---|
| Quadrant | BADHDUFLAG | Total packets | Discarded packets |
| A | 0 | 112 | 0 |
| B | 0 | 112 | 0 |
| C | 0 | 112 | 0 |
| D | 0 | 112 | 0 |
| Quadrant | Total seconds | Saturated seconds | Saturation percentage |
|---|---|---|---|
| A | 5532 | 4 | 0.072307% |
| B | 5532 | 216 | 3.904555% |
| C | 5532 | 85 | 1.536515% |
| D | 5533 | 291 | 5.259353% |
Noise dominated data is calculated using 1-second bins in cleaned event files. If a bin has >2000 counts, and if more than 50% of those come from <1% of pixels, then it is considered to be noise-dominated and hence unusable.
| Quadrant | # 1 sec bins | Bins with >0 counts | Bins with >2000 counts | High rate bins dominated by noise | Noise dominated (total time) | Noise dominated (detector-on time) | Marked lightcurve |
|---|---|---|---|---|---|---|---|
| A | 7115 | 5533 | 0 | 0 | 0.00% | 0.00% | 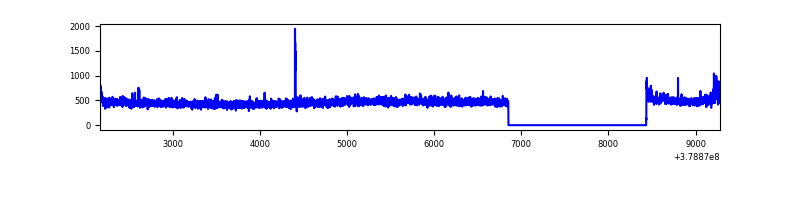 |
| B | 7115 | 5533 | 124 | 124 | 1.74% | 2.24% | 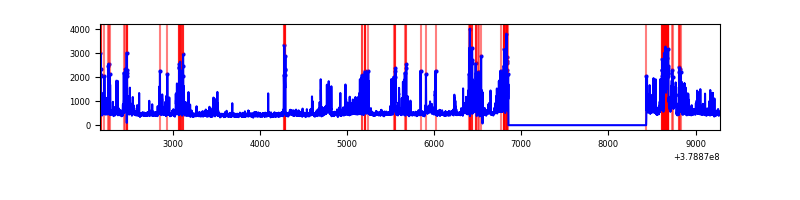 |
| C | 7115 | 5533 | 53 | 53 | 0.74% | 0.96% | 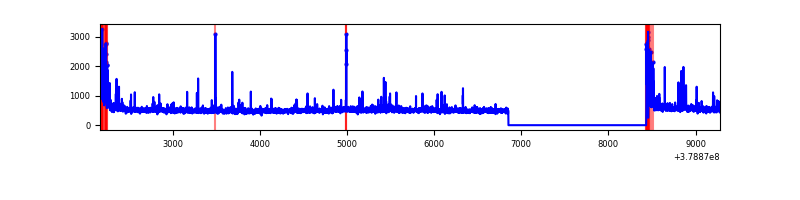 |
| D | 7116 | 5534 | 254 | 254 | 3.57% | 4.59% | 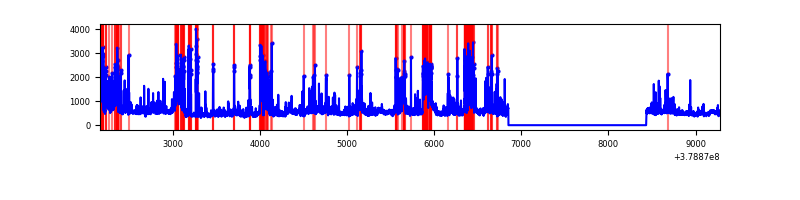 |
Top three noisy pixels from each quadrant. If the there are fewer than three noisy pixels in the level2.evt file, extra rows are filled as -1
| Pixel properties | Quadrant properties | ||||||
|---|---|---|---|---|---|---|---|
| Quadrant | DetID | PixID | Counts | Sigma | Mean | Median | Sigma |
| A | 15 | 169 | 40993 | 313.38 | 642 | 629 | 128.8 |
| A | 13 | 6 | 21287 | 160.39 | 642 | 629 | 128.8 |
| A | 10 | 83 | 11740 | 86.26 | 642 | 629 | 128.8 |
| B | 5 | 172 | 442202 | 3654.03 | 633 | 616 | 120.8 |
| B | 5 | 255 | 340714 | 2814.24 | 633 | 616 | 120.8 |
| B | 4 | 251 | 182214 | 1502.68 | 633 | 616 | 120.8 |
| C | 0 | 10 | 241956 | 1667.19 | 628 | 633 | 144.7 |
| C | 15 | 214 | 240657 | 1658.22 | 628 | 633 | 144.7 |
| C | 0 | 207 | 63413 | 433.72 | 628 | 633 | 144.7 |
| D | 12 | 235 | 734375 | 4805.4 | 618 | 599 | 152.7 |
| D | 2 | 250 | 378603 | 2475.5 | 618 | 599 | 152.7 |
| D | 8 | 195 | 276273 | 1805.35 | 618 | 599 | 152.7 |
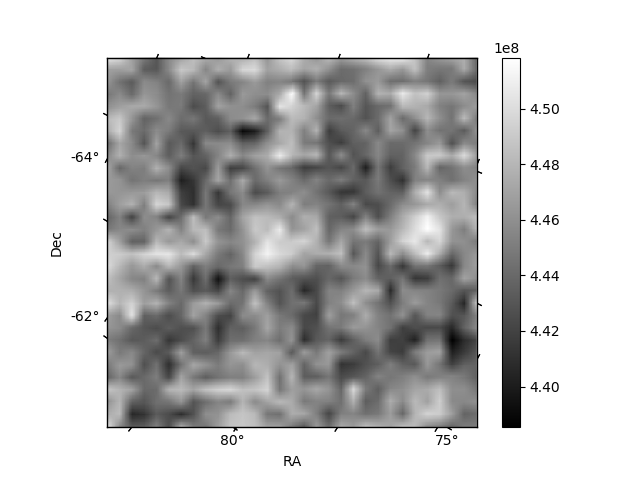
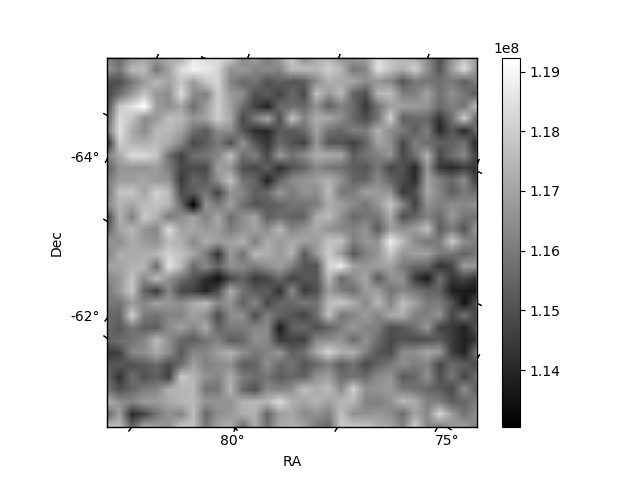
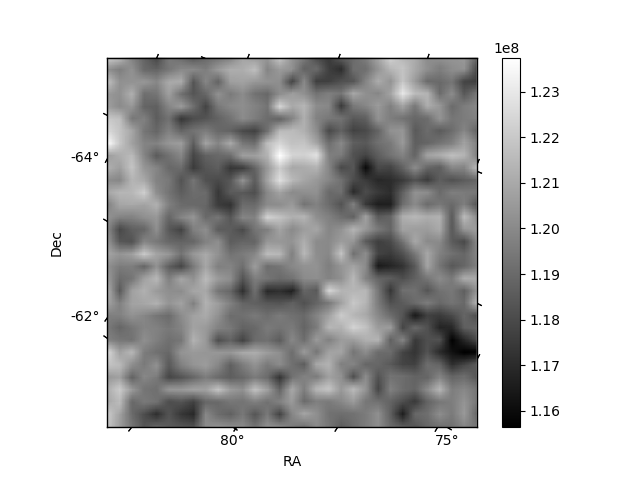
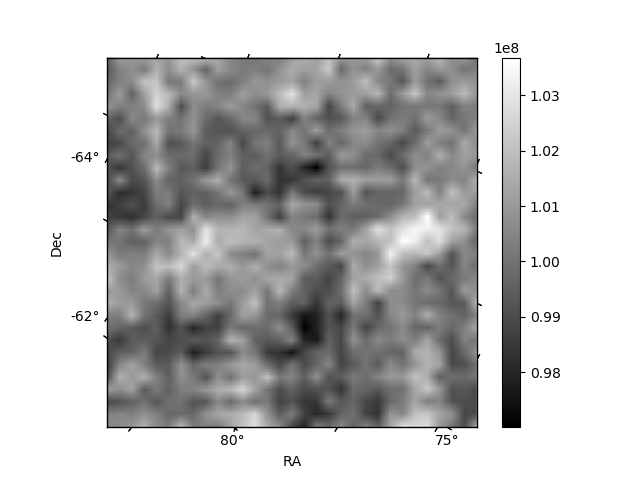
Histogram calculated using DETX and DETY for each event in the final _common_clean file
| Quadrant A | 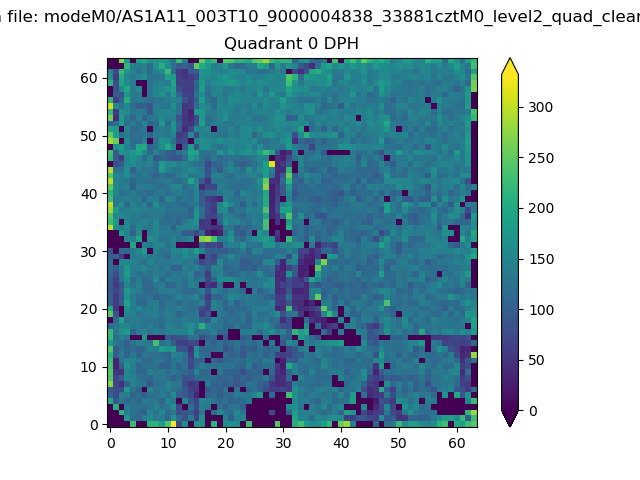 |
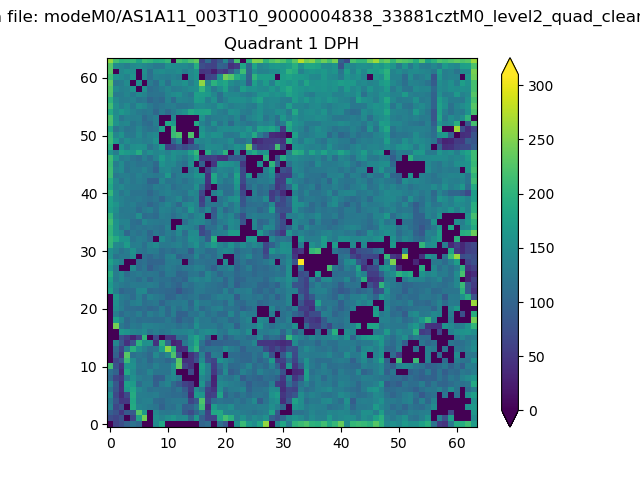 |
Quadrant B |
|---|---|---|---|
| Quadrant D | 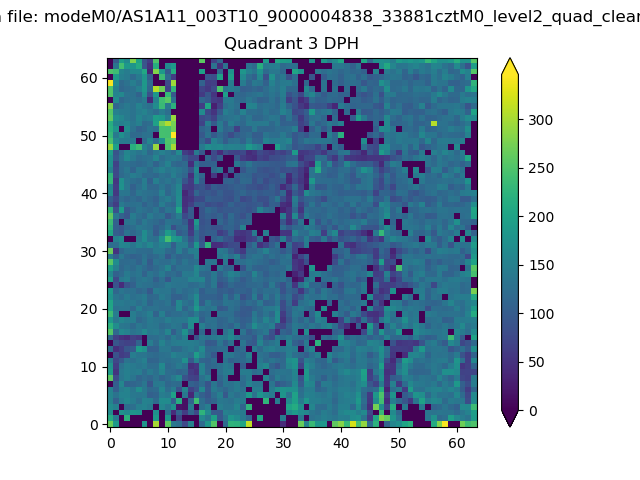 |
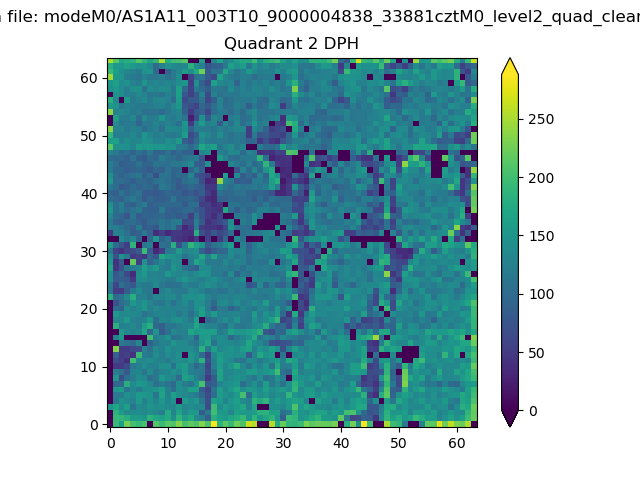 |
Quadrant C |
| Plot type | Count rate plots | Images |
|---|---|---|
| Comparison with Poisson distribution Blue bars denote a histogram of data divided into 1 sec bins. Red curve is a Poisson curve with rate = median count rate of data. |
 |
 |
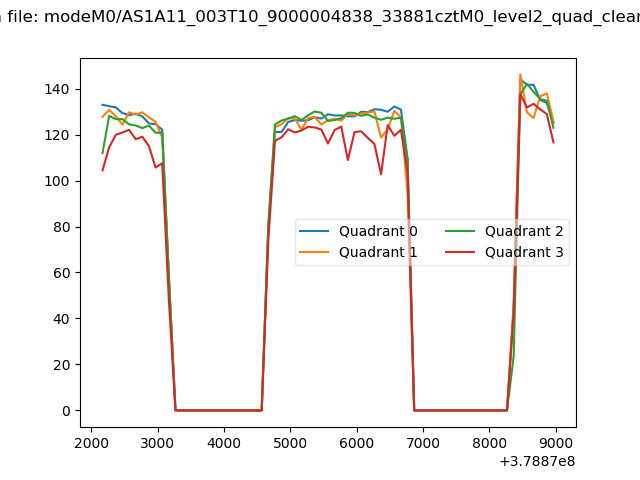
| Quadrant-wise count rates Data is divided into 100 sec bins |
 |
|
| Module-wise count rates for Quadrant A Data is divided into 100 sec bins |
 |
 |
| Module-wise count rates for Quadrant B Data is divided into 100 sec bins |
 |
 |
| Module-wise count rates for Quadrant C Data is divided into 100 sec bins |
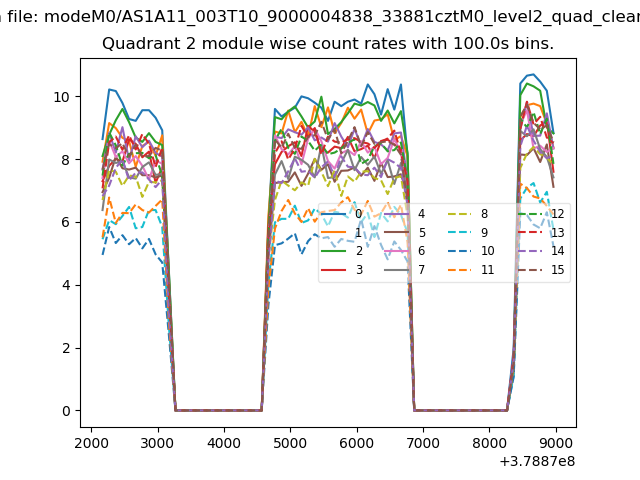 |
 |
| Module-wise count rates for Quadrant D Data is divided into 100 sec bins |
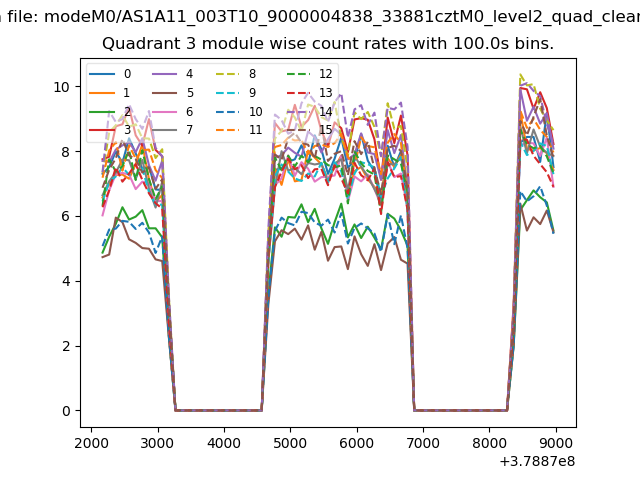 |
 |
| Parameter | Plot |
|---|---|
| CZT HV Monitor | 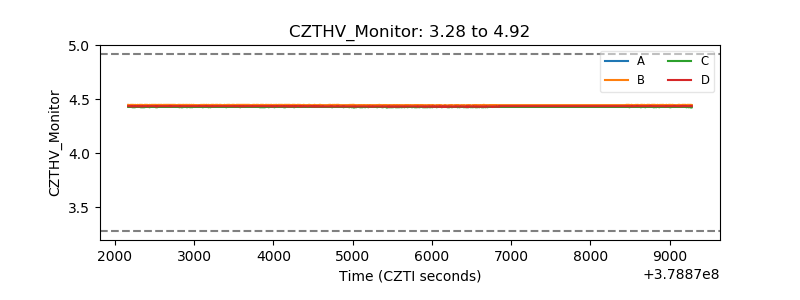 |
| D_VDD | 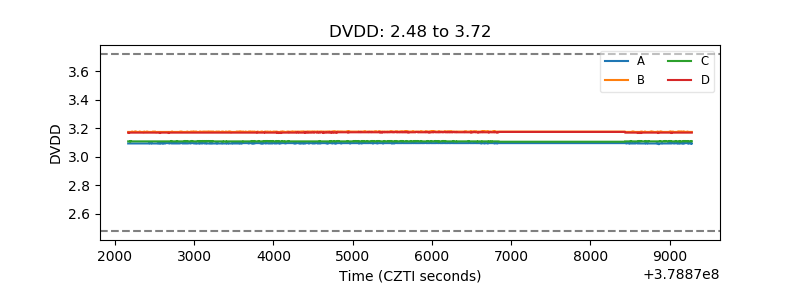 |
| Temperature 1 | 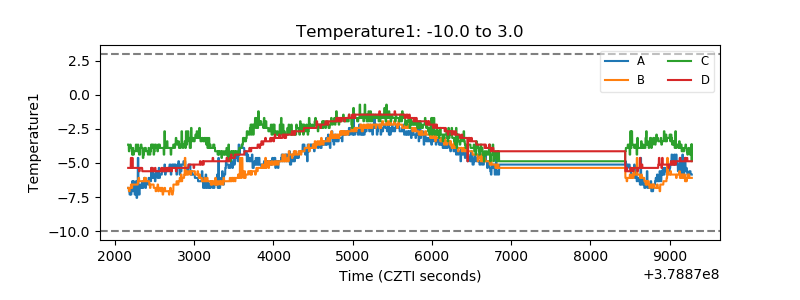 |
| Veto HV Monitor | 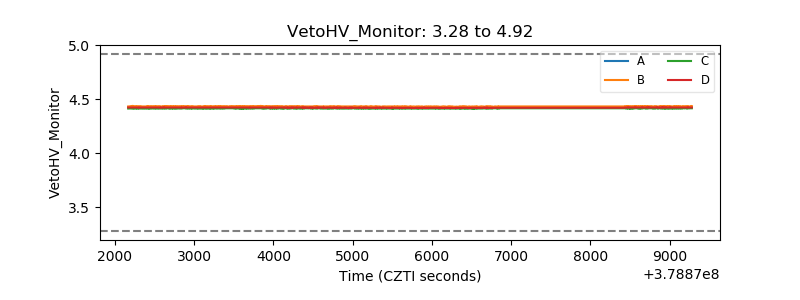 |
| Veto LLD | 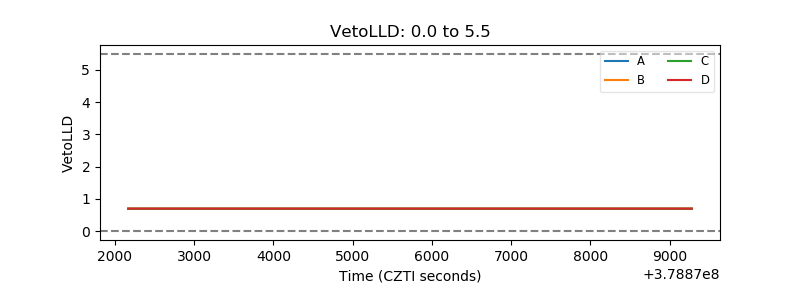 |
| Alpha Counter | 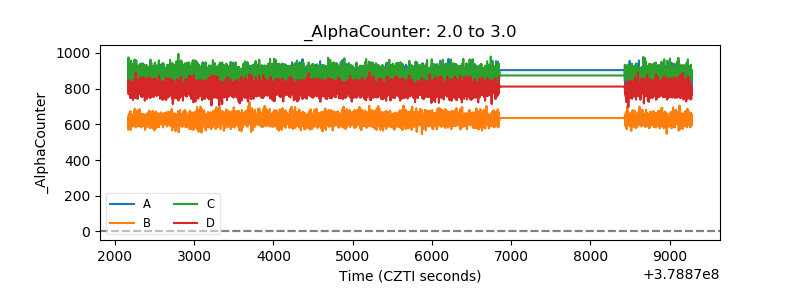 |
| _CPM_Rate | 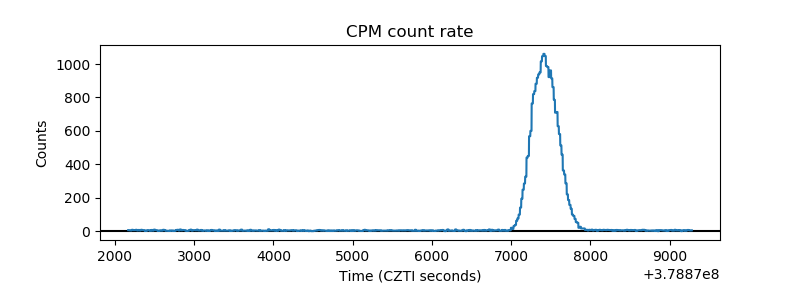 |
| CZT Counter | 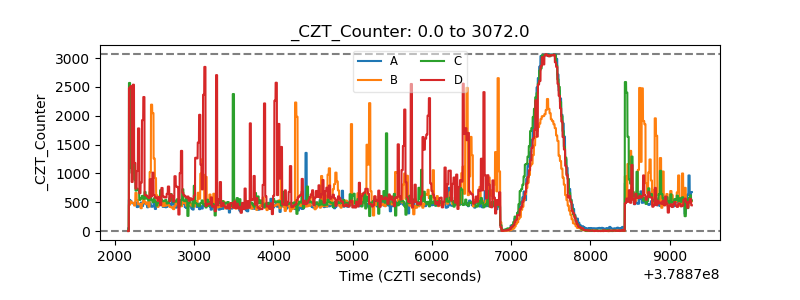 |
| +2.5 Volts monitor | 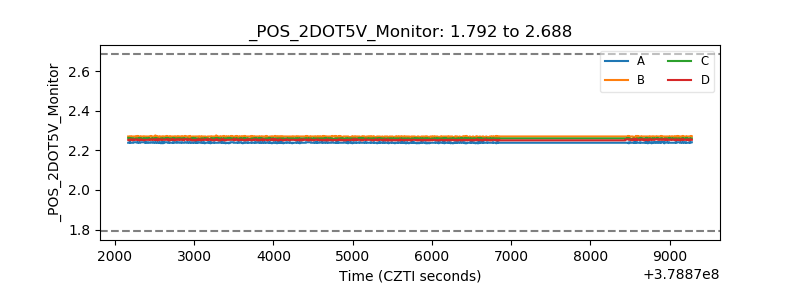 |
| +5 Volts monitor |  |
| _ROLL_ROT | 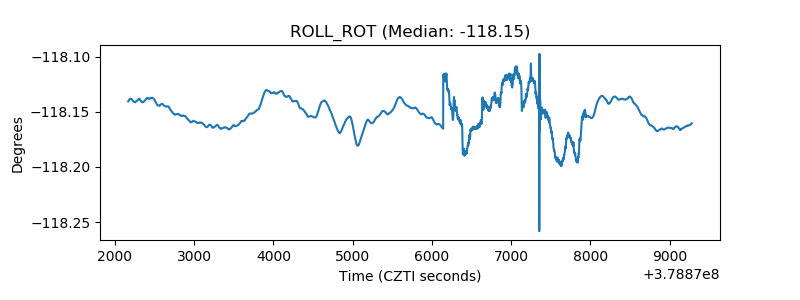 |
| _Roll_DEC | 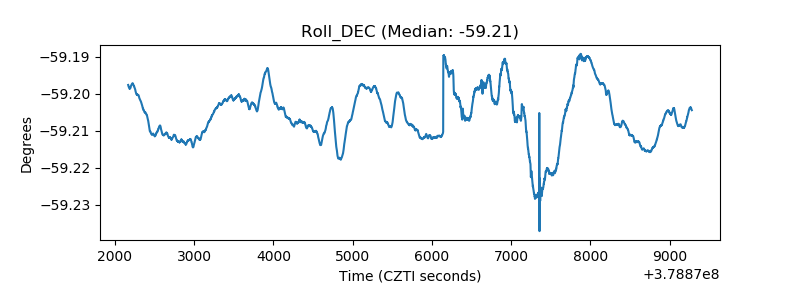 |
| _Roll_RA | 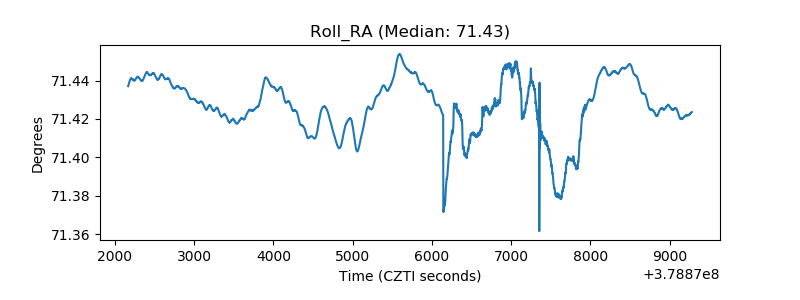 |
| Veto Counter |  |