| Param | Original file | Final file |
|---|---|---|
| Filename | modeM0/AS1A11_003T10_9000004838_33884cztM0_level2.evt | modeM0/AS1A11_003T10_9000004838_33884cztM0_level2_quad_clean.evt |
| Size (bytes) | 444,479,040 | 48,395,520 |
| Size | 423.9 MB | 46.2 MB |
| Events in quadrant A | 5,683,657 | 270,199 |
| Events in quadrant B | 2,449,295 | 314,823 |
| Events in quadrant C | 2,296,905 | 310,075 |
| Events in quadrant D | 2,772,271 | 299,982 |
| Mode M0 | |||
|---|---|---|---|
| Quadrant | BADHDUFLAG | Total packets | Discarded packets |
| A | 0 | 19534 | 1 |
| B | 0 | 9635 | 1 |
| C | 0 | 9046 | 1 |
| D | 0 | 10861 | 1 |
| Mode M9 | |||
|---|---|---|---|
| Quadrant | BADHDUFLAG | Total packets | Discarded packets |
| A | 1 | 139768639691560 | 46 |
| B | 1 | -1 | -1 |
| C | 1 | -1 | -1 |
| D | 1 | -1 | -1 |
| Mode SS | |||
|---|---|---|---|
| Quadrant | BADHDUFLAG | Total packets | Discarded packets |
| A | 0 | 76 | 0 |
| B | 0 | 76 | 0 |
| C | 0 | 76 | 0 |
| D | 0 | 76 | 0 |
| Quadrant | Total seconds | Saturated seconds | Saturation percentage |
|---|---|---|---|
| A | 3819 | 1130 | 29.588898% |
| B | 3819 | 159 | 4.163394% |
| C | 3819 | 87 | 2.278083% |
| D | 3819 | 106 | 2.775596% |
Noise dominated data is calculated using 1-second bins in cleaned event files. If a bin has >2000 counts, and if more than 50% of those come from <1% of pixels, then it is considered to be noise-dominated and hence unusable.
| Quadrant | # 1 sec bins | Bins with >0 counts | Bins with >2000 counts | High rate bins dominated by noise | Noise dominated (total time) | Noise dominated (detector-on time) | Marked lightcurve |
|---|---|---|---|---|---|---|---|
| A | 3819 | 3819 | 1015 | 1015 | 26.58% | 26.58% | 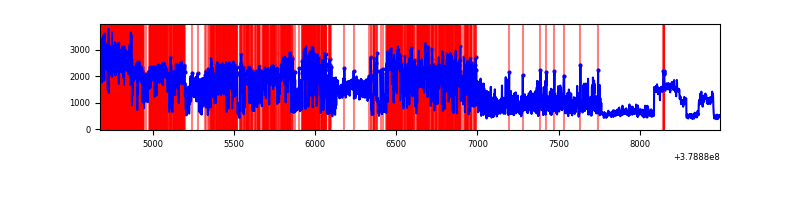 |
| B | 3819 | 3819 | 100 | 100 | 2.62% | 2.62% | 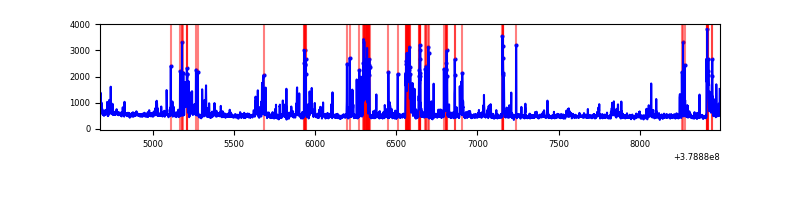 |
| C | 3819 | 3819 | 65 | 65 | 1.70% | 1.70% | 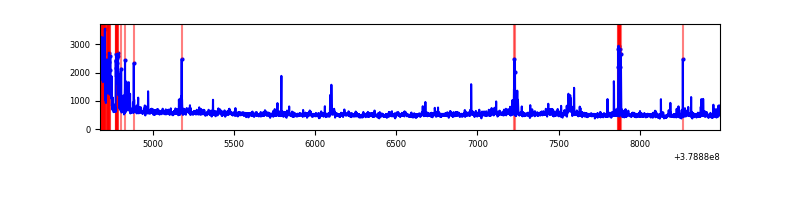 |
| D | 3819 | 3819 | 99 | 99 | 2.59% | 2.59% | 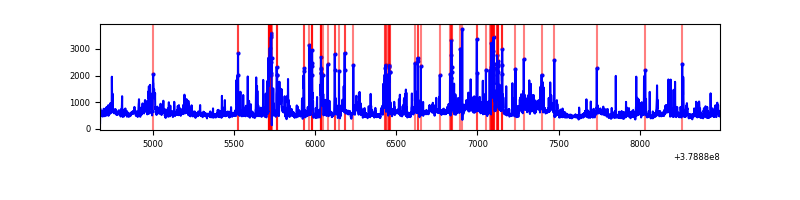 |
Top three noisy pixels from each quadrant. If the there are fewer than three noisy pixels in the level2.evt file, extra rows are filled as -1
| Pixel properties | Quadrant properties | ||||||
|---|---|---|---|---|---|---|---|
| Quadrant | DetID | PixID | Counts | Sigma | Mean | Median | Sigma |
| A | 15 | 169 | 4044568 | 48099.04 | 420 | 413 | 84.1 |
| A | 13 | 6 | 13830 | 159.57 | 420 | 413 | 84.1 |
| A | 13 | 254 | 6063 | 67.2 | 420 | 413 | 84.1 |
| B | 5 | 172 | 294013 | 3415.22 | 455 | 443 | 86.0 |
| B | 4 | 251 | 167785 | 1946.76 | 455 | 443 | 86.0 |
| B | 5 | 255 | 116280 | 1347.58 | 455 | 443 | 86.0 |
| C | 15 | 214 | 164369 | 1600.48 | 448 | 451 | 102.4 |
| C | 0 | 10 | 144073 | 1402.31 | 448 | 451 | 102.4 |
| C | 0 | 207 | 78756 | 764.56 | 448 | 451 | 102.4 |
| D | 12 | 235 | 295929 | 2680.11 | 451 | 438 | 110.3 |
| D | 8 | 195 | 260436 | 2358.19 | 451 | 438 | 110.3 |
| D | 2 | 249 | 112568 | 1017.02 | 451 | 438 | 110.3 |
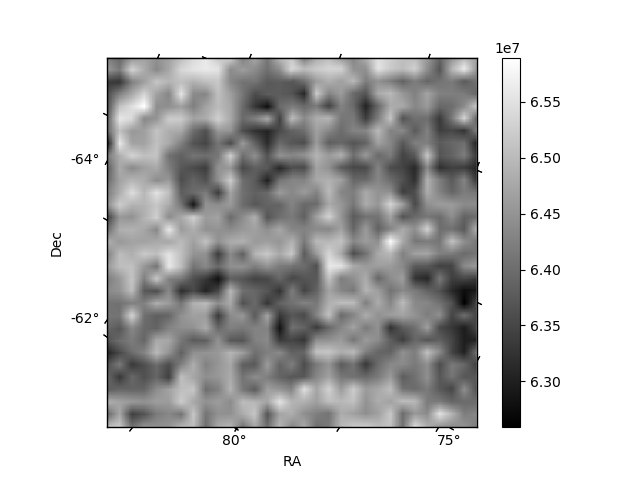
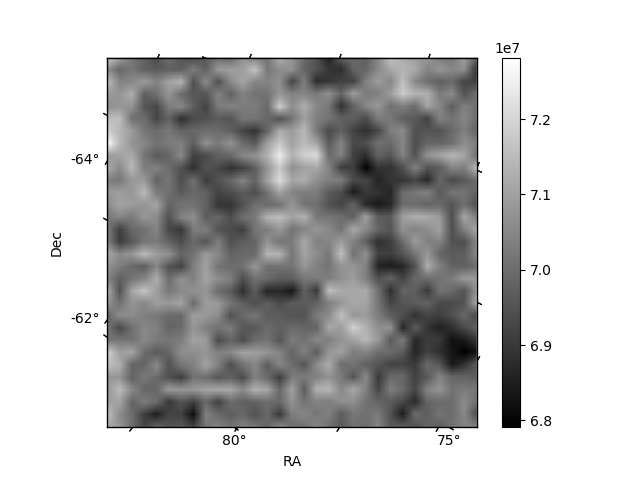
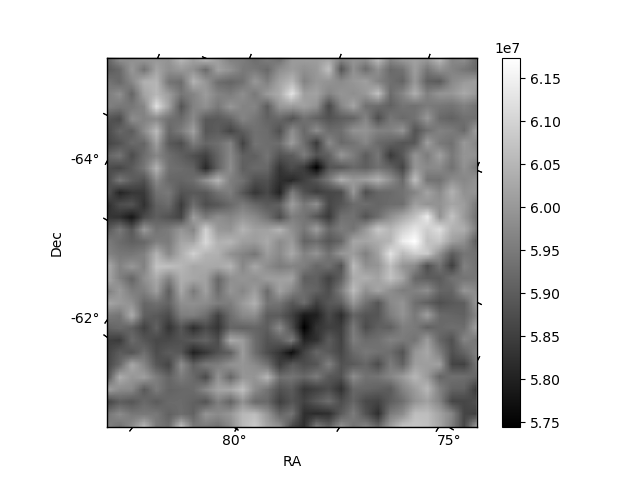
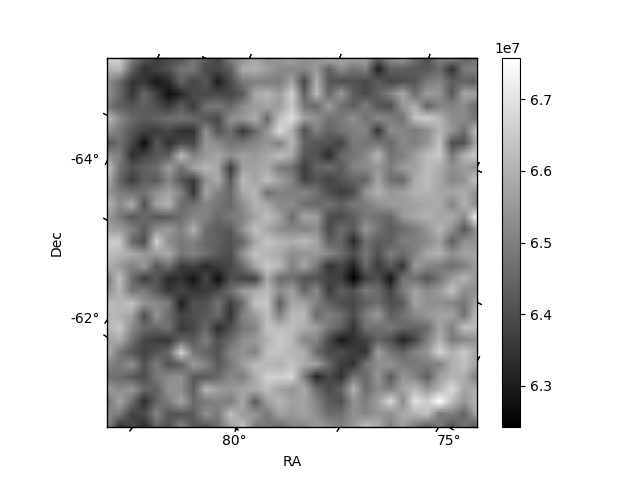
Histogram calculated using DETX and DETY for each event in the final _common_clean file
| Quadrant A | 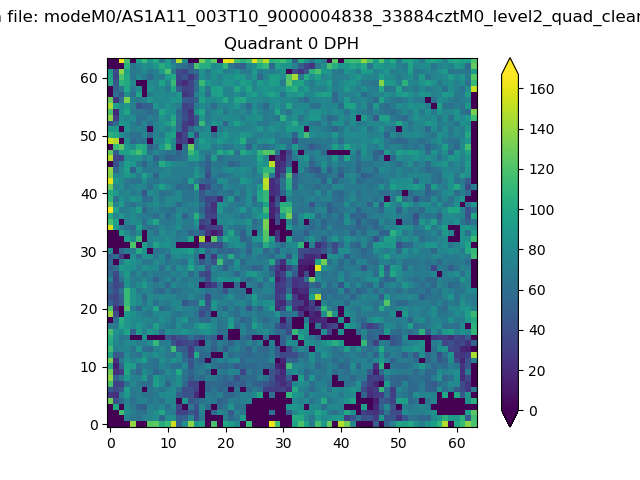 |
 |
Quadrant B |
|---|---|---|---|
| Quadrant D | 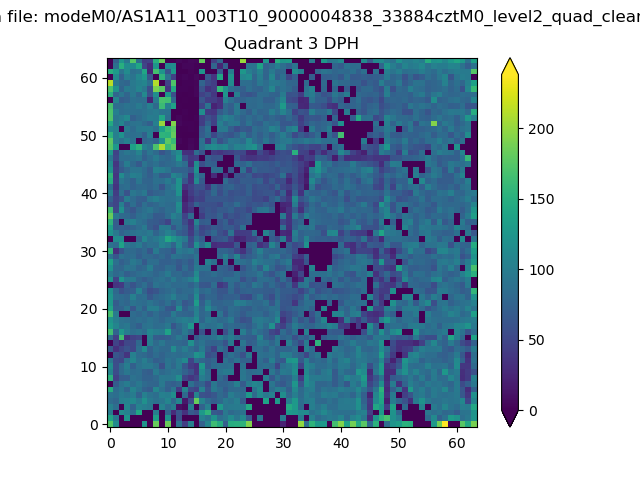 |
 |
Quadrant C |
| Plot type | Count rate plots | Images |
|---|---|---|
| Comparison with Poisson distribution Blue bars denote a histogram of data divided into 1 sec bins. Red curve is a Poisson curve with rate = median count rate of data. |
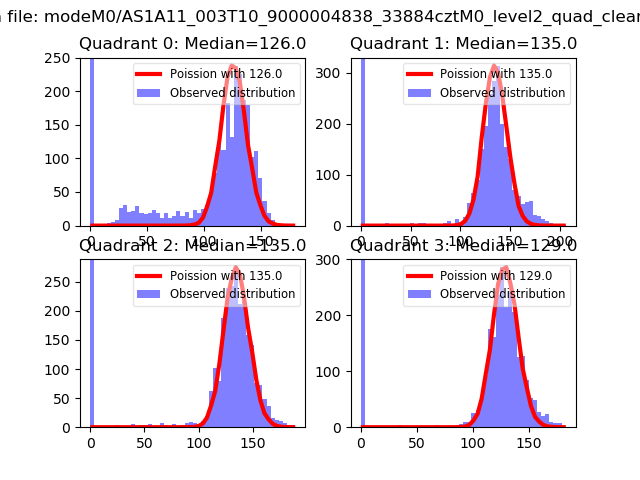 |
 |
| Quadrant-wise count rates Data is divided into 100 sec bins |
 |
|
| Module-wise count rates for Quadrant A Data is divided into 100 sec bins |
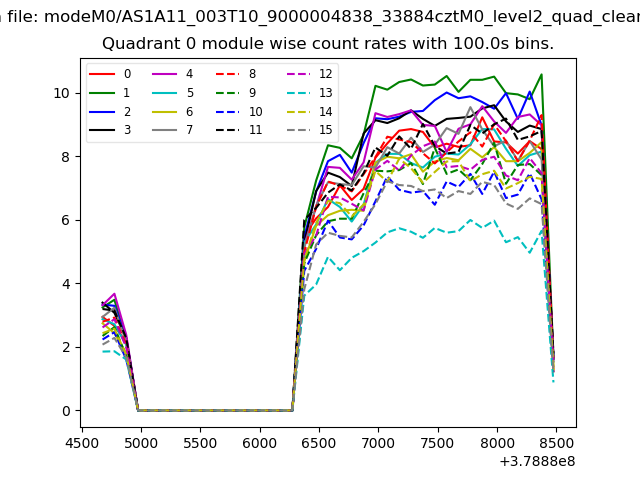 |
 |
| Module-wise count rates for Quadrant B Data is divided into 100 sec bins |
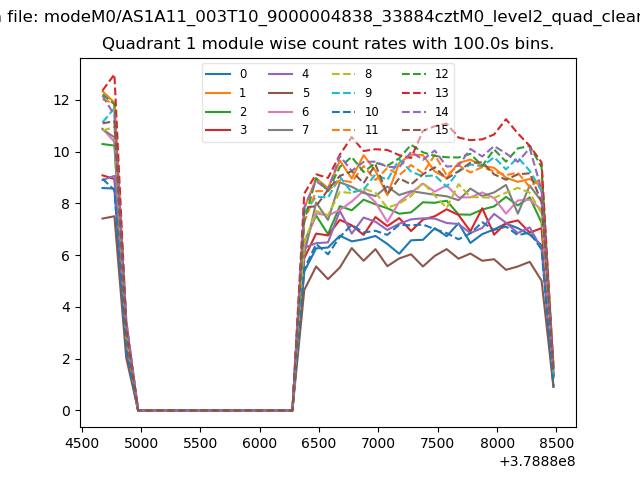 |
 |
| Module-wise count rates for Quadrant C Data is divided into 100 sec bins |
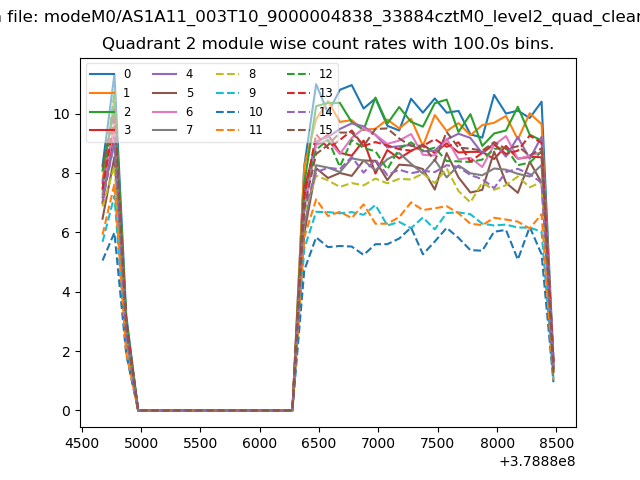 |
 |
| Module-wise count rates for Quadrant D Data is divided into 100 sec bins |
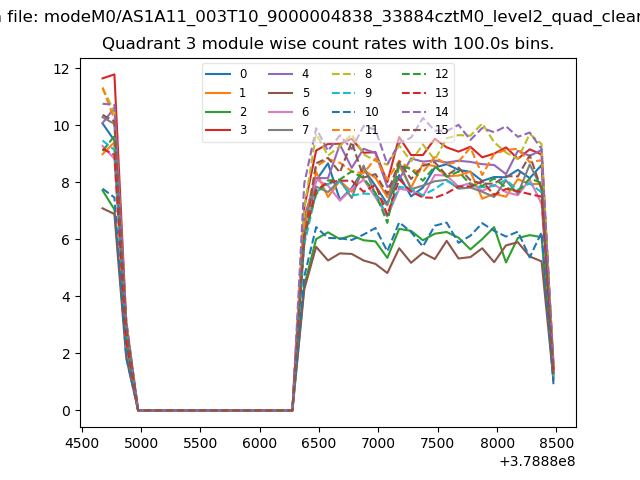 |
 |
| Parameter | Plot |
|---|---|
| CZT HV Monitor | 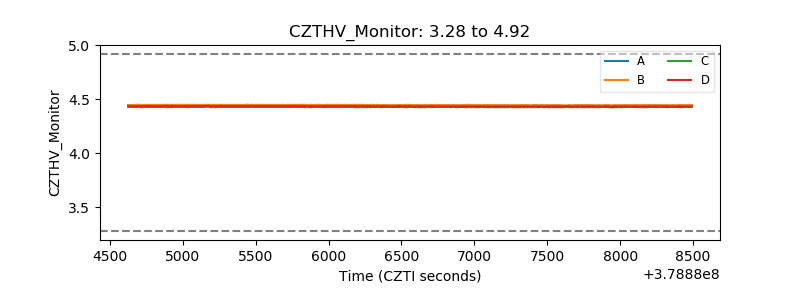 |
| D_VDD | 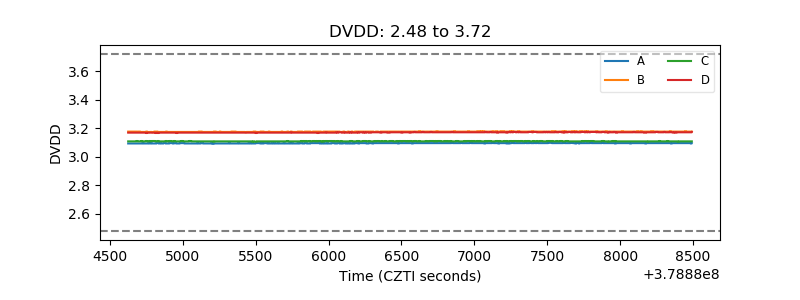 |
| Temperature 1 | 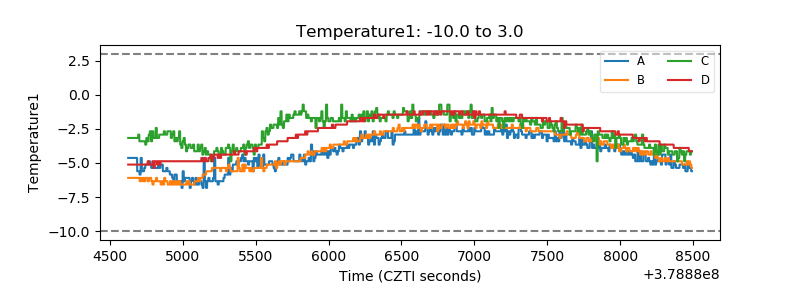 |
| Veto HV Monitor | 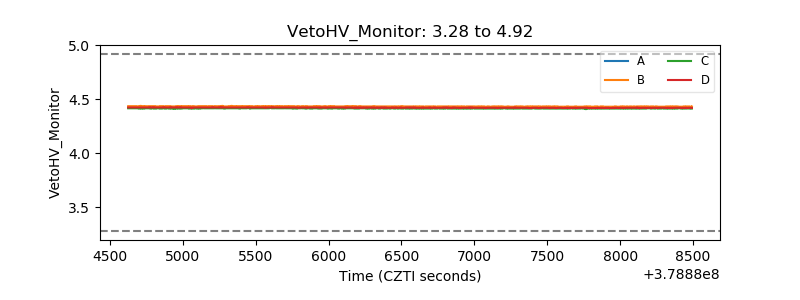 |
| Veto LLD | 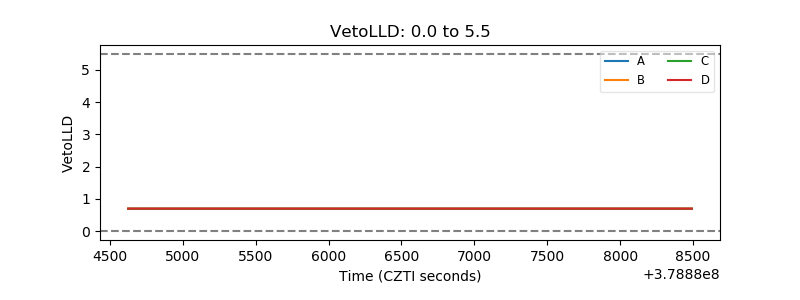 |
| Alpha Counter | 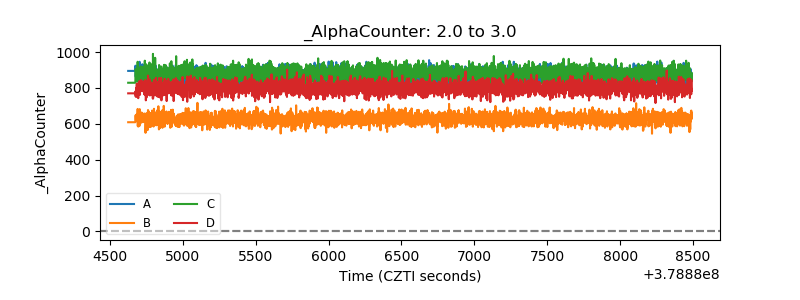 |
| _CPM_Rate | 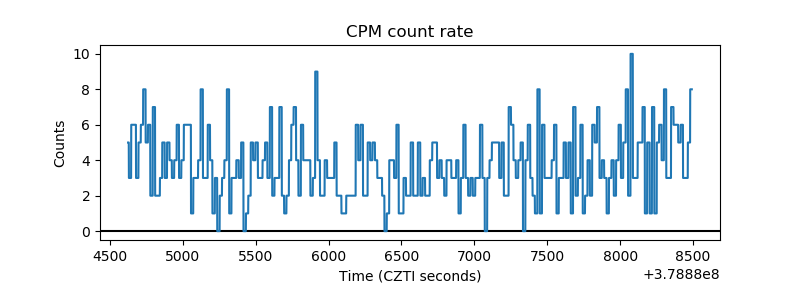 |
| CZT Counter |  |
| +2.5 Volts monitor |  |
| +5 Volts monitor |  |
| _ROLL_ROT | 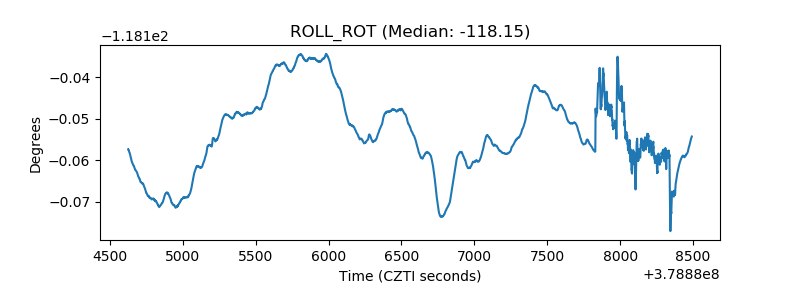 |
| _Roll_DEC | 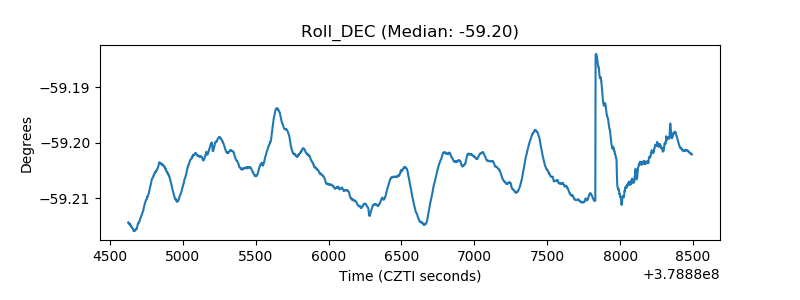 |
| _Roll_RA | 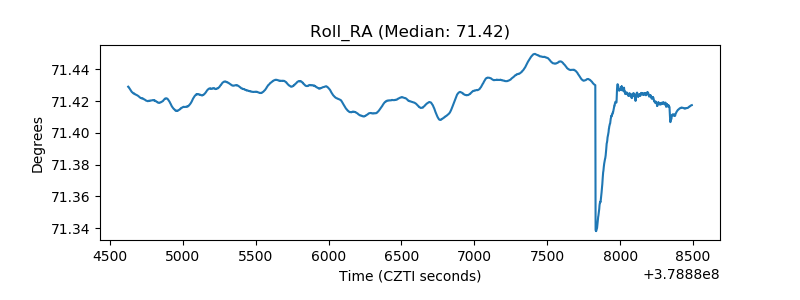 |
| Veto Counter | 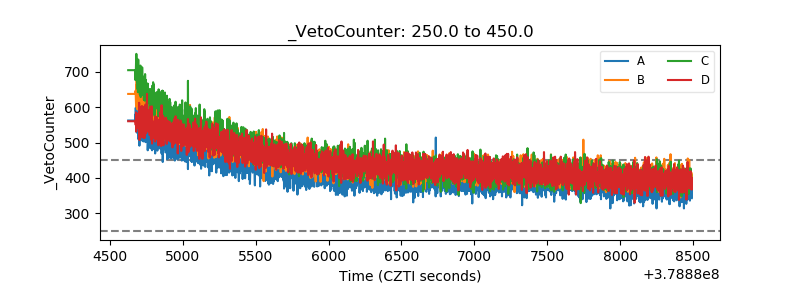 |