| Param | Original file | Final file |
|---|---|---|
| Filename | modeM0/AS1A11_068T01_9000004836cztM0_level2.fits | modeM0/AS1A11_068T01_9000004836cztM0_level2_quad_clean.evt |
| Size (bytes) | 266,774,400 | 282,162,240 |
| Size | 254.4 MB | 269.1 MB |
| Events in quadrant A | 1,678,798 | 1,791,615 |
| Events in quadrant B | 1,559,916 | 1,720,933 |
| Events in quadrant C | 1,629,834 | 1,727,629 |
| Events in quadrant D | 1,362,172 | 1,457,707 |
| Mode M9 | |||
|---|---|---|---|
| Quadrant | BADHDUFLAG | Total packets | Discarded packets |
| A | 0 | 130 | 0 |
| B | 0 | 130 | 0 |
| C | 0 | 130 | 0 |
| D | 0 | 130 | 0 |
| Mode M0 | |||
|---|---|---|---|
| Quadrant | BADHDUFLAG | Total packets | Discarded packets |
| A | 0 | 60968 | 0 |
| B | 0 | 72046 | 0 |
| C | 0 | 72267 | 0 |
| D | 0 | 95550 | 0 |
| Mode SS | |||
|---|---|---|---|
| Quadrant | BADHDUFLAG | Total packets | Discarded packets |
| A | 0 | 546 | 0 |
| B | 0 | 546 | 0 |
| C | 0 | 546 | 0 |
| D | 0 | 546 | 0 |
| Quadrant | Total seconds | Saturated seconds | Saturation percentage |
|---|---|---|---|
| A | 26863 | 831 | 3.093474% |
| B | 26863 | 1452 | 5.405204% |
| C | 26863 | 654 | 2.434575% |
| D | 26863 | 2983 | 11.104493% |
Noise dominated data is calculated using 1-second bins in cleaned event files. If a bin has >2000 counts, and if more than 50% of those come from <1% of pixels, then it is considered to be noise-dominated and hence unusable.
| Quadrant | # 1 sec bins | Bins with >0 counts | Bins with >2000 counts | High rate bins dominated by noise | Noise dominated (total time) | Noise dominated (detector-on time) | Marked lightcurve |
|---|---|---|---|---|---|---|---|
| A | 37888 | 26861 | 0 | 0 | 0.00% | 0.00% |  |
| B | 37888 | 26858 | 0 | 0 | 0.00% | 0.00% |  |
| C | 37888 | 26858 | 0 | 0 | 0.00% | 0.00% |  |
| D | 37888 | 26834 | 0 | 0 | 0.00% | 0.00% |  |
Top three noisy pixels from each quadrant. If the there are fewer than three noisy pixels in the level2.evt file, extra rows are filled as -1
| Pixel properties | Quadrant properties | ||||||
|---|---|---|---|---|---|---|---|
| Quadrant | DetID | PixID | Counts | Sigma | Mean | Median | Sigma |
| A | 9 | 19 | 1319 | 8.31 | 438 | 413 | 109.1 |
| A | 7 | 110 | 1287 | 8.01 | 438 | 413 | 109.1 |
| A | 0 | 29 | 1283 | 7.98 | 438 | 413 | 109.1 |
| B | 2 | 9 | 1348 | 11.22 | 414 | 396 | 84.8 |
| B | 3 | 80 | 1170 | 9.12 | 414 | 396 | 84.8 |
| B | 5 | 128 | 1074 | 7.99 | 414 | 396 | 84.8 |
| C | 1 | 80 | 1314 | 8.16 | 431 | 408 | 111.0 |
| C | 1 | 81 | 1257 | 7.65 | 431 | 408 | 111.0 |
| C | 1 | 65 | 1090 | 6.14 | 431 | 408 | 111.0 |
| D | 6 | 231 | 1034 | 6.48 | 390 | 359 | 104.2 |
| D | 4 | 160 | 1019 | 6.34 | 390 | 359 | 104.2 |
| D | 10 | 113 | 1005 | 6.2 | 390 | 359 | 104.2 |
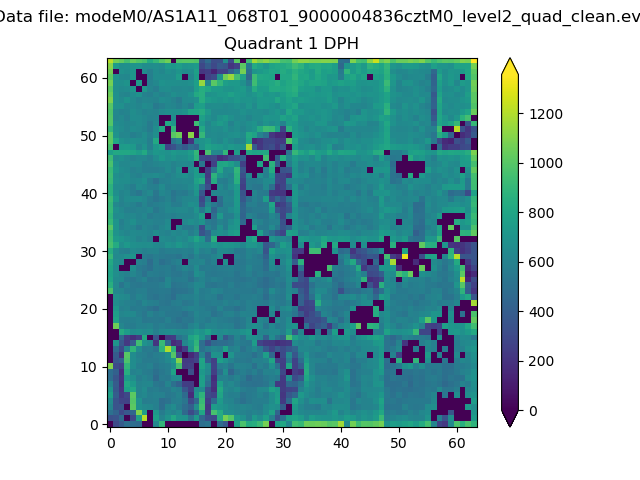
Histogram calculated using DETX and DETY for each event in the final _common_clean file
| Quadrant A |  |
 |
Quadrant B |
|---|---|---|---|
| Quadrant D |  |
 |
Quadrant C |
| Plot type | Count rate plots | Images |
|---|---|---|
| Comparison with Poisson distribution Blue bars denote a histogram of data divided into 1 sec bins. Red curve is a Poisson curve with rate = median count rate of data. |
 |
 |
| Quadrant-wise count rates Data is divided into 100 sec bins |
 |
|
| Module-wise count rates for Quadrant A Data is divided into 100 sec bins |
 |
 |
| Module-wise count rates for Quadrant B Data is divided into 100 sec bins |
 |
 |
| Module-wise count rates for Quadrant C Data is divided into 100 sec bins |
 |
 |
| Module-wise count rates for Quadrant D Data is divided into 100 sec bins |
 |
 |
| Parameter | Plot |
|---|---|
| CZT HV Monitor |  |
| D_VDD |  |
| Temperature 1 |  |
| Veto HV Monitor |  |
| Veto LLD |  |
| Alpha Counter |  |
| _CPM_Rate |  |
| CZT Counter |  |
| +2.5 Volts monitor |  |
| +5 Volts monitor |  |
| _ROLL_ROT |  |
| _Roll_DEC |  |
| _Roll_RA |  |
| Veto Counter |  |