| Param | Original file | Final file |
|---|---|---|
| Filename | modeM0/AS1A11_068T01_9000004836_33872cztM0_level2.evt | modeM0/AS1A11_068T01_9000004836_33872cztM0_level2_quad_clean.evt |
| Size (bytes) | 538,611,840 | 48,450,240 |
| Size | 513.7 MB | 46.2 MB |
| Events in quadrant A | 2,748,452 | 285,988 |
| Events in quadrant B | 3,683,201 | 278,587 |
| Events in quadrant C | 4,178,317 | 280,792 |
| Events in quadrant D | 5,349,801 | 256,326 |
| Mode M9 | |||
|---|---|---|---|
| Quadrant | BADHDUFLAG | Total packets | Discarded packets |
| A | 0 | 27 | 0 |
| B | 0 | 27 | 0 |
| C | 0 | 27 | 0 |
| D | 0 | 28 | 0 |
| Mode M0 | |||
|---|---|---|---|
| Quadrant | BADHDUFLAG | Total packets | Discarded packets |
| A | 0 | 11139 | 3 |
| B | 0 | 14228 | 2 |
| C | 0 | 16305 | 2 |
| D | 0 | 19621 | 2 |
| Mode SS | |||
|---|---|---|---|
| Quadrant | BADHDUFLAG | Total packets | Discarded packets |
| A | 0 | 106 | 0 |
| B | 0 | 106 | 0 |
| C | 0 | 106 | 0 |
| D | 0 | 106 | 0 |
| Quadrant | Total seconds | Saturated seconds | Saturation percentage |
|---|---|---|---|
| A | 5207 | 10 | 0.192049% |
| B | 5207 | 234 | 4.493950% |
| C | 5207 | 193 | 3.706549% |
| D | 5207 | 536 | 10.293835% |
Noise dominated data is calculated using 1-second bins in cleaned event files. If a bin has >2000 counts, and if more than 50% of those come from <1% of pixels, then it is considered to be noise-dominated and hence unusable.
| Quadrant | # 1 sec bins | Bins with >0 counts | Bins with >2000 counts | High rate bins dominated by noise | Noise dominated (total time) | Noise dominated (detector-on time) | Marked lightcurve |
|---|---|---|---|---|---|---|---|
| A | 7330 | 5208 | 0 | 0 | 0.00% | 0.00% | 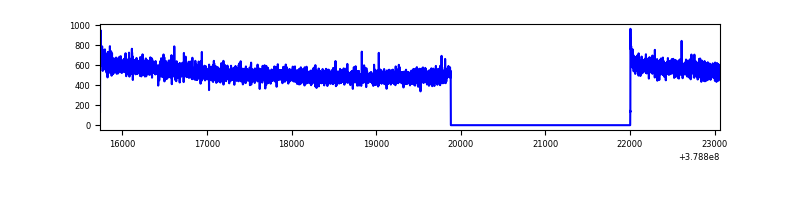 |
| B | 7330 | 5208 | 127 | 127 | 1.73% | 2.44% | 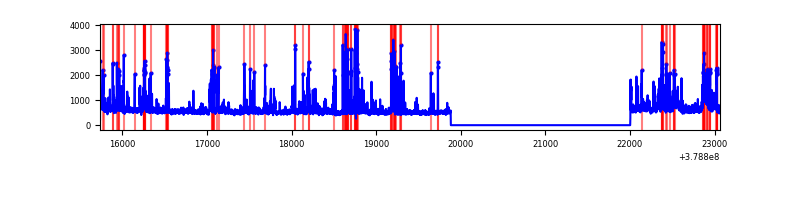 |
| C | 7330 | 5208 | 159 | 159 | 2.17% | 3.05% | 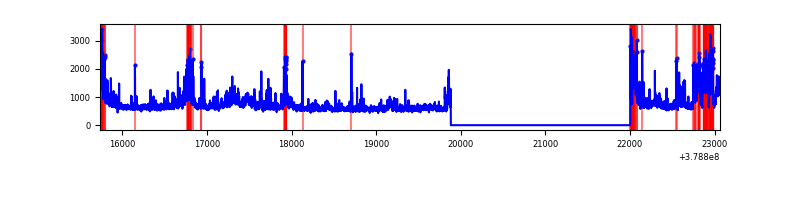 |
| D | 7330 | 5208 | 440 | 440 | 6.00% | 8.45% | 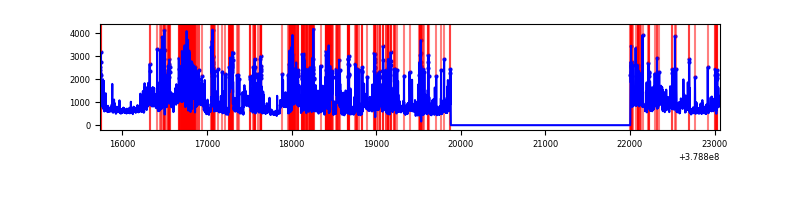 |
Top three noisy pixels from each quadrant. If the there are fewer than three noisy pixels in the level2.evt file, extra rows are filled as -1
| Pixel properties | Quadrant properties | ||||||
|---|---|---|---|---|---|---|---|
| Quadrant | DetID | PixID | Counts | Sigma | Mean | Median | Sigma |
| A | 10 | 83 | 11761 | 78.92 | 706 | 693 | 140.2 |
| A | 13 | 6 | 11254 | 75.31 | 706 | 693 | 140.2 |
| A | 13 | 254 | 9618 | 63.64 | 706 | 693 | 140.2 |
| B | 5 | 172 | 816818 | 6307.34 | 685 | 668 | 129.4 |
| B | 5 | 255 | 64947 | 496.76 | 685 | 668 | 129.4 |
| B | 0 | 199 | 25427 | 191.34 | 685 | 668 | 129.4 |
| C | 3 | 233 | 412340 | 2675.69 | 677 | 687 | 153.8 |
| C | 9 | 187 | 327946 | 2127.14 | 677 | 687 | 153.8 |
| C | 0 | 10 | 291200 | 1888.3 | 677 | 687 | 153.8 |
| D | 2 | 249 | 638150 | 3930.96 | 663 | 645 | 162.2 |
| D | 8 | 195 | 612855 | 3774.99 | 663 | 645 | 162.2 |
| D | 12 | 235 | 597508 | 3680.35 | 663 | 645 | 162.2 |
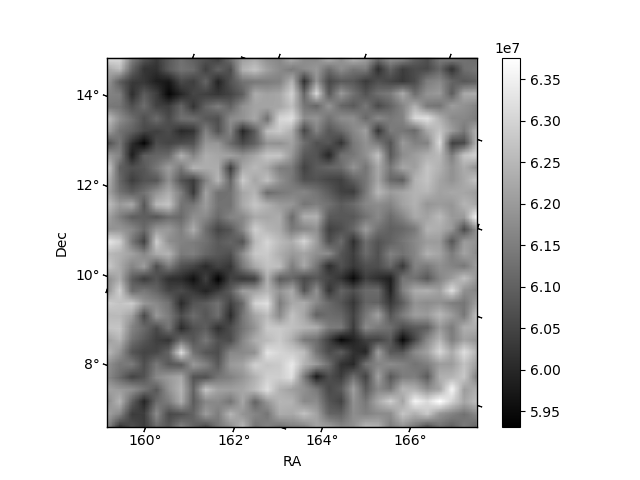
Histogram calculated using DETX and DETY for each event in the final _common_clean file
| Quadrant A | 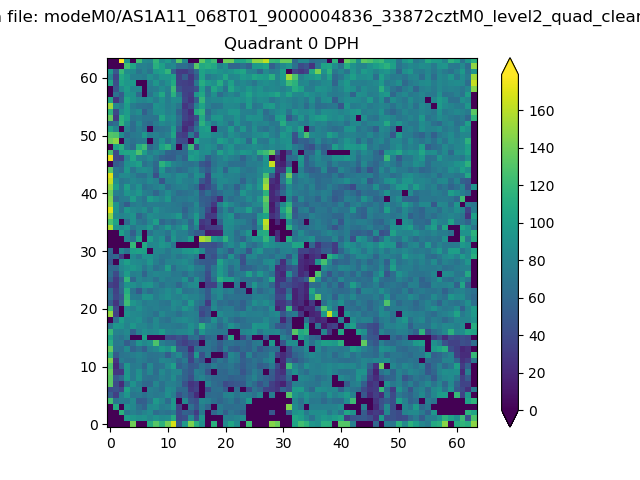 |
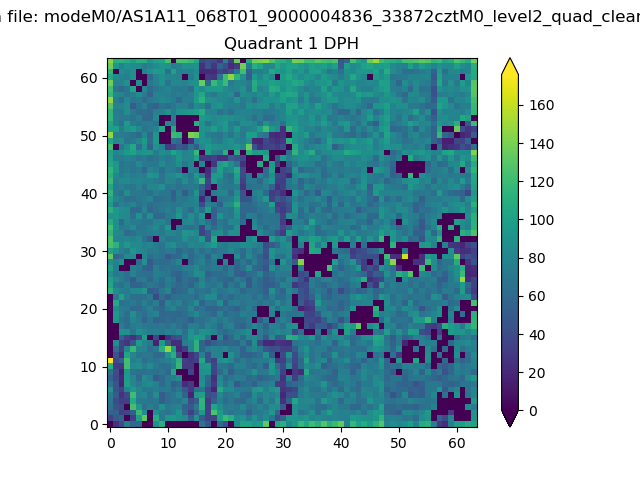 |
Quadrant B |
|---|---|---|---|
| Quadrant D | 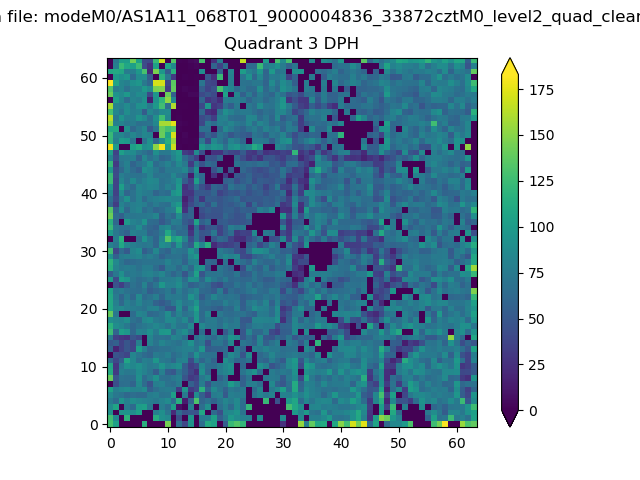 |
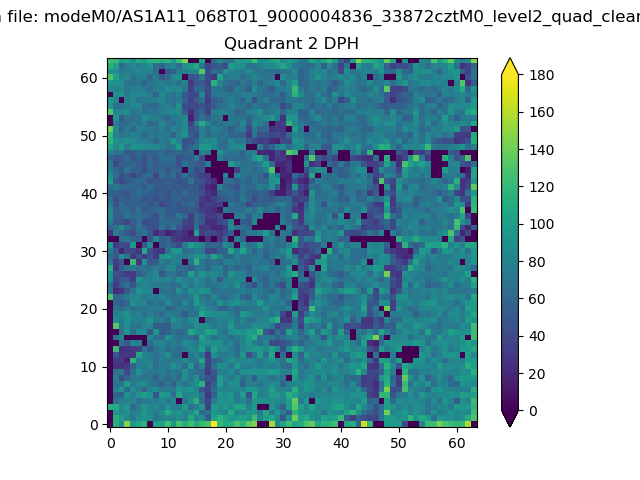 |
Quadrant C |
| Plot type | Count rate plots | Images |
|---|---|---|
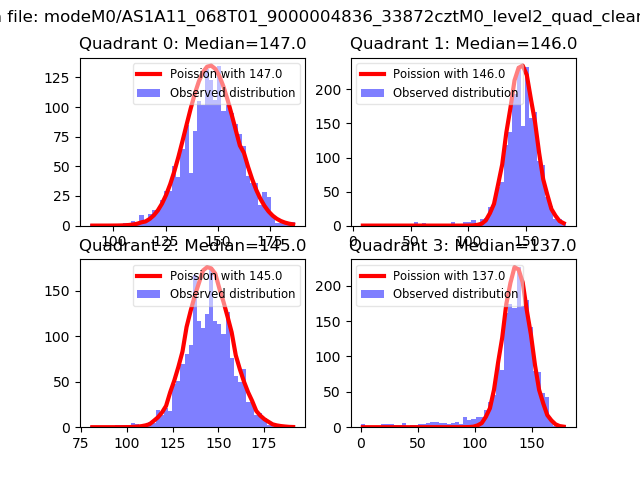
| Comparison with Poisson distribution Blue bars denote a histogram of data divided into 1 sec bins. Red curve is a Poisson curve with rate = median count rate of data. |
 |
 |
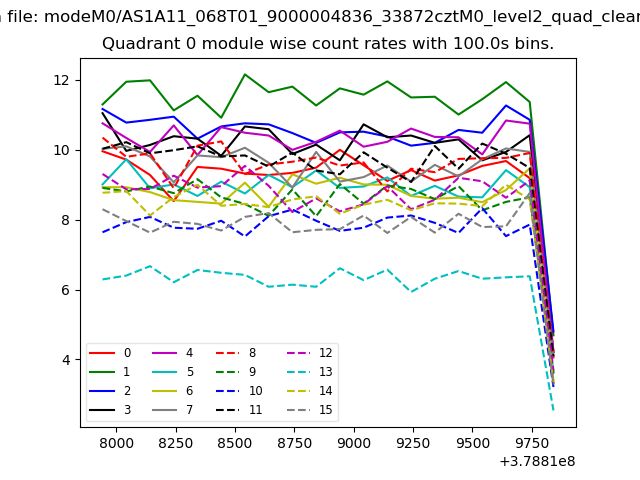
| Quadrant-wise count rates Data is divided into 100 sec bins |
 |
|
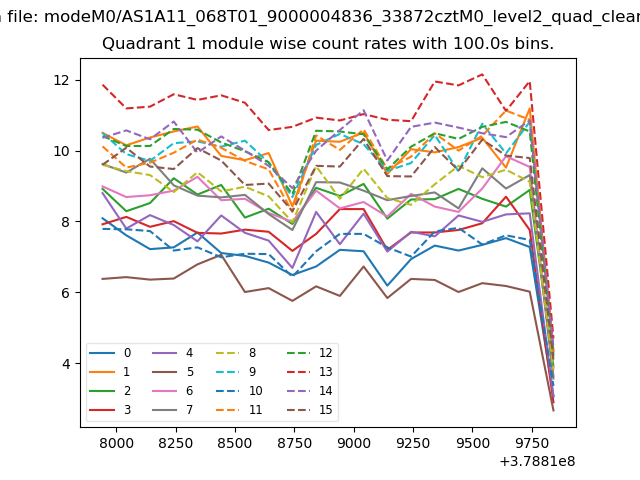
| Module-wise count rates for Quadrant A Data is divided into 100 sec bins |
 |
 |
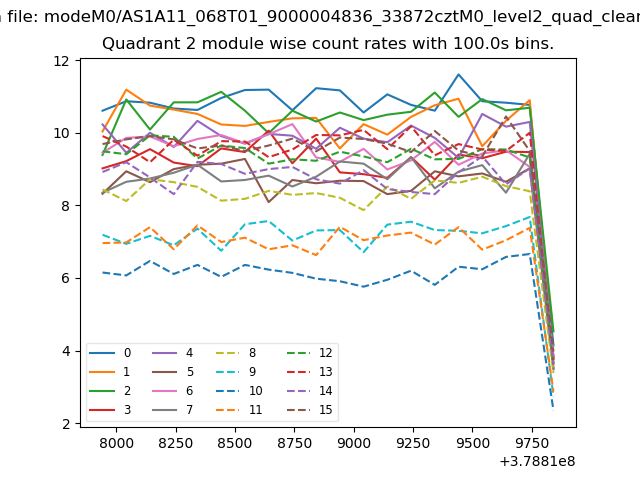
| Module-wise count rates for Quadrant B Data is divided into 100 sec bins |
 |
 |
| Module-wise count rates for Quadrant C Data is divided into 100 sec bins |
 |
 |
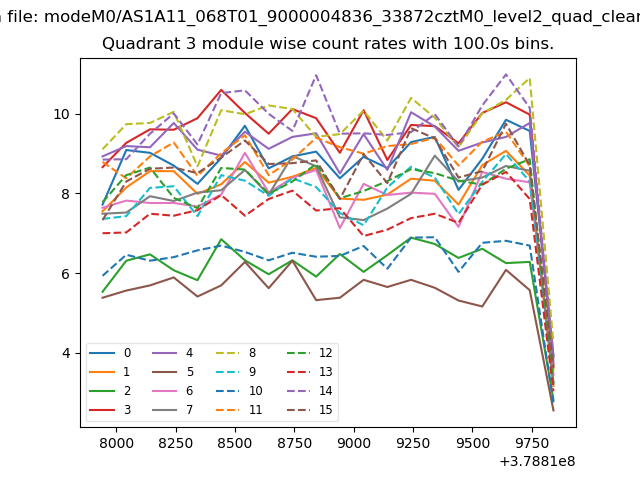
| Module-wise count rates for Quadrant D Data is divided into 100 sec bins |
 |
 |
| Parameter | Plot |
|---|---|
| CZT HV Monitor |  |
| D_VDD |  |
| Temperature 1 | 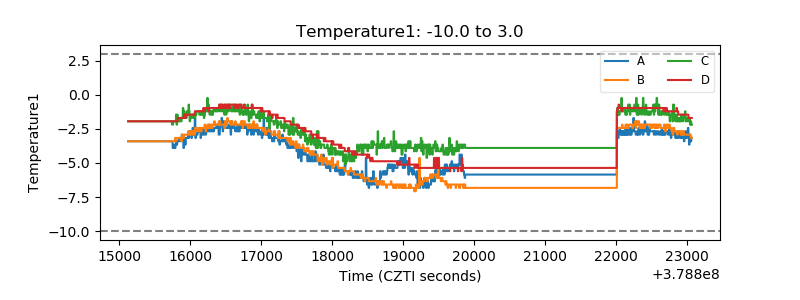 |
| Veto HV Monitor |  |
| Veto LLD | 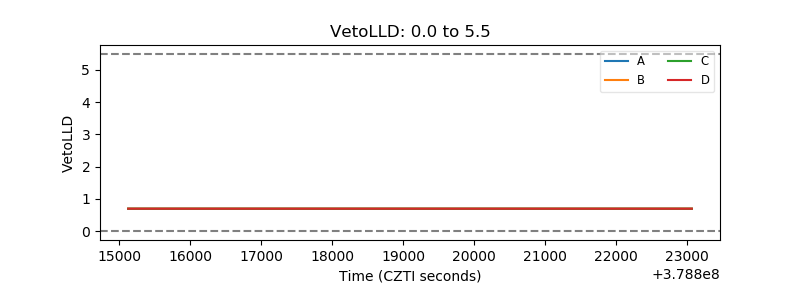 |
| Alpha Counter | 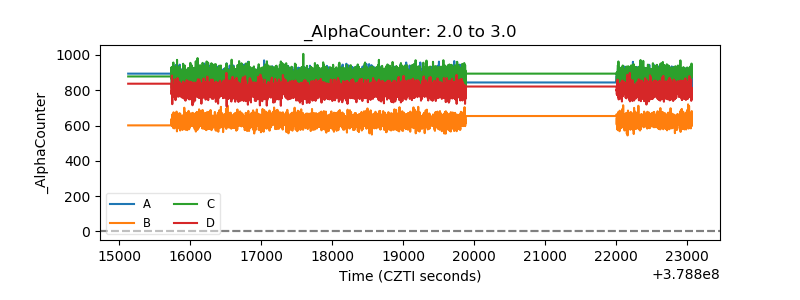 |
| _CPM_Rate | 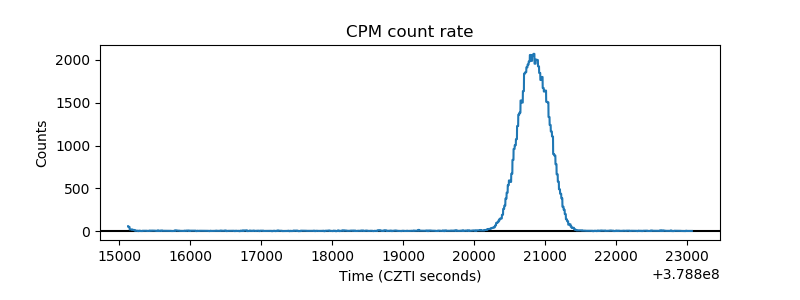 |
| CZT Counter | 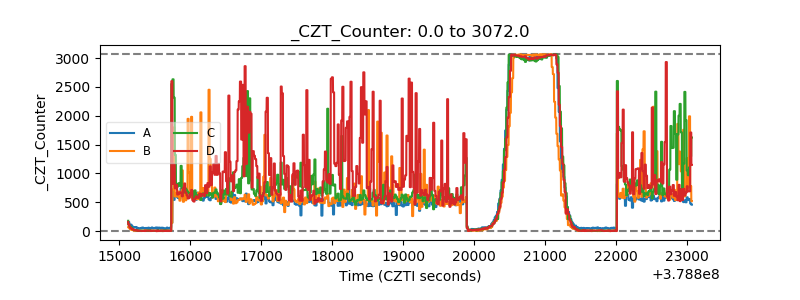 |
| +2.5 Volts monitor | 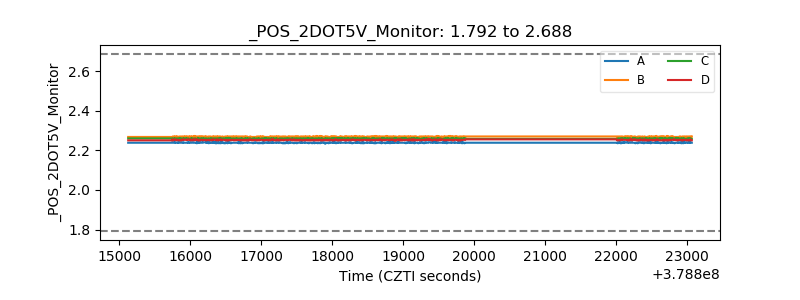 |
| +5 Volts monitor |  |
| _ROLL_ROT | 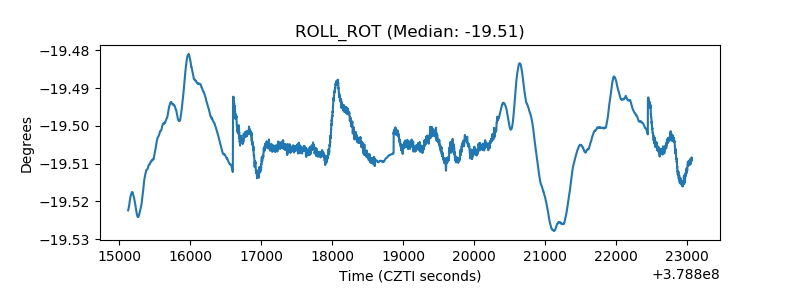 |
| _Roll_DEC | 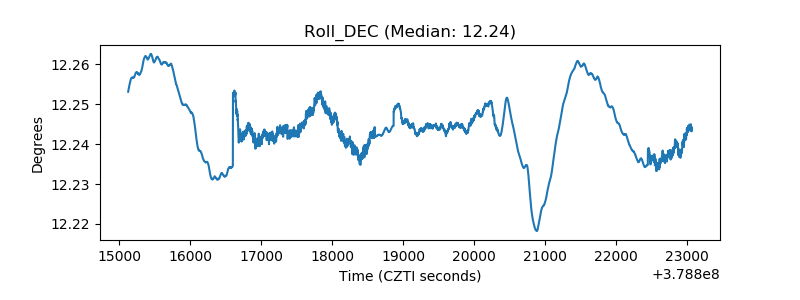 |
| _Roll_RA | 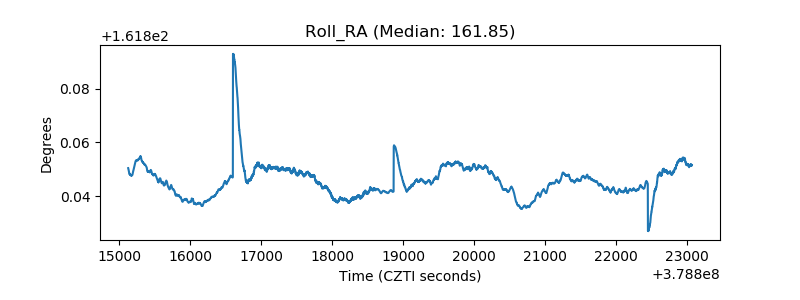 |
| Veto Counter | 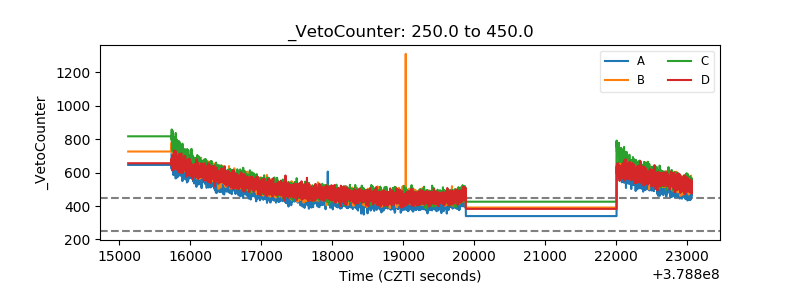 |