| Param | Original file | Final file |
|---|---|---|
| Filename | modeM0/AS1A11_068T01_9000004836_33873cztM0_level2.evt | modeM0/AS1A11_068T01_9000004836_33873cztM0_level2_quad_clean.evt |
| Size (bytes) | 537,903,360 | 54,296,640 |
| Size | 513.0 MB | 51.8 MB |
| Events in quadrant A | 2,615,990 | 339,228 |
| Events in quadrant B | 4,062,427 | 316,983 |
| Events in quadrant C | 4,024,205 | 333,120 |
| Events in quadrant D | 5,243,257 | 297,158 |
| Mode M9 | |||
|---|---|---|---|
| Quadrant | BADHDUFLAG | Total packets | Discarded packets |
| A | 0 | 28 | 0 |
| B | 0 | 28 | 0 |
| C | 0 | 28 | 0 |
| D | 0 | 29 | 0 |
| Mode M0 | |||
|---|---|---|---|
| Quadrant | BADHDUFLAG | Total packets | Discarded packets |
| A | 0 | 10693 | 3 |
| B | 0 | 15346 | 2 |
| C | 0 | 15548 | 2 |
| D | 0 | 19132 | 2 |
| Mode SS | |||
|---|---|---|---|
| Quadrant | BADHDUFLAG | Total packets | Discarded packets |
| A | 0 | 104 | 0 |
| B | 0 | 104 | 0 |
| C | 0 | 104 | 0 |
| D | 0 | 104 | 0 |
| Quadrant | Total seconds | Saturated seconds | Saturation percentage |
|---|---|---|---|
| A | 5094 | 13 | 0.255202% |
| B | 5094 | 448 | 8.794660% |
| C | 5094 | 235 | 4.613271% |
| D | 5094 | 600 | 11.778563% |
Noise dominated data is calculated using 1-second bins in cleaned event files. If a bin has >2000 counts, and if more than 50% of those come from <1% of pixels, then it is considered to be noise-dominated and hence unusable.
| Quadrant | # 1 sec bins | Bins with >0 counts | Bins with >2000 counts | High rate bins dominated by noise | Noise dominated (total time) | Noise dominated (detector-on time) | Marked lightcurve |
|---|---|---|---|---|---|---|---|
| A | 7247 | 5095 | 0 | 0 | 0.00% | 0.00% | 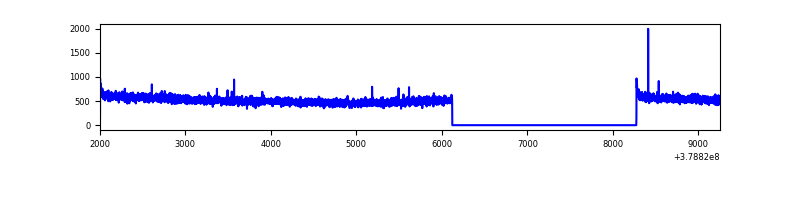 |
| B | 7247 | 5095 | 296 | 296 | 4.08% | 5.81% | 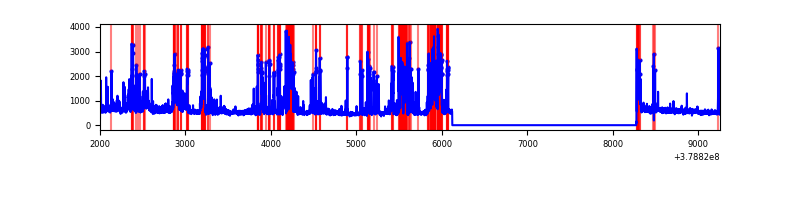 |
| C | 7247 | 5095 | 172 | 172 | 2.37% | 3.38% | 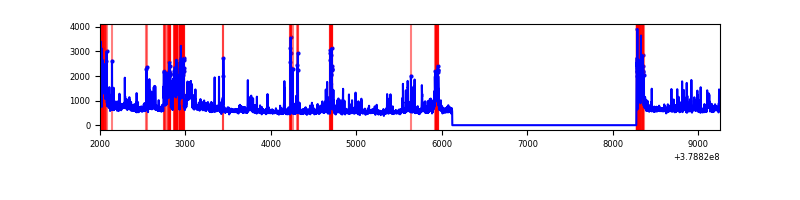 |
| D | 7247 | 5095 | 547 | 547 | 7.55% | 10.74% | 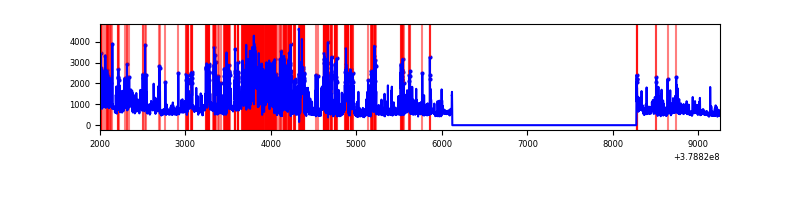 |
Top three noisy pixels from each quadrant. If the there are fewer than three noisy pixels in the level2.evt file, extra rows are filled as -1
| Pixel properties | Quadrant properties | ||||||
|---|---|---|---|---|---|---|---|
| Quadrant | DetID | PixID | Counts | Sigma | Mean | Median | Sigma |
| A | 13 | 6 | 13158 | 93.99 | 671 | 659 | 133.0 |
| A | 10 | 83 | 11713 | 83.12 | 671 | 659 | 133.0 |
| A | 13 | 254 | 9619 | 67.37 | 671 | 659 | 133.0 |
| B | 5 | 172 | 1343626 | 11065.07 | 642 | 627 | 121.4 |
| B | 5 | 255 | 41224 | 334.48 | 642 | 627 | 121.4 |
| B | 0 | 199 | 29399 | 237.05 | 642 | 627 | 121.4 |
| C | 3 | 233 | 415127 | 2844.74 | 641 | 649 | 145.7 |
| C | 0 | 10 | 355378 | 2434.65 | 641 | 649 | 145.7 |
| C | 3 | 9 | 265455 | 1817.48 | 641 | 649 | 145.7 |
| D | 12 | 235 | 1428155 | 9212.48 | 627 | 610 | 155.0 |
| D | 8 | 195 | 465367 | 2999.25 | 627 | 610 | 155.0 |
| D | 7 | 223 | 222853 | 1434.22 | 627 | 610 | 155.0 |
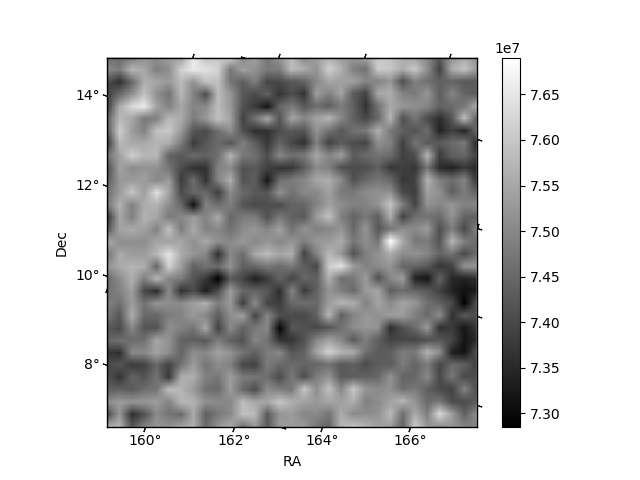
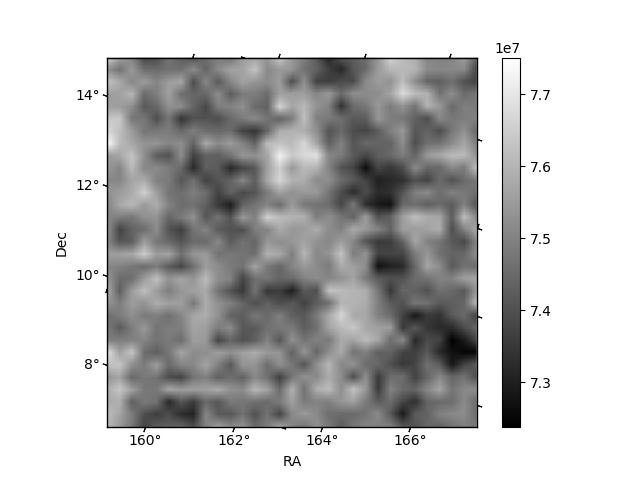
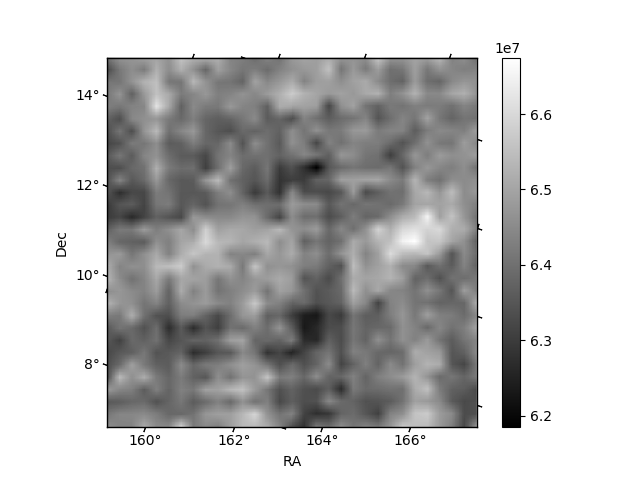
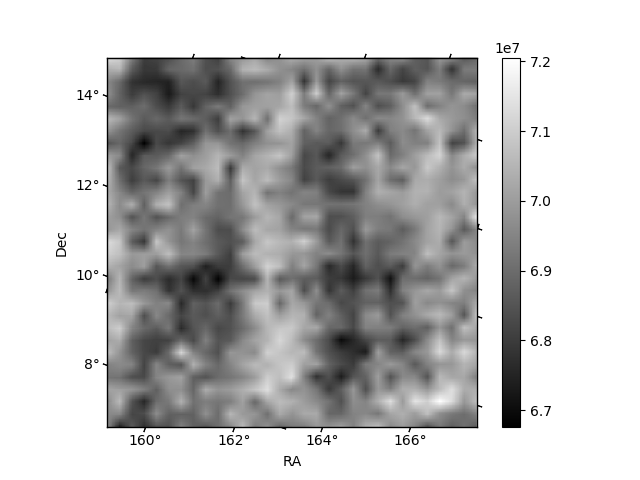
Histogram calculated using DETX and DETY for each event in the final _common_clean file
| Quadrant A | 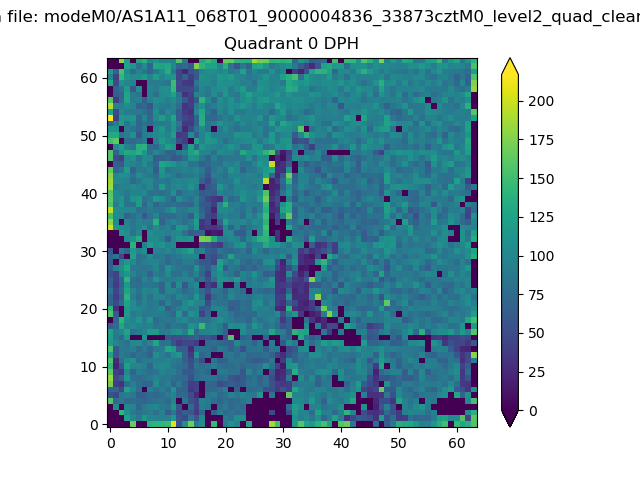 |
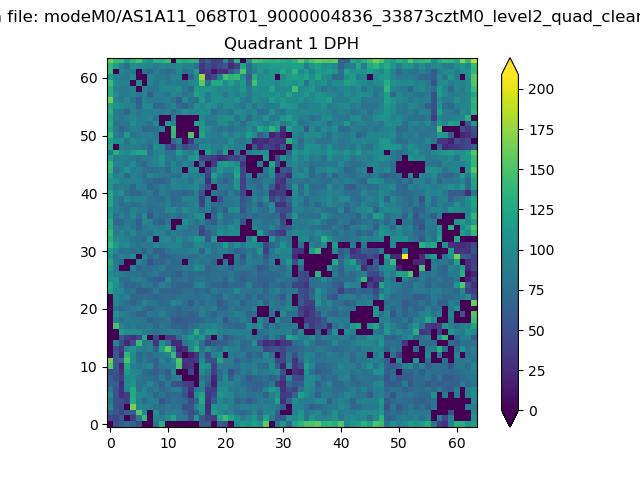 |
Quadrant B |
|---|---|---|---|
| Quadrant D | 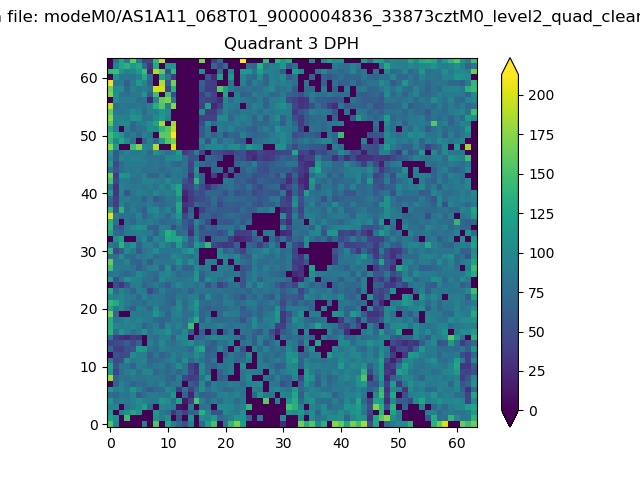 |
 |
Quadrant C |
| Plot type | Count rate plots | Images |
|---|---|---|
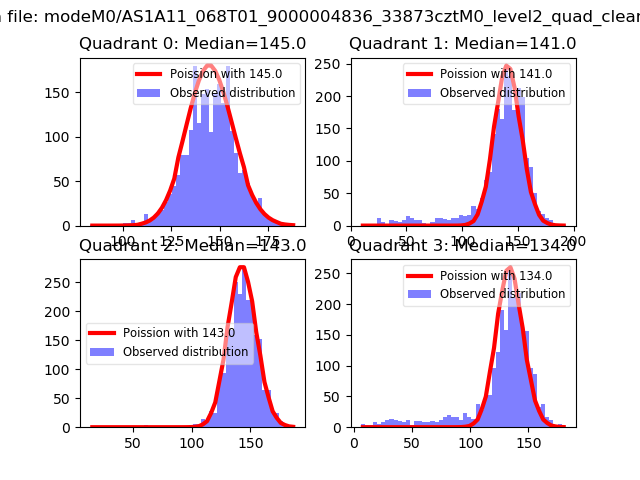
| Comparison with Poisson distribution Blue bars denote a histogram of data divided into 1 sec bins. Red curve is a Poisson curve with rate = median count rate of data. |
 |
 |
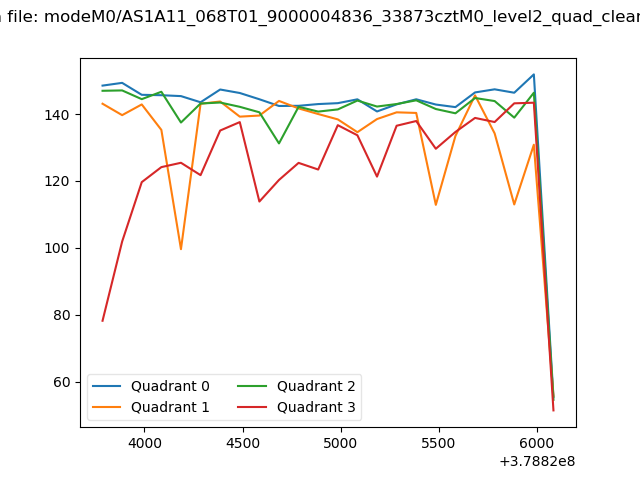
| Quadrant-wise count rates Data is divided into 100 sec bins |
 |
|
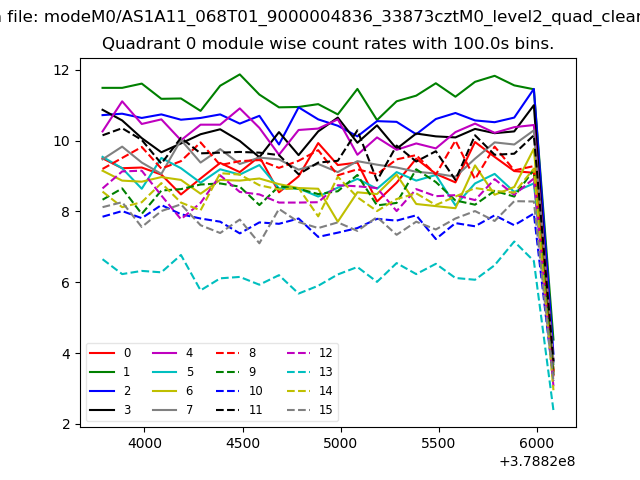
| Module-wise count rates for Quadrant A Data is divided into 100 sec bins |
 |
 |
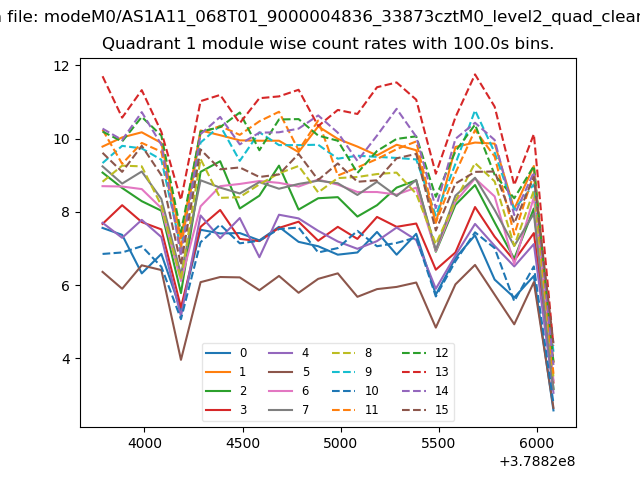
| Module-wise count rates for Quadrant B Data is divided into 100 sec bins |
 |
 |
| Module-wise count rates for Quadrant C Data is divided into 100 sec bins |
 |
 |
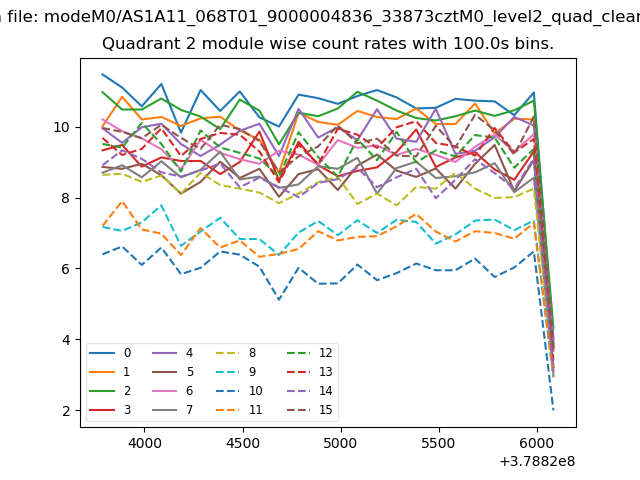
| Module-wise count rates for Quadrant D Data is divided into 100 sec bins |
 |
 |
| Parameter | Plot |
|---|---|
| CZT HV Monitor | 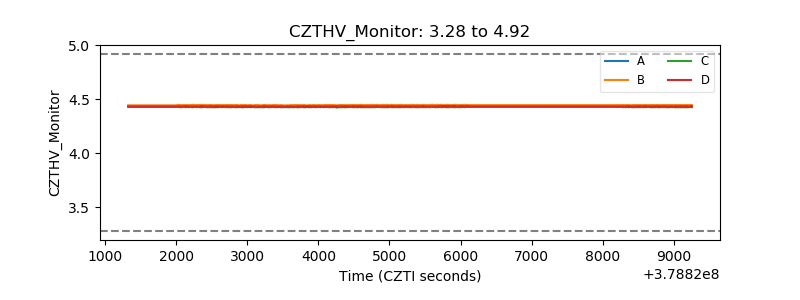 |
| D_VDD | 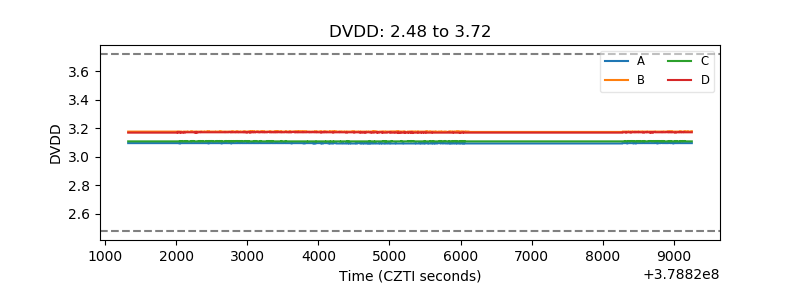 |
| Temperature 1 | 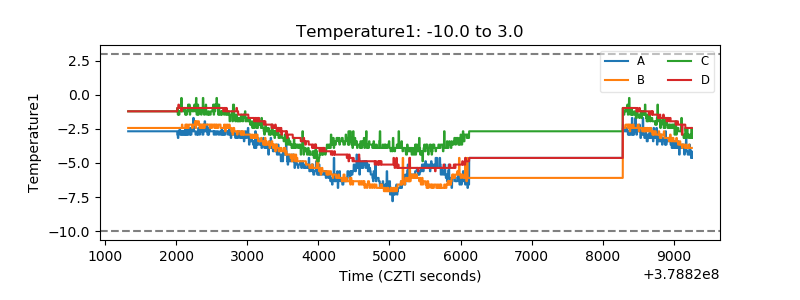 |
| Veto HV Monitor | 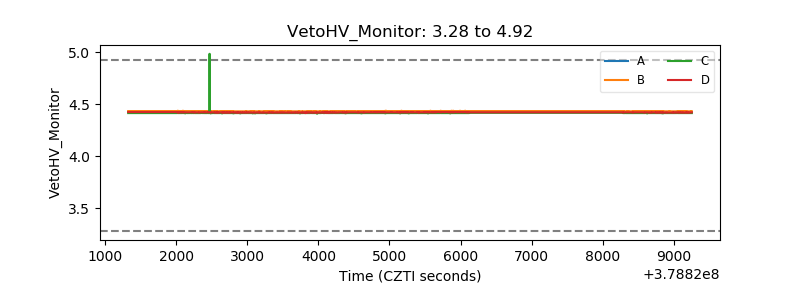 |
| Veto LLD | 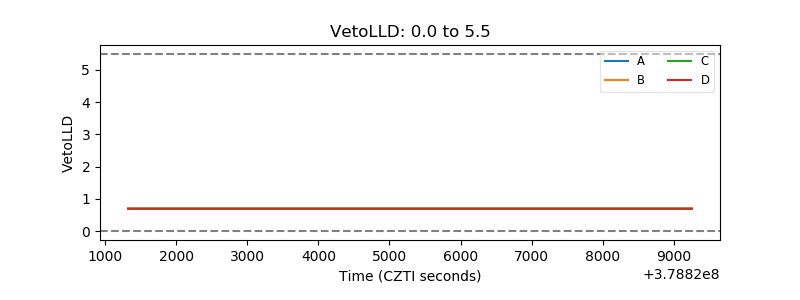 |
| Alpha Counter | 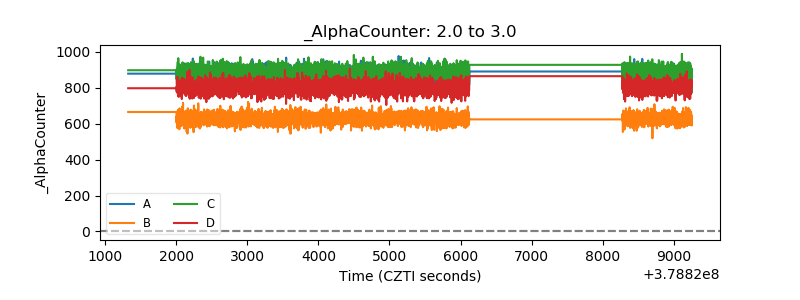 |
| _CPM_Rate | 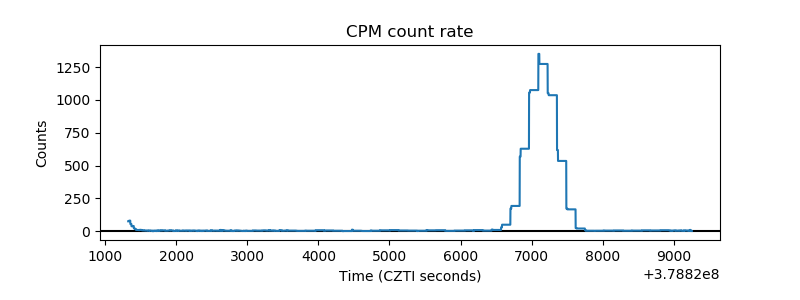 |
| CZT Counter |  |
| +2.5 Volts monitor |  |
| +5 Volts monitor |  |
| _ROLL_ROT |  |
| _Roll_DEC |  |
| _Roll_RA |  |
| Veto Counter |  |