| Param | Original file | Final file |
|---|---|---|
| Filename | modeM0/AS1A11_068T01_9000004836_33874cztM0_level2.evt | modeM0/AS1A11_068T01_9000004836_33874cztM0_level2_quad_clean.evt |
| Size (bytes) | 465,088,320 | 61,623,360 |
| Size | 443.5 MB | 58.8 MB |
| Events in quadrant A | 2,517,720 | 390,861 |
| Events in quadrant B | 3,168,611 | 384,731 |
| Events in quadrant C | 3,912,436 | 384,767 |
| Events in quadrant D | 4,149,173 | 356,431 |
| Mode M9 | |||
|---|---|---|---|
| Quadrant | BADHDUFLAG | Total packets | Discarded packets |
| A | 0 | 26 | 0 |
| B | 0 | 26 | 0 |
| C | 0 | 26 | 0 |
| D | 0 | 27 | 0 |
| Mode M0 | |||
|---|---|---|---|
| Quadrant | BADHDUFLAG | Total packets | Discarded packets |
| A | 0 | 10536 | 3 |
| B | 0 | 12493 | 2 |
| C | 0 | 15216 | 2 |
| D | 0 | 15730 | 2 |
| Mode SS | |||
|---|---|---|---|
| Quadrant | BADHDUFLAG | Total packets | Discarded packets |
| A | 0 | 102 | 0 |
| B | 0 | 102 | 0 |
| C | 0 | 102 | 0 |
| D | 0 | 102 | 0 |
| Quadrant | Total seconds | Saturated seconds | Saturation percentage |
|---|---|---|---|
| A | 4973 | 8 | 0.160869% |
| B | 4973 | 187 | 3.760306% |
| C | 4973 | 207 | 4.162477% |
| D | 4973 | 312 | 6.273879% |
Noise dominated data is calculated using 1-second bins in cleaned event files. If a bin has >2000 counts, and if more than 50% of those come from <1% of pixels, then it is considered to be noise-dominated and hence unusable.
| Quadrant | # 1 sec bins | Bins with >0 counts | Bins with >2000 counts | High rate bins dominated by noise | Noise dominated (total time) | Noise dominated (detector-on time) | Marked lightcurve |
|---|---|---|---|---|---|---|---|
| A | 7064 | 4974 | 0 | 0 | 0.00% | 0.00% | 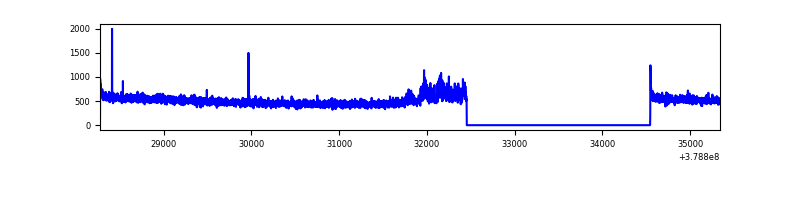 |
| B | 7064 | 4974 | 129 | 129 | 1.83% | 2.59% | 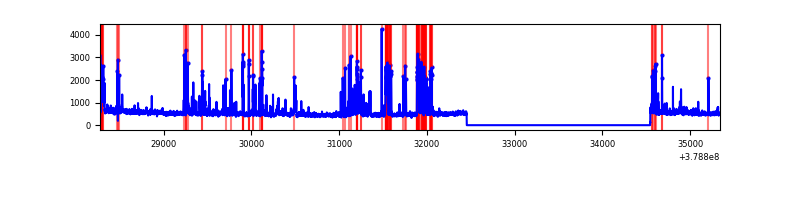 |
| C | 7064 | 4974 | 149 | 149 | 2.11% | 3.00% | 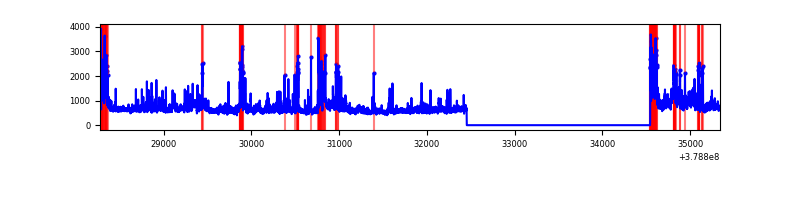 |
| D | 7064 | 4974 | 327 | 327 | 4.63% | 6.57% | 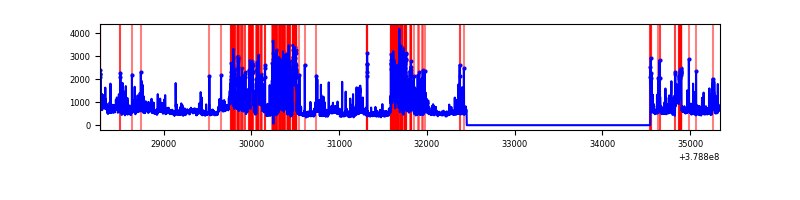 |
Top three noisy pixels from each quadrant. If the there are fewer than three noisy pixels in the level2.evt file, extra rows are filled as -1
| Pixel properties | Quadrant properties | ||||||
|---|---|---|---|---|---|---|---|
| Quadrant | DetID | PixID | Counts | Sigma | Mean | Median | Sigma |
| A | 15 | 169 | 102825 | 825.25 | 619 | 607 | 123.9 |
| A | 10 | 83 | 11852 | 90.79 | 619 | 607 | 123.9 |
| A | 13 | 254 | 8679 | 65.17 | 619 | 607 | 123.9 |
| B | 5 | 172 | 662934 | 5706.39 | 608 | 593 | 116.1 |
| B | 0 | 199 | 30526 | 257.89 | 608 | 593 | 116.1 |
| B | 4 | 232 | 19497 | 162.87 | 608 | 593 | 116.1 |
| C | 3 | 233 | 731954 | 5349.73 | 594 | 599 | 136.7 |
| C | 0 | 10 | 424473 | 3100.56 | 594 | 599 | 136.7 |
| C | 15 | 214 | 213663 | 1558.53 | 594 | 599 | 136.7 |
| D | 12 | 235 | 1056030 | 7154.17 | 594 | 579 | 147.5 |
| D | 8 | 195 | 299983 | 2029.45 | 594 | 579 | 147.5 |
| D | 1 | 47 | 145747 | 983.99 | 594 | 579 | 147.5 |
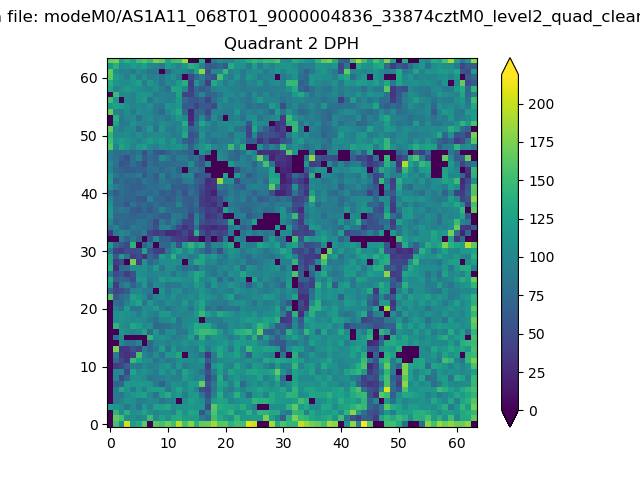
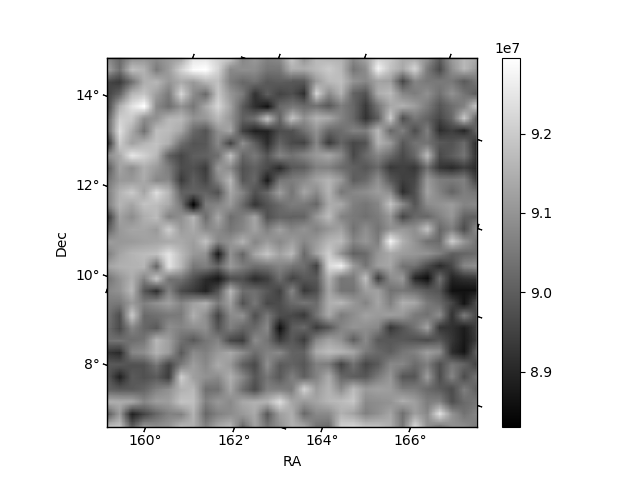
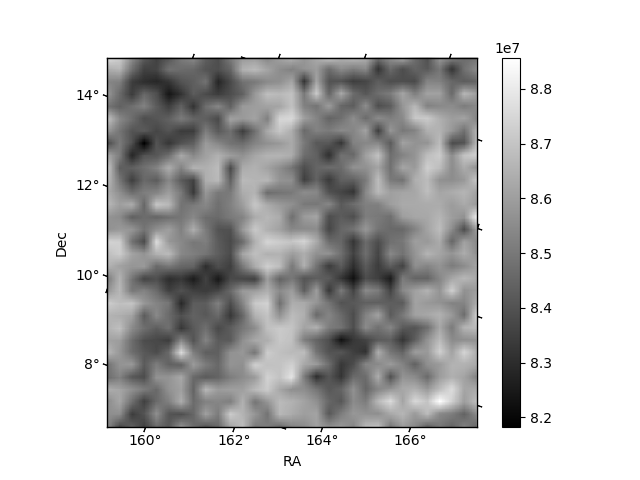
Histogram calculated using DETX and DETY for each event in the final _common_clean file
| Quadrant A |  |
 |
Quadrant B |
|---|---|---|---|
| Quadrant D | 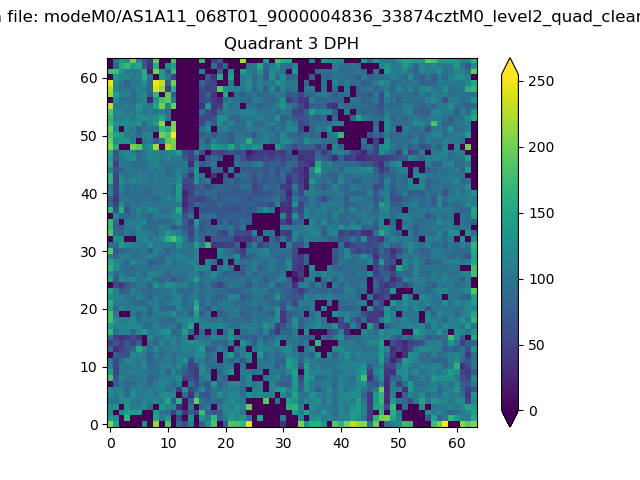 |
 |
Quadrant C |
| Plot type | Count rate plots | Images |
|---|---|---|
| Comparison with Poisson distribution Blue bars denote a histogram of data divided into 1 sec bins. Red curve is a Poisson curve with rate = median count rate of data. |
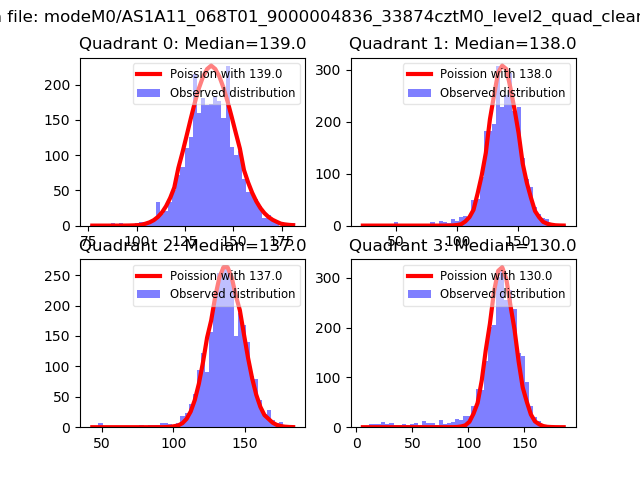 |
 |
| Quadrant-wise count rates Data is divided into 100 sec bins |
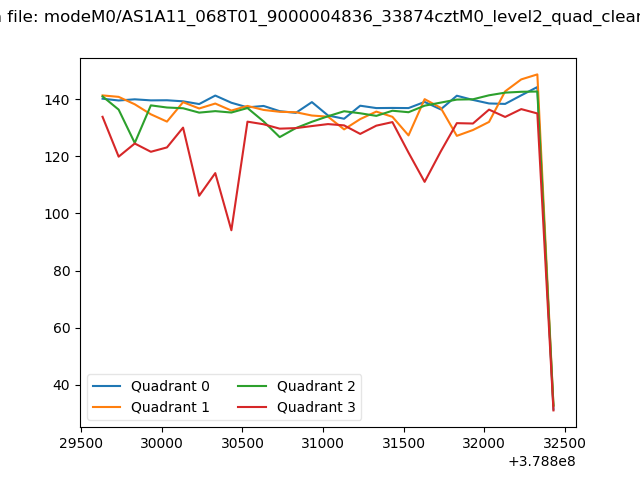 |
|
| Module-wise count rates for Quadrant A Data is divided into 100 sec bins |
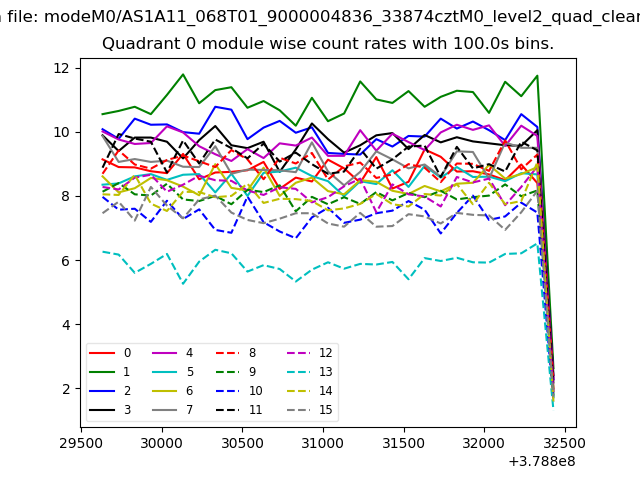 |
 |
| Module-wise count rates for Quadrant B Data is divided into 100 sec bins |
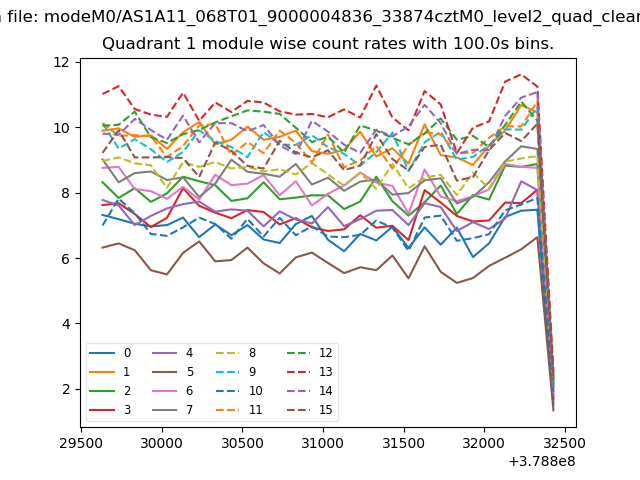 |
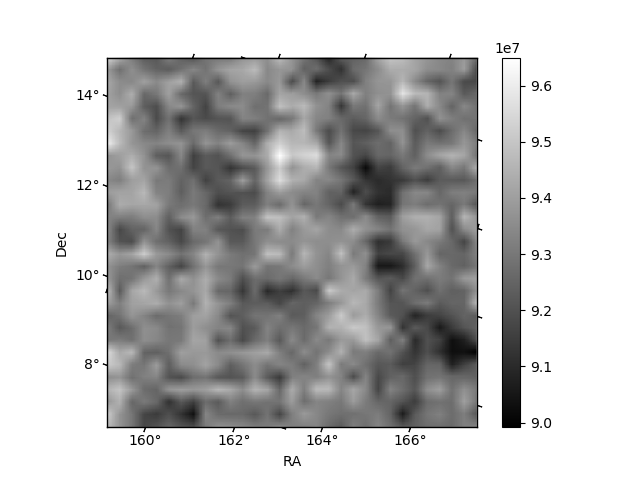 |
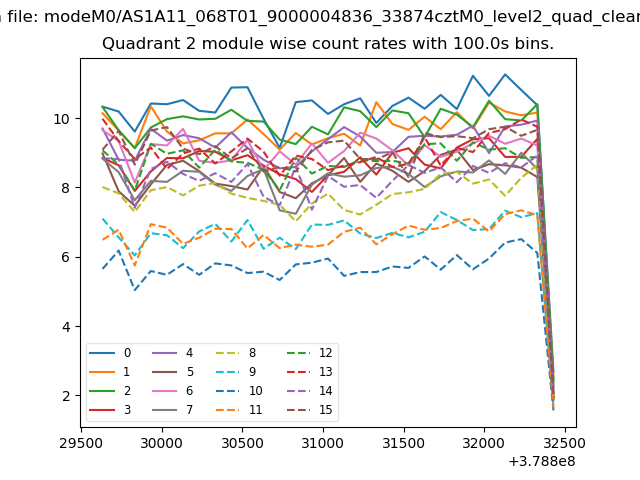
| Module-wise count rates for Quadrant C Data is divided into 100 sec bins |
 |
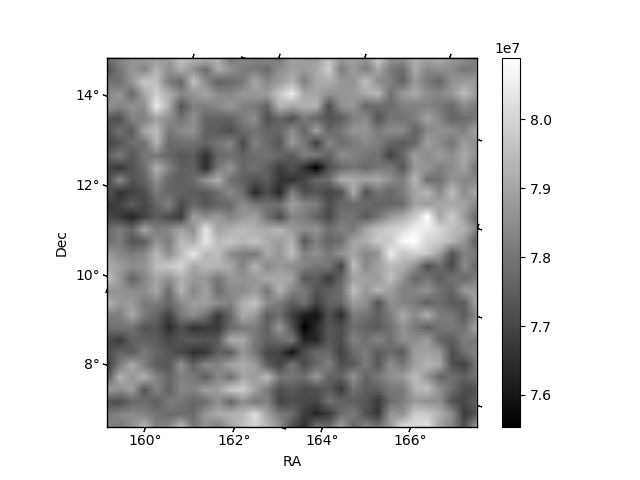 |
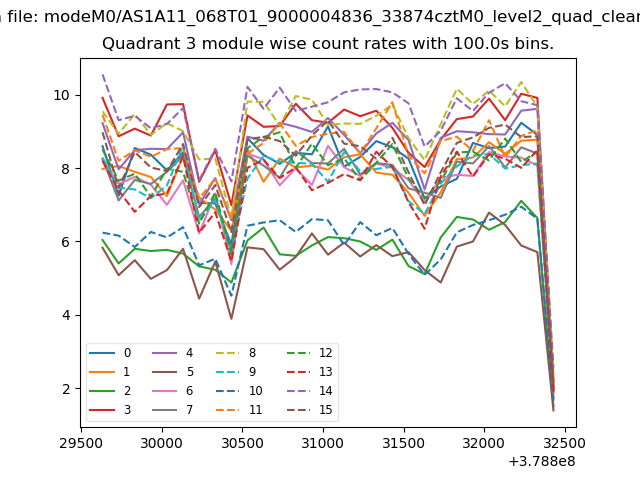
| Module-wise count rates for Quadrant D Data is divided into 100 sec bins |
 |
 |
| Parameter | Plot |
|---|---|
| CZT HV Monitor | 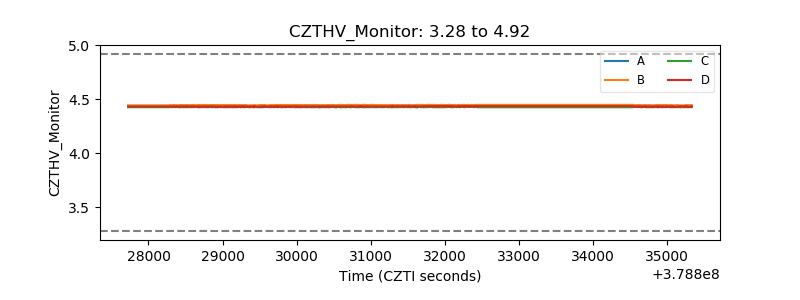 |
| D_VDD | 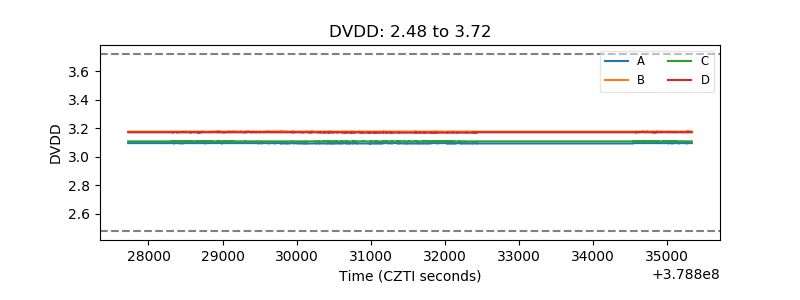 |
| Temperature 1 | 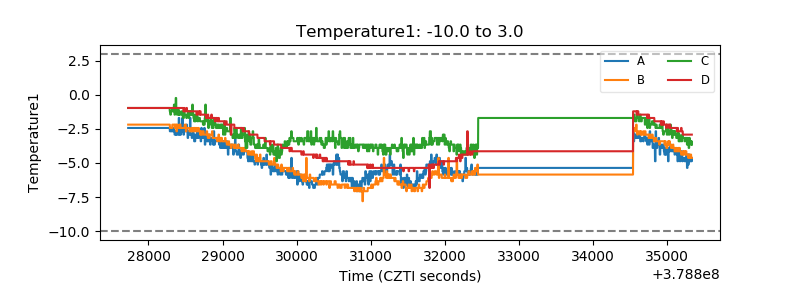 |
| Veto HV Monitor |  |
| Veto LLD | 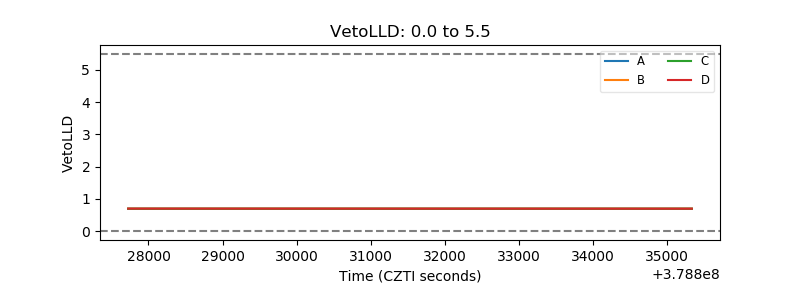 |
| Alpha Counter | 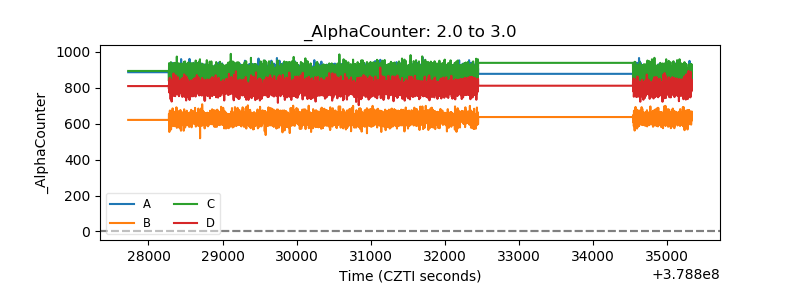 |
| _CPM_Rate | 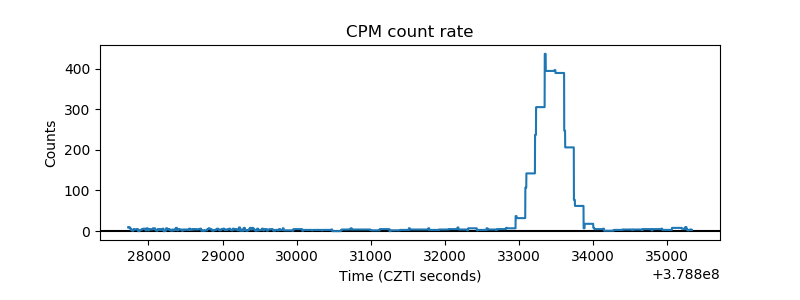 |
| CZT Counter | 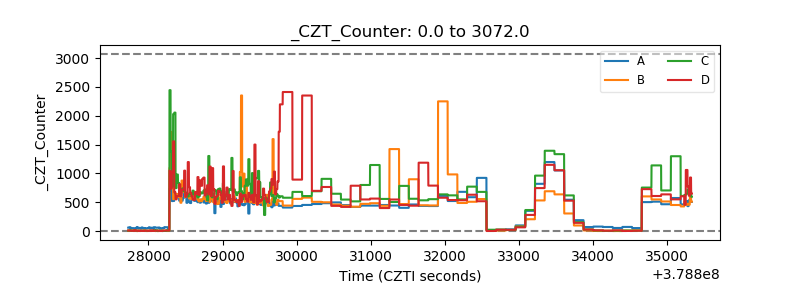 |
| +2.5 Volts monitor |  |
| +5 Volts monitor |  |
| _ROLL_ROT | 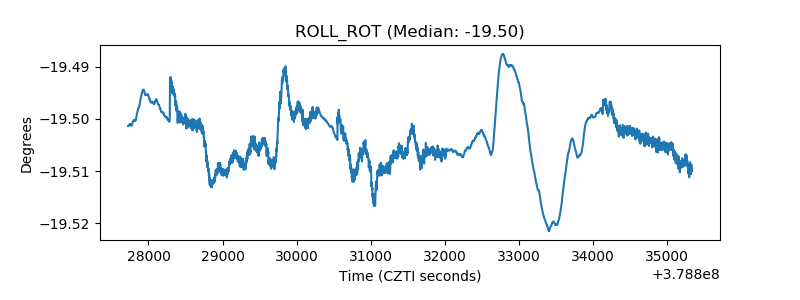 |
| _Roll_DEC |  |
| _Roll_RA | 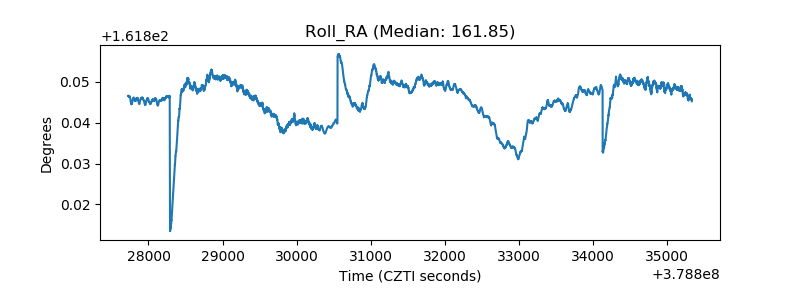 |
| Veto Counter | 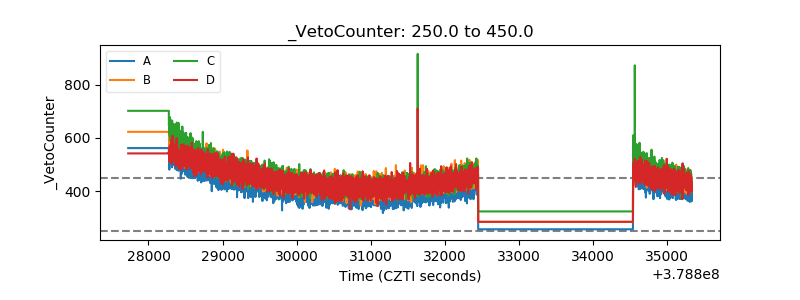 |