| Param | Original file | Final file |
|---|---|---|
| Filename | modeM0/AS1T04_090T01_9000004840cztM0_level2.fits | modeM0/AS1T04_090T01_9000004840cztM0_level2_quad_clean.evt |
| Size (bytes) | 957,968,640 | 869,561,280 |
| Size | 913.6 MB | 829.3 MB |
| Events in quadrant A | 5,790,444 | 4,947,493 |
| Events in quadrant B | 5,613,570 | 5,118,716 |
| Events in quadrant C | 5,874,644 | 5,059,687 |
| Events in quadrant D | 4,824,310 | 4,307,193 |
| Mode M9 | |||
|---|---|---|---|
| Quadrant | BADHDUFLAG | Total packets | Discarded packets |
| A | 0 | 395 | 0 |
| B | 0 | 395 | 0 |
| C | 0 | 395 | 0 |
| D | 0 | 395 | 0 |
| Mode M0 | |||
|---|---|---|---|
| Quadrant | BADHDUFLAG | Total packets | Discarded packets |
| A | 0 | 289411 | 0 |
| B | 0 | 253399 | 0 |
| C | 0 | 228725 | 0 |
| D | 0 | 367147 | 0 |
| Mode SS | |||
|---|---|---|---|
| Quadrant | BADHDUFLAG | Total packets | Discarded packets |
| A | 0 | 2054 | 0 |
| B | 0 | 2054 | 0 |
| C | 0 | 2054 | 0 |
| D | 0 | 2054 | 0 |
| Quadrant | Total seconds | Saturated seconds | Saturation percentage |
|---|---|---|---|
| A | 100689 | 8543 | 8.484542% |
| B | 100689 | 4358 | 4.328179% |
| C | 100689 | 1388 | 1.378502% |
| D | 100689 | 9351 | 9.287012% |
Noise dominated data is calculated using 1-second bins in cleaned event files. If a bin has >2000 counts, and if more than 50% of those come from <1% of pixels, then it is considered to be noise-dominated and hence unusable.
| Quadrant | # 1 sec bins | Bins with >0 counts | Bins with >2000 counts | High rate bins dominated by noise | Noise dominated (total time) | Noise dominated (detector-on time) | Marked lightcurve |
|---|---|---|---|---|---|---|---|
| A | 139017 | 100561 | 0 | 0 | 0.00% | 0.00% |  |
| B | 139017 | 100610 | 0 | 0 | 0.00% | 0.00% |  |
| C | 139017 | 100666 | 0 | 0 | 0.00% | 0.00% |  |
| D | 139017 | 100611 | 0 | 0 | 0.00% | 0.00% |  |
Top three noisy pixels from each quadrant. If the there are fewer than three noisy pixels in the level2.evt file, extra rows are filled as -1
| Pixel properties | Quadrant properties | ||||||
|---|---|---|---|---|---|---|---|
| Quadrant | DetID | PixID | Counts | Sigma | Mean | Median | Sigma |
| A | 9 | 19 | 4694 | 8.85 | 1510 | 1424 | 369.3 |
| A | 7 | 110 | 4653 | 8.74 | 1510 | 1424 | 369.3 |
| A | 0 | 29 | 4550 | 8.46 | 1510 | 1424 | 369.3 |
| B | 2 | 9 | 4866 | 11.81 | 1488 | 1426 | 291.3 |
| B | 3 | 80 | 4473 | 10.46 | 1488 | 1426 | 291.3 |
| B | 2 | 8 | 3922 | 8.57 | 1488 | 1426 | 291.3 |
| C | 1 | 81 | 5010 | 9.06 | 1553 | 1464 | 391.4 |
| C | 1 | 80 | 4855 | 8.66 | 1553 | 1464 | 391.4 |
| C | 3 | 203 | 4474 | 7.69 | 1553 | 1464 | 391.4 |
| D | 4 | 160 | 3582 | 6.43 | 1383 | 1266 | 360.5 |
| D | 7 | 3 | 3555 | 6.35 | 1383 | 1266 | 360.5 |
| D | 10 | 113 | 3511 | 6.23 | 1383 | 1266 | 360.5 |
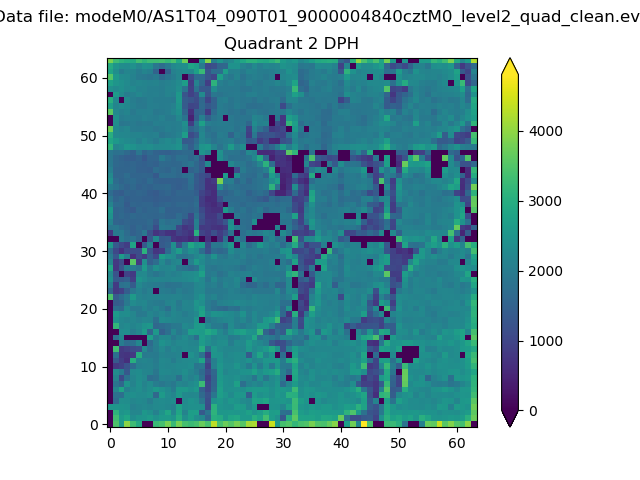
Histogram calculated using DETX and DETY for each event in the final _common_clean file
| Quadrant A |  |
 |
Quadrant B |
|---|---|---|---|
| Quadrant D | 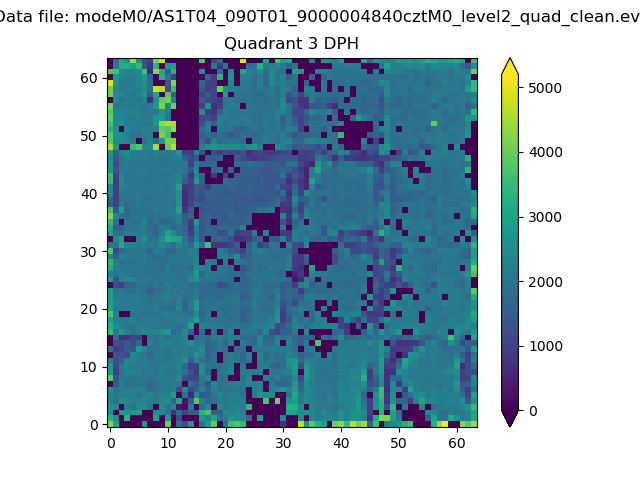 |
 |
Quadrant C |
| Plot type | Count rate plots | Images |
|---|---|---|
| Comparison with Poisson distribution Blue bars denote a histogram of data divided into 1 sec bins. Red curve is a Poisson curve with rate = median count rate of data. |
 |
 |
| Quadrant-wise count rates Data is divided into 100 sec bins |
 |
|
| Module-wise count rates for Quadrant A Data is divided into 100 sec bins |
 |
 |
| Module-wise count rates for Quadrant B Data is divided into 100 sec bins |
 |
 |
| Module-wise count rates for Quadrant C Data is divided into 100 sec bins |
 |
 |
| Module-wise count rates for Quadrant D Data is divided into 100 sec bins |
 |
 |
| Parameter | Plot |
|---|---|
| CZT HV Monitor |  |
| D_VDD |  |
| Temperature 1 |  |
| Veto HV Monitor |  |
| Veto LLD |  |
| Alpha Counter |  |
| _CPM_Rate |  |
| CZT Counter |  |
| +2.5 Volts monitor |  |
| +5 Volts monitor |  |
| _ROLL_ROT |  |
| _Roll_DEC |  |
| _Roll_RA |  |
| Veto Counter |  |