| Param | Original file | Final file |
|---|---|---|
| Filename | modeM0/AS1T04_090T01_9000004840_33884cztM0_level2.evt | modeM0/AS1T04_090T01_9000004840_33884cztM0_level2_quad_clean.evt |
| Size (bytes) | 92,266,560 | 21,064,320 |
| Size | 88.0 MB | 20.1 MB |
| Events in quadrant A | 477,369 | 148,440 |
| Events in quadrant B | 599,614 | 147,703 |
| Events in quadrant C | 741,972 | 139,831 |
| Events in quadrant D | 908,192 | 128,162 |
| Mode M9 | |||
|---|---|---|---|
| Quadrant | BADHDUFLAG | Total packets | Discarded packets |
| A | 0 | 10 | 0 |
| B | 0 | 10 | 0 |
| C | 0 | 10 | 0 |
| D | 0 | 10 | 0 |
| Mode M0 | |||
|---|---|---|---|
| Quadrant | BADHDUFLAG | Total packets | Discarded packets |
| A | 0 | 1941 | 2 |
| B | 0 | 2360 | 1 |
| C | 0 | 2804 | 1 |
| D | 0 | 3324 | 1 |
| Mode SS | |||
|---|---|---|---|
| Quadrant | BADHDUFLAG | Total packets | Discarded packets |
| A | 0 | 18 | 0 |
| B | 0 | 18 | 0 |
| C | 0 | 18 | 0 |
| D | 0 | 18 | 0 |
| Quadrant | Total seconds | Saturated seconds | Saturation percentage |
|---|---|---|---|
| A | 948 | 1 | 0.105485% |
| B | 948 | 35 | 3.691983% |
| C | 948 | 56 | 5.907173% |
| D | 948 | 118 | 12.447257% |
Noise dominated data is calculated using 1-second bins in cleaned event files. If a bin has >2000 counts, and if more than 50% of those come from <1% of pixels, then it is considered to be noise-dominated and hence unusable.
| Quadrant | # 1 sec bins | Bins with >0 counts | Bins with >2000 counts | High rate bins dominated by noise | Noise dominated (total time) | Noise dominated (detector-on time) | Marked lightcurve |
|---|---|---|---|---|---|---|---|
| A | 948 | 948 | 0 | 0 | 0.00% | 0.00% | 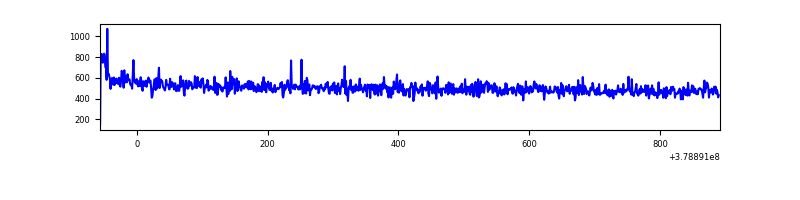 |
| B | 948 | 948 | 24 | 24 | 2.53% | 2.53% | 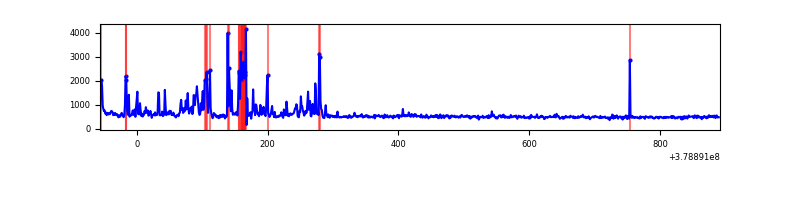 |
| C | 948 | 948 | 46 | 46 | 4.85% | 4.85% | 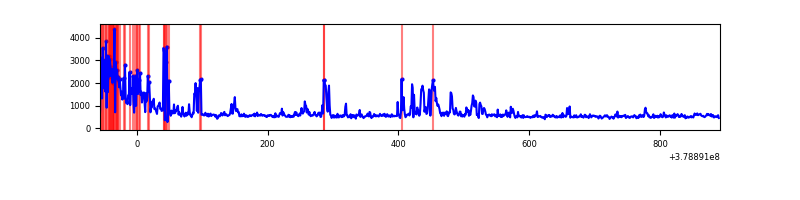 |
| D | 948 | 948 | 110 | 110 | 11.60% | 11.60% | 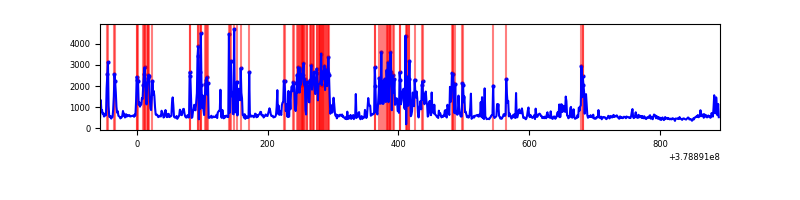 |
Top three noisy pixels from each quadrant. If the there are fewer than three noisy pixels in the level2.evt file, extra rows are filled as -1
| Pixel properties | Quadrant properties | ||||||
|---|---|---|---|---|---|---|---|
| Quadrant | DetID | PixID | Counts | Sigma | Mean | Median | Sigma |
| A | 10 | 83 | 5299 | 201.19 | 121 | 119 | 25.7 |
| A | 13 | 6 | 2696 | 100.09 | 121 | 119 | 25.7 |
| A | 13 | 254 | 1596 | 57.37 | 121 | 119 | 25.7 |
| B | 5 | 172 | 84166 | 3481.55 | 118 | 116 | 24.1 |
| B | 5 | 255 | 35892 | 1481.93 | 118 | 116 | 24.1 |
| B | 0 | 182 | 3144 | 125.43 | 118 | 116 | 24.1 |
| C | 0 | 10 | 143364 | 5328.37 | 111 | 111 | 26.9 |
| C | 3 | 233 | 82500 | 3064.49 | 111 | 111 | 26.9 |
| C | 15 | 214 | 44425 | 1648.27 | 111 | 111 | 26.9 |
| D | 2 | 250 | 315658 | 11274.19 | 108 | 105 | 28.0 |
| D | 2 | 249 | 138473 | 4943.66 | 108 | 105 | 28.0 |
| D | 8 | 195 | 14163 | 502.27 | 108 | 105 | 28.0 |
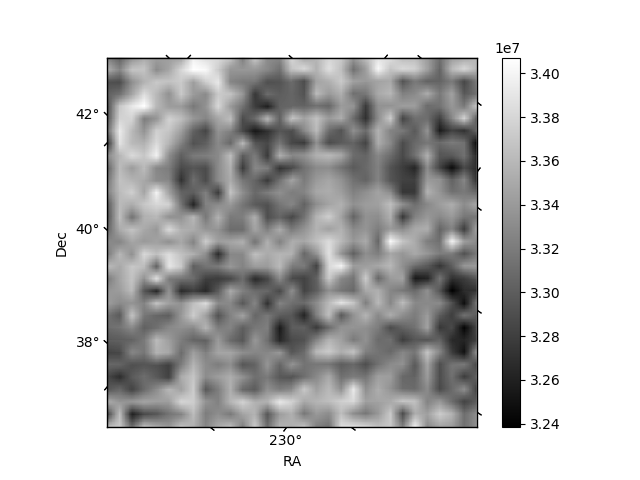
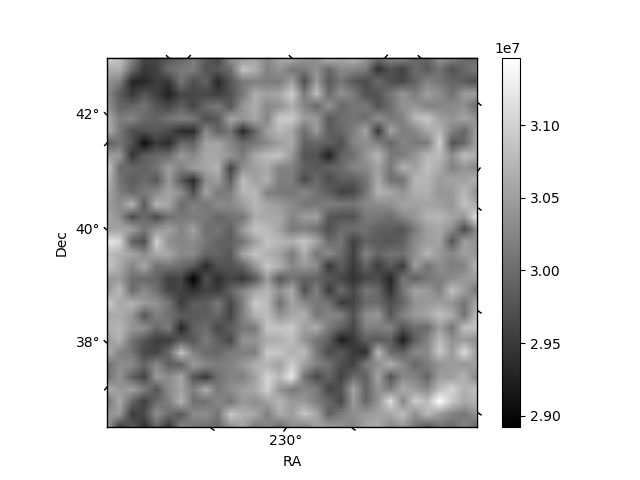
Histogram calculated using DETX and DETY for each event in the final _common_clean file
| Quadrant A | 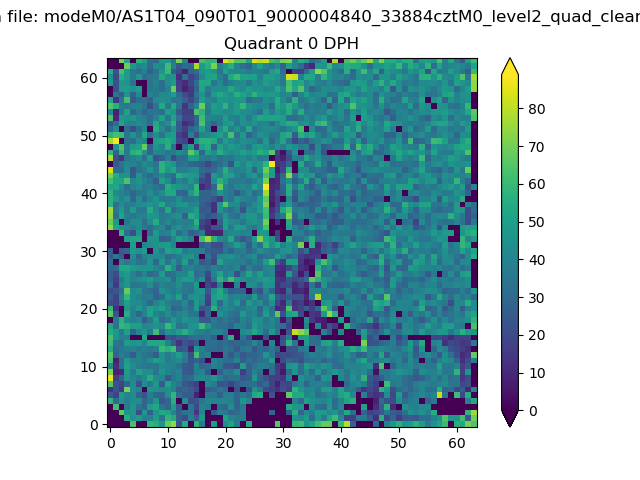 |
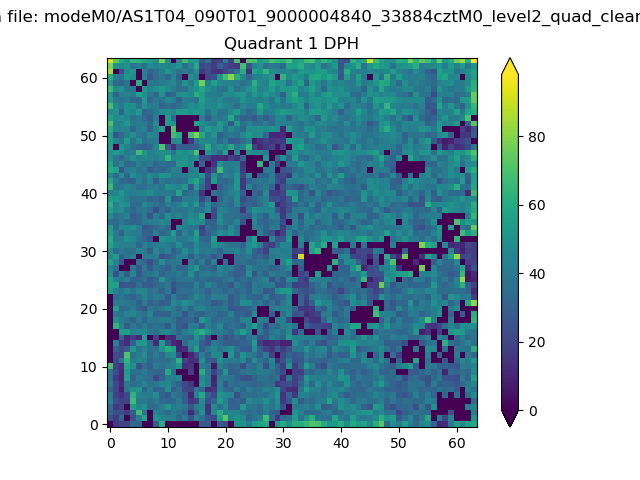 |
Quadrant B |
|---|---|---|---|
| Quadrant D |  |
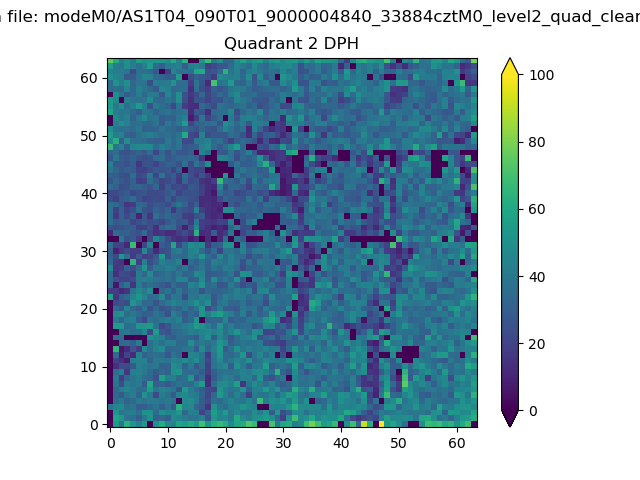 |
Quadrant C |
| Plot type | Count rate plots | Images |
|---|---|---|
| Comparison with Poisson distribution Blue bars denote a histogram of data divided into 1 sec bins. Red curve is a Poisson curve with rate = median count rate of data. |
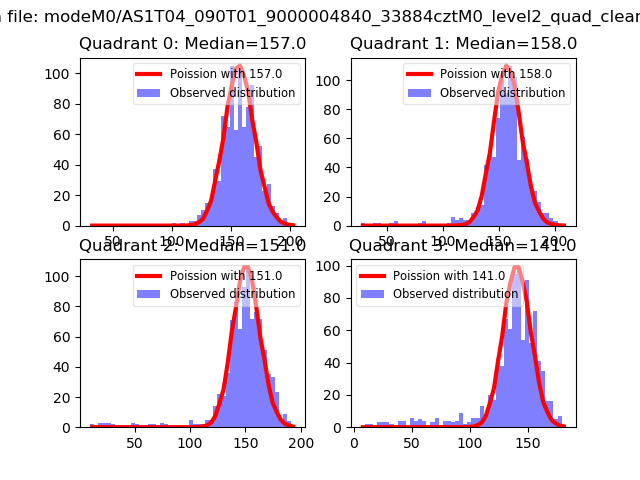 |
 |
| Quadrant-wise count rates Data is divided into 100 sec bins |
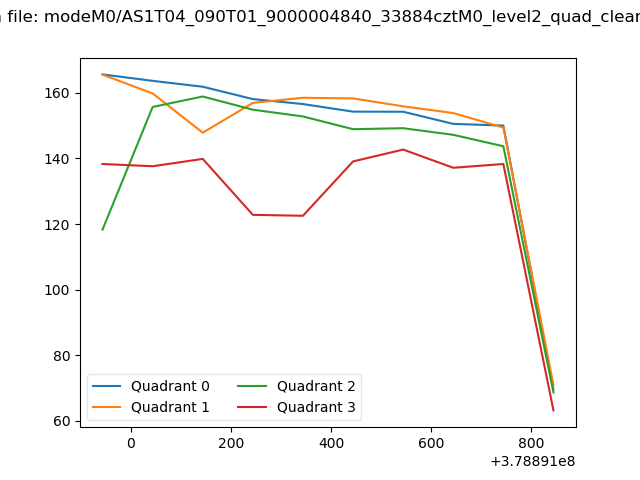 |
|
| Module-wise count rates for Quadrant A Data is divided into 100 sec bins |
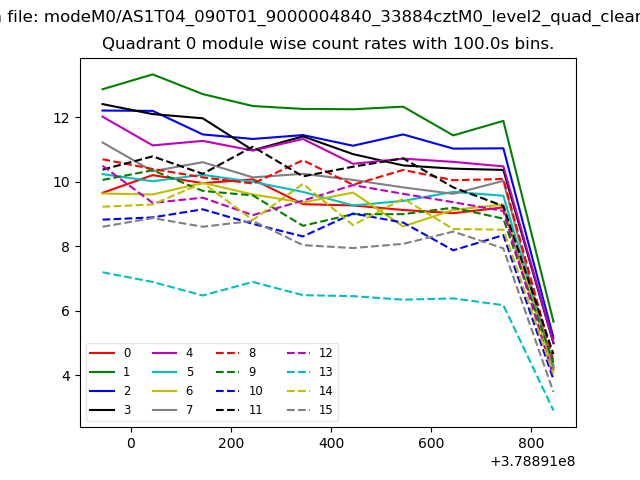 |
 |
| Module-wise count rates for Quadrant B Data is divided into 100 sec bins |
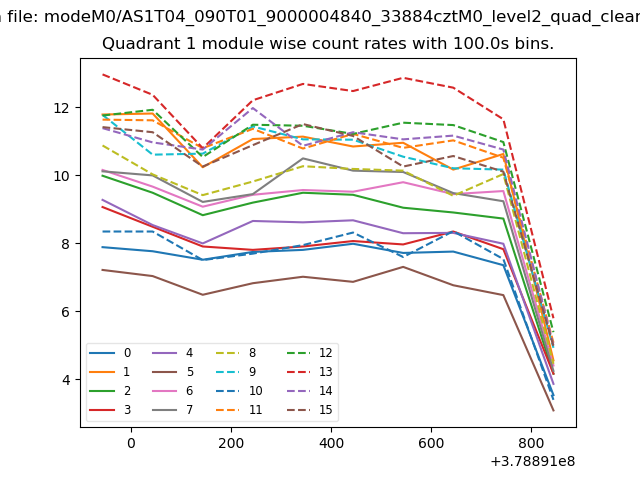 |
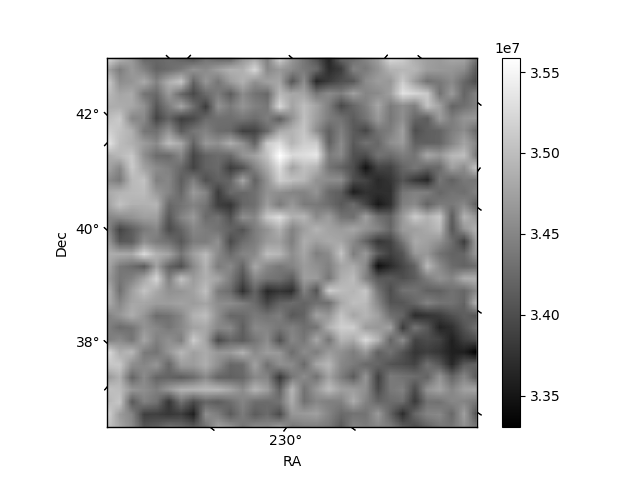 |
| Module-wise count rates for Quadrant C Data is divided into 100 sec bins |
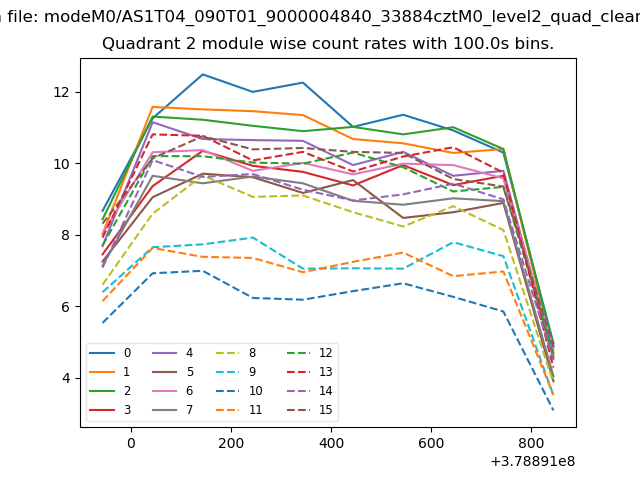 |
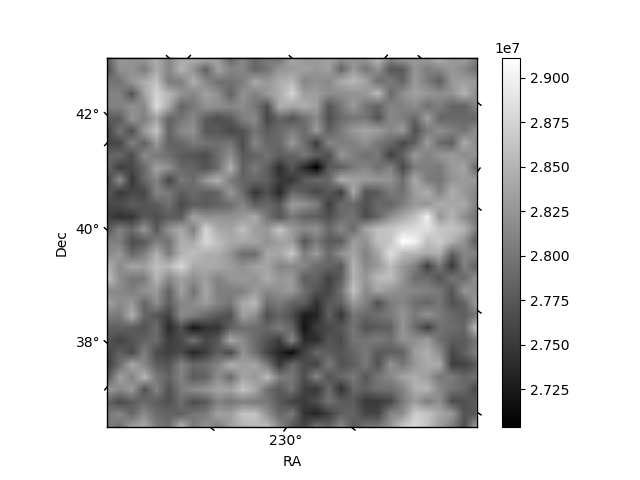 |
| Module-wise count rates for Quadrant D Data is divided into 100 sec bins |
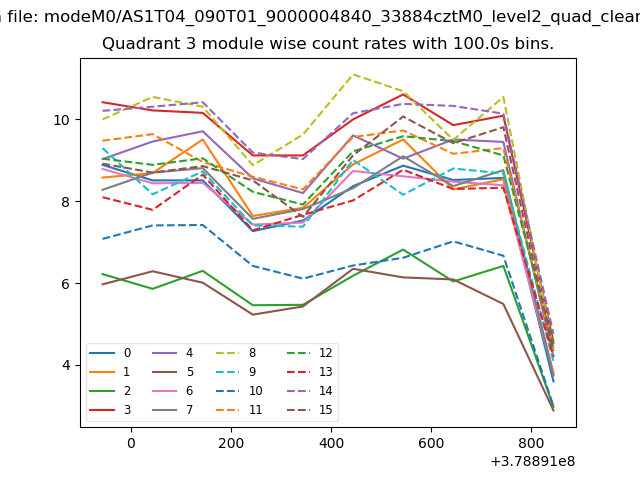 |
 |
| Parameter | Plot |
|---|---|
| CZT HV Monitor | 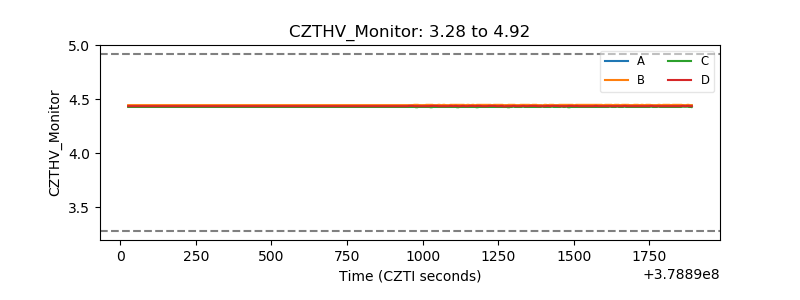 |
| D_VDD | 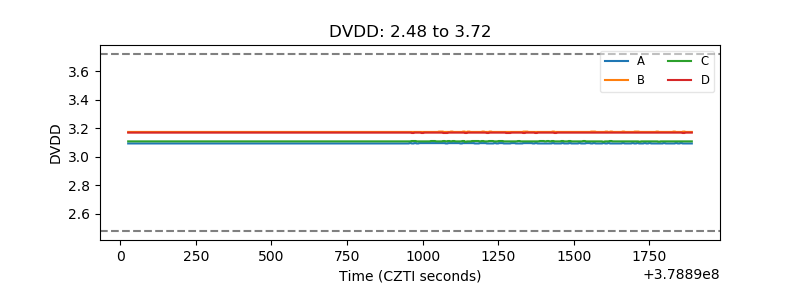 |
| Temperature 1 | 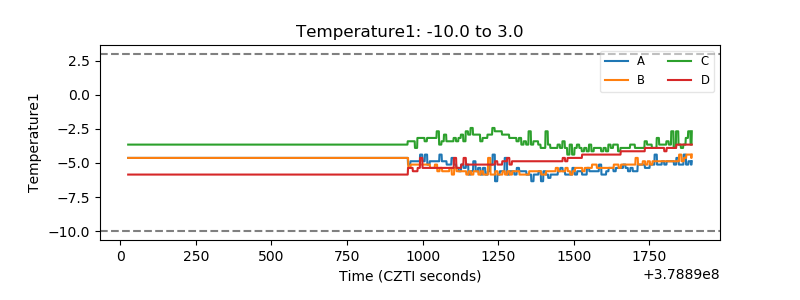 |
| Veto HV Monitor | 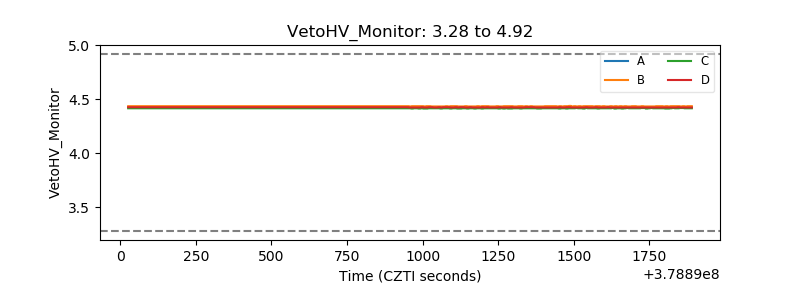 |
| Veto LLD | 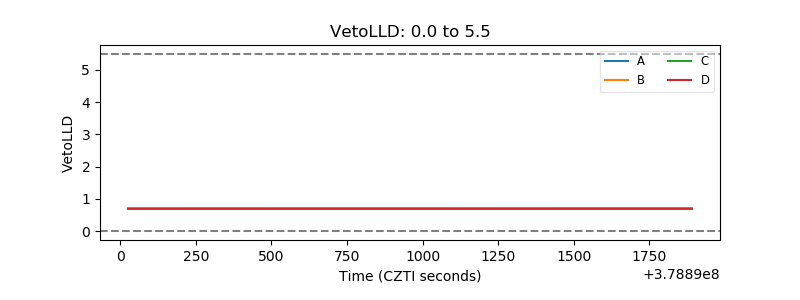 |
| Alpha Counter | 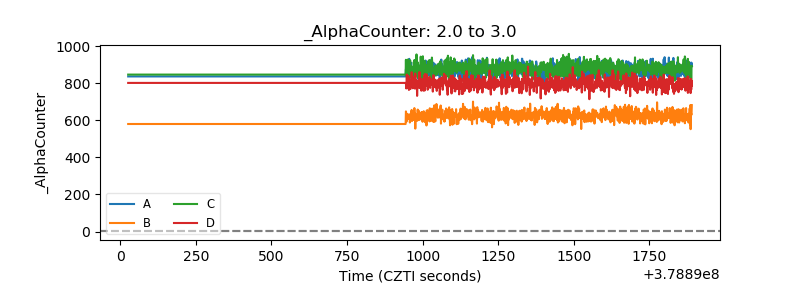 |
| _CPM_Rate | 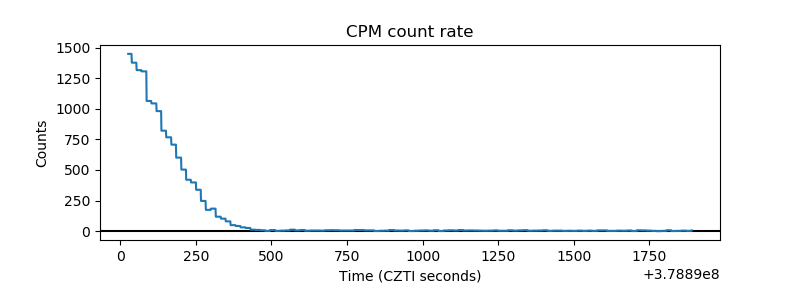 |
| CZT Counter | 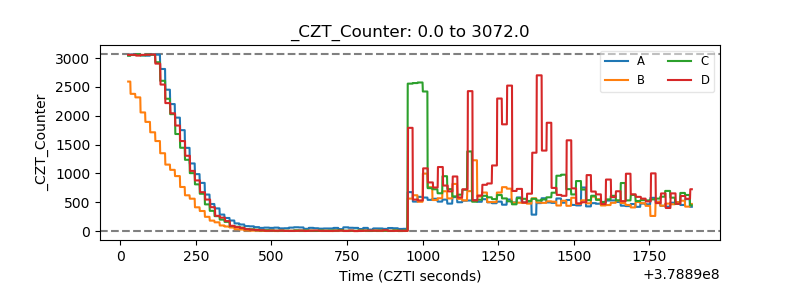 |
| +2.5 Volts monitor |  |
| +5 Volts monitor |  |
| _ROLL_ROT | 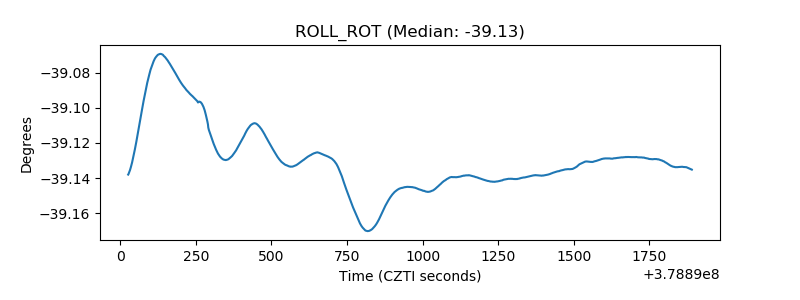 |
| _Roll_DEC | 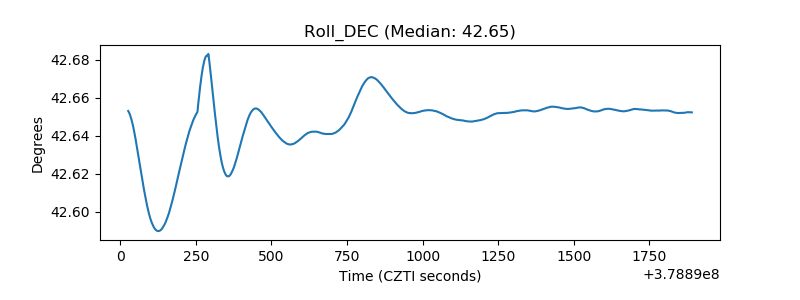 |
| _Roll_RA | 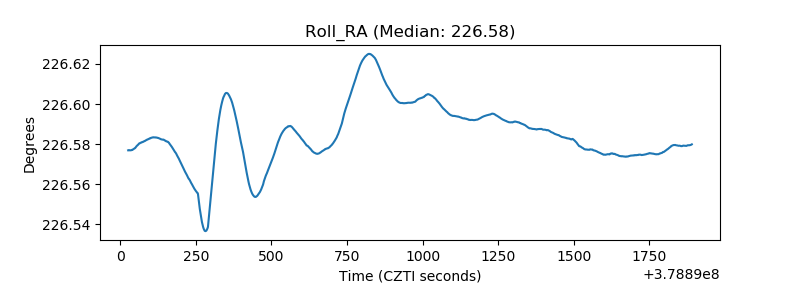 |
| Veto Counter | 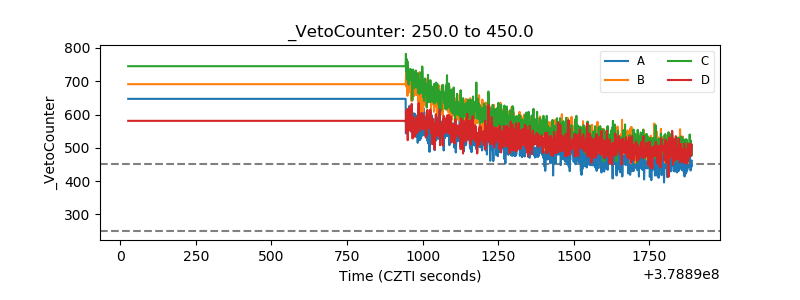 |