| Param | Original file | Final file |
|---|---|---|
| Filename | modeM0/AS1T04_090T01_9000004840_33886cztM0_level2.evt | modeM0/AS1T04_090T01_9000004840_33886cztM0_level2_quad_clean.evt |
| Size (bytes) | 489,404,160 | 71,167,680 |
| Size | 466.7 MB | 67.9 MB |
| Events in quadrant A | 2,553,474 | 482,230 |
| Events in quadrant B | 3,046,681 | 480,711 |
| Events in quadrant C | 3,159,736 | 463,937 |
| Events in quadrant D | 5,718,641 | 373,260 |
| Mode M9 | |||
|---|---|---|---|
| Quadrant | BADHDUFLAG | Total packets | Discarded packets |
| A | 0 | 25 | 0 |
| B | 0 | 25 | 0 |
| C | 0 | 25 | 0 |
| D | 0 | 26 | 0 |
| Mode M0 | |||
|---|---|---|---|
| Quadrant | BADHDUFLAG | Total packets | Discarded packets |
| A | 0 | 10350 | 3 |
| B | 0 | 11924 | 2 |
| C | 0 | 12186 | 2 |
| D | 0 | 20572 | 2 |
| Mode SS | |||
|---|---|---|---|
| Quadrant | BADHDUFLAG | Total packets | Discarded packets |
| A | 0 | 104 | 0 |
| B | 0 | 104 | 0 |
| C | 0 | 104 | 0 |
| D | 0 | 104 | 0 |
| Quadrant | Total seconds | Saturated seconds | Saturation percentage |
|---|---|---|---|
| A | 5054 | 4 | 0.079145% |
| B | 5054 | 96 | 1.899486% |
| C | 5054 | 102 | 2.018203% |
| D | 5054 | 1150 | 22.754254% |
Noise dominated data is calculated using 1-second bins in cleaned event files. If a bin has >2000 counts, and if more than 50% of those come from <1% of pixels, then it is considered to be noise-dominated and hence unusable.
| Quadrant | # 1 sec bins | Bins with >0 counts | Bins with >2000 counts | High rate bins dominated by noise | Noise dominated (total time) | Noise dominated (detector-on time) | Marked lightcurve |
|---|---|---|---|---|---|---|---|
| A | 7117 | 5055 | 0 | 0 | 0.00% | 0.00% | 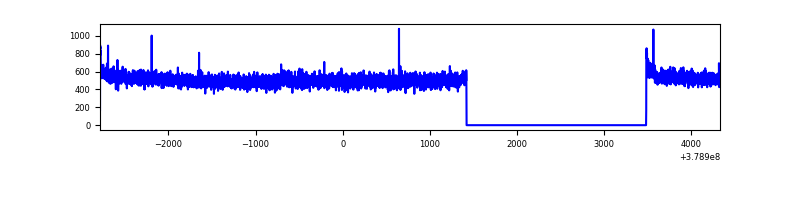 |
| B | 7117 | 5055 | 54 | 54 | 0.76% | 1.07% | 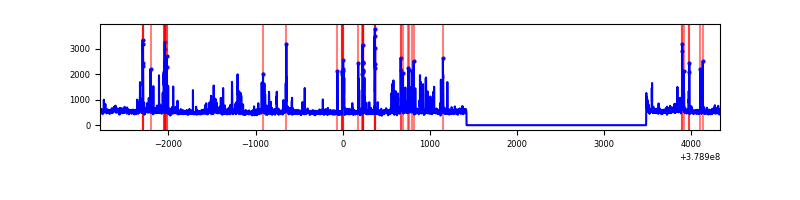 |
| C | 7117 | 5055 | 85 | 85 | 1.19% | 1.68% | 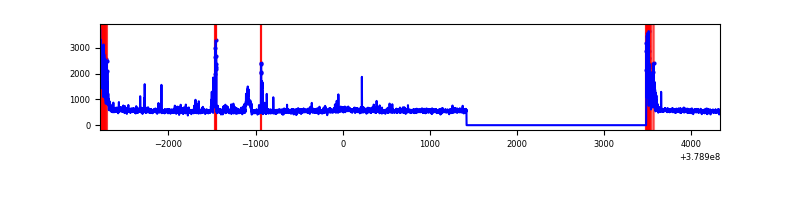 |
| D | 7117 | 5055 | 883 | 883 | 12.41% | 17.47% | 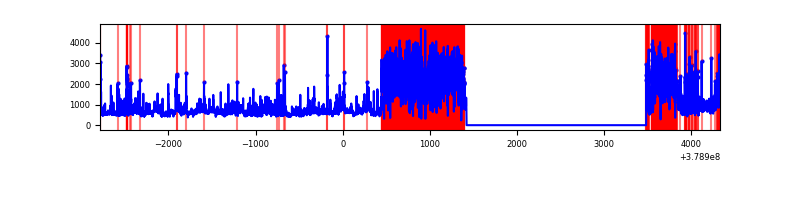 |
Top three noisy pixels from each quadrant. If the there are fewer than three noisy pixels in the level2.evt file, extra rows are filled as -1
| Pixel properties | Quadrant properties | ||||||
|---|---|---|---|---|---|---|---|
| Quadrant | DetID | PixID | Counts | Sigma | Mean | Median | Sigma |
| A | 13 | 6 | 16598 | 123.82 | 653 | 642 | 128.9 |
| A | 10 | 83 | 11422 | 83.65 | 653 | 642 | 128.9 |
| A | 13 | 254 | 8356 | 59.86 | 653 | 642 | 128.9 |
| B | 5 | 172 | 287878 | 2408.35 | 637 | 622 | 119.3 |
| B | 5 | 255 | 141009 | 1177.0 | 637 | 622 | 119.3 |
| B | 4 | 232 | 23444 | 191.34 | 637 | 622 | 119.3 |
| C | 0 | 10 | 277948 | 1965.81 | 624 | 630 | 141.1 |
| C | 15 | 214 | 222263 | 1571.08 | 624 | 630 | 141.1 |
| C | 3 | 233 | 203495 | 1438.04 | 624 | 630 | 141.1 |
| D | 12 | 235 | 2526768 | 18576.0 | 560 | 545 | 136.0 |
| D | 8 | 195 | 506315 | 3719.06 | 560 | 545 | 136.0 |
| D | 2 | 249 | 164440 | 1205.16 | 560 | 545 | 136.0 |
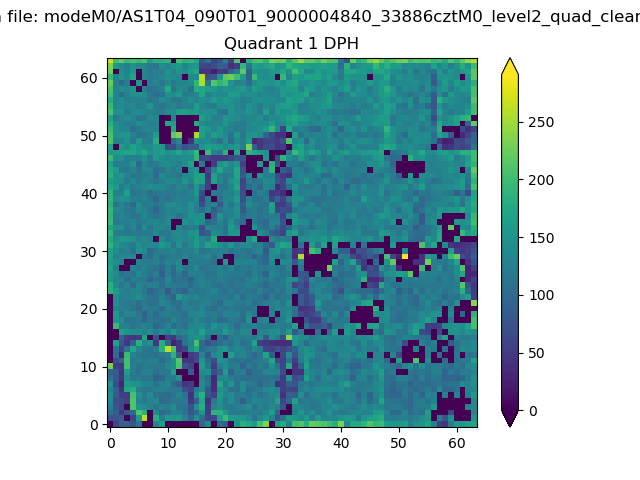
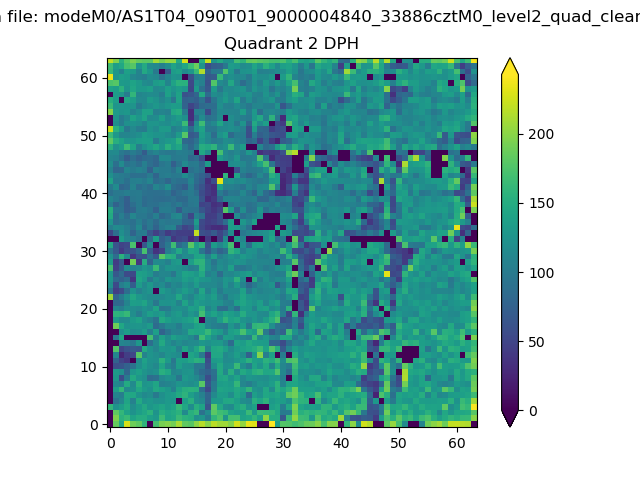
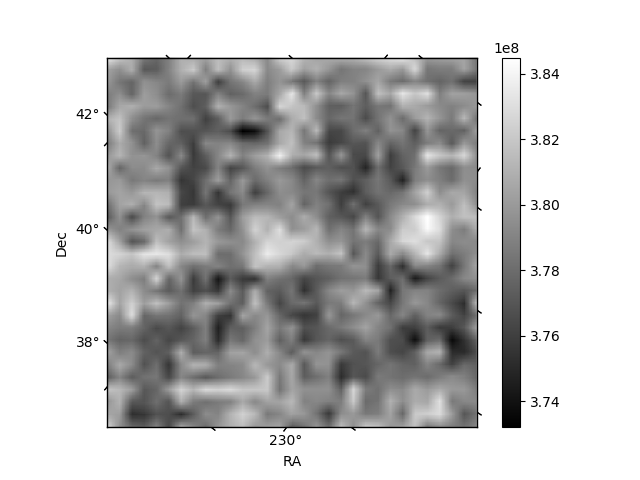
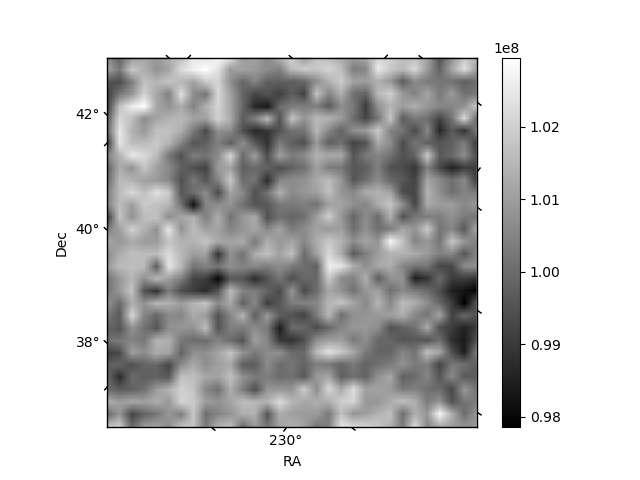
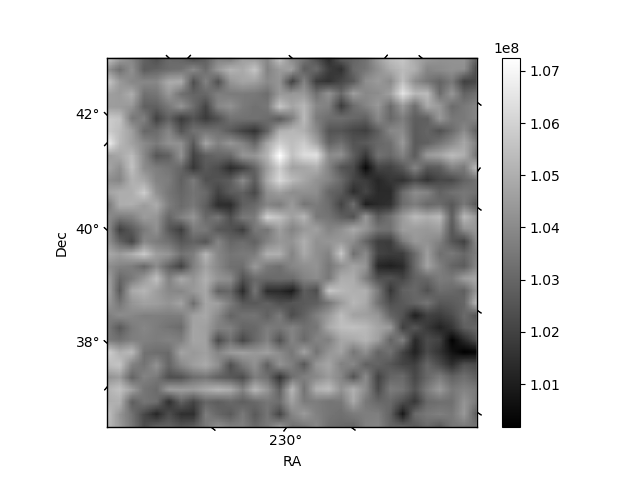
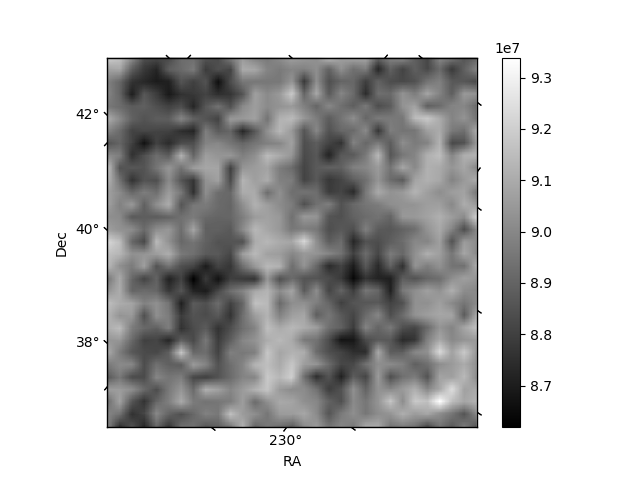
Histogram calculated using DETX and DETY for each event in the final _common_clean file
| Quadrant A |  |
 |
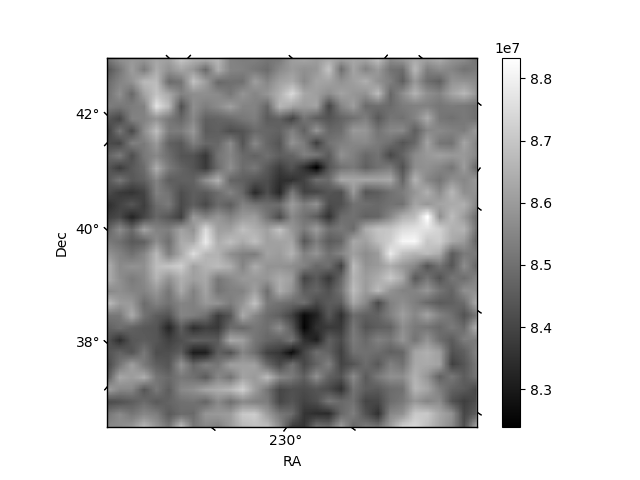
Quadrant B |
|---|---|---|---|
| Quadrant D | 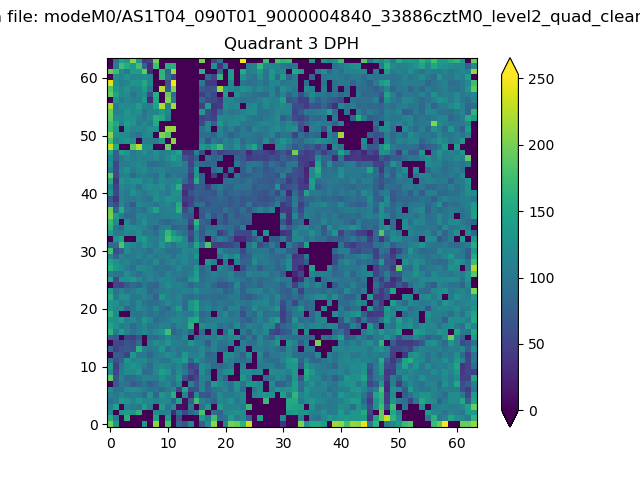 |
 |
Quadrant C |
| Plot type | Count rate plots | Images |
|---|---|---|
| Comparison with Poisson distribution Blue bars denote a histogram of data divided into 1 sec bins. Red curve is a Poisson curve with rate = median count rate of data. |
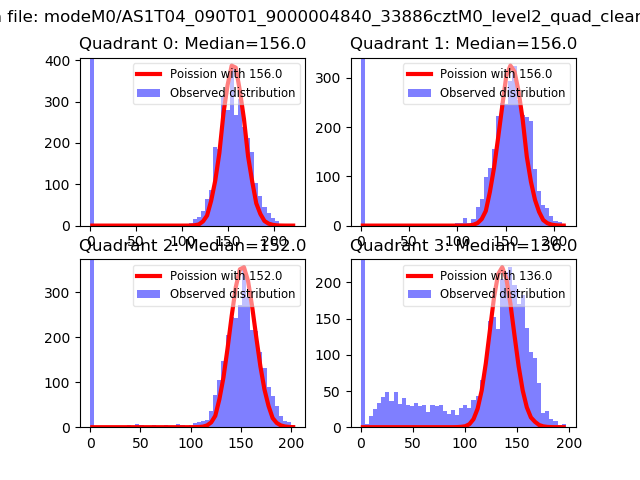 |
 |
| Quadrant-wise count rates Data is divided into 100 sec bins |
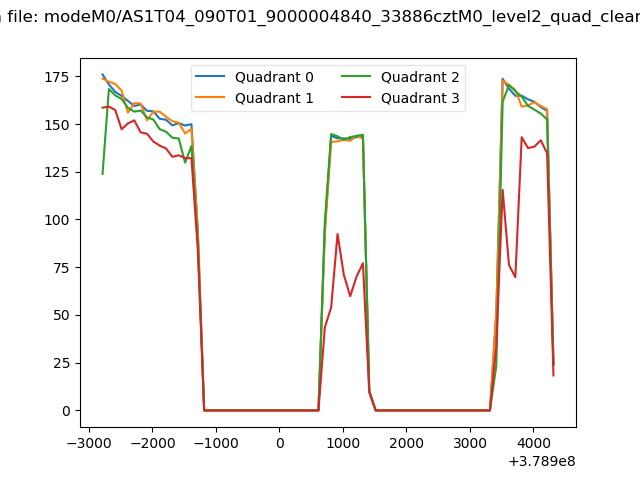 |
|
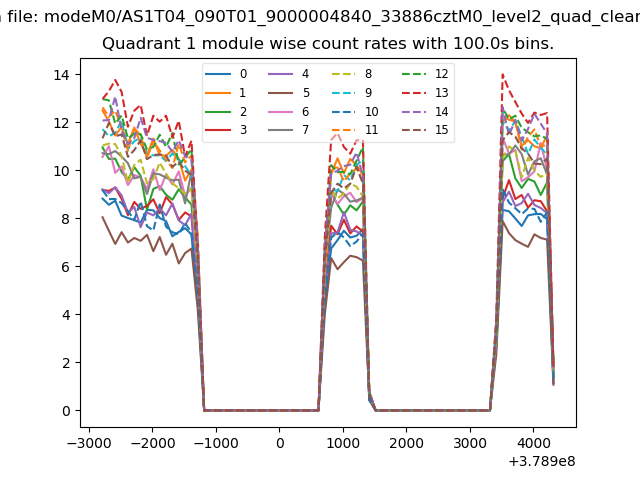
| Module-wise count rates for Quadrant A Data is divided into 100 sec bins |
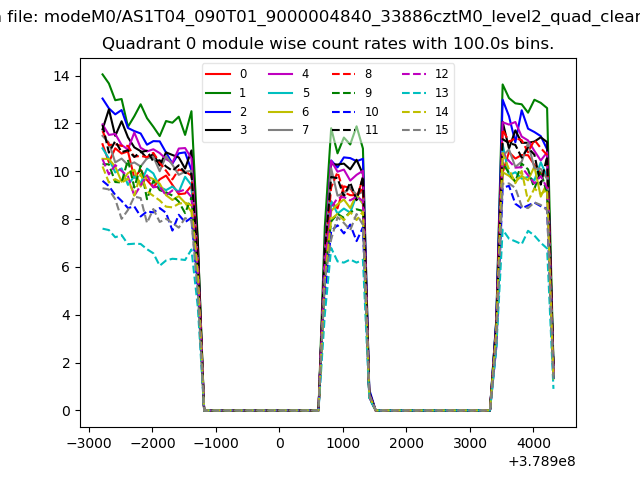 |
 |
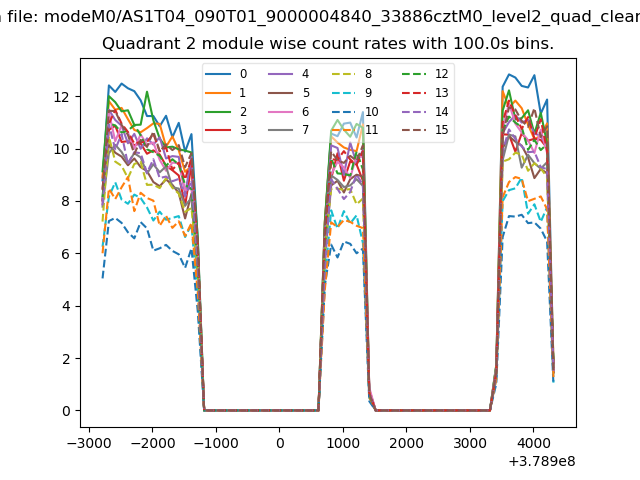
| Module-wise count rates for Quadrant B Data is divided into 100 sec bins |
 |
 |
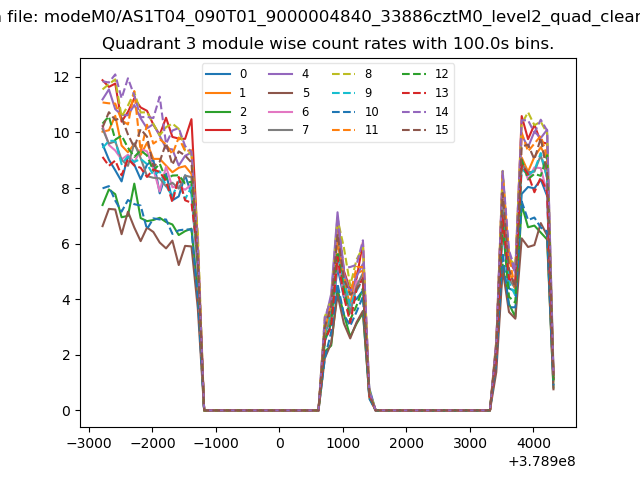
| Module-wise count rates for Quadrant C Data is divided into 100 sec bins |
 |
 |
| Module-wise count rates for Quadrant D Data is divided into 100 sec bins |
 |
 |
| Parameter | Plot |
|---|---|
| CZT HV Monitor | 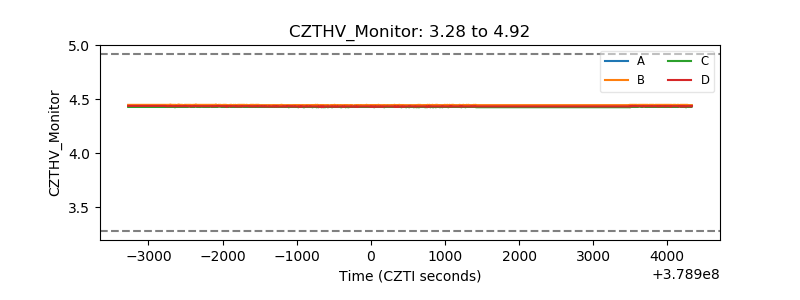 |
| D_VDD | 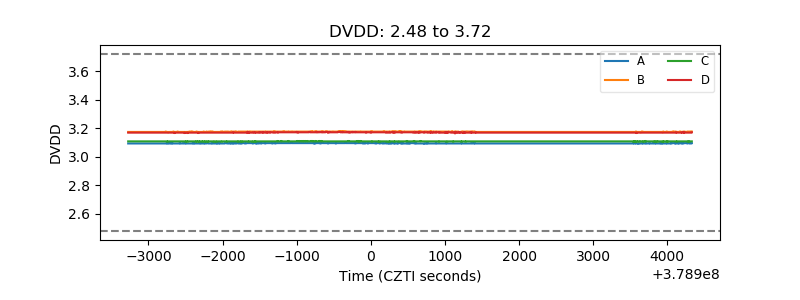 |
| Temperature 1 | 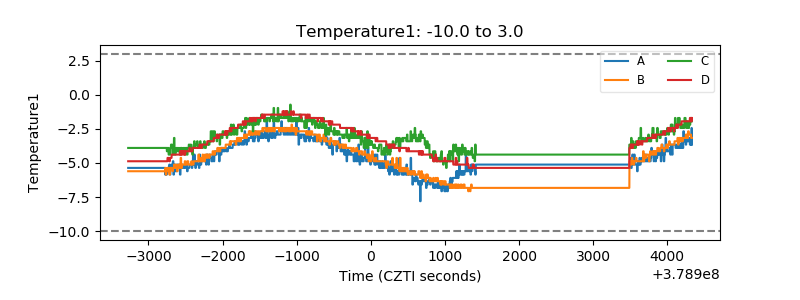 |
| Veto HV Monitor | 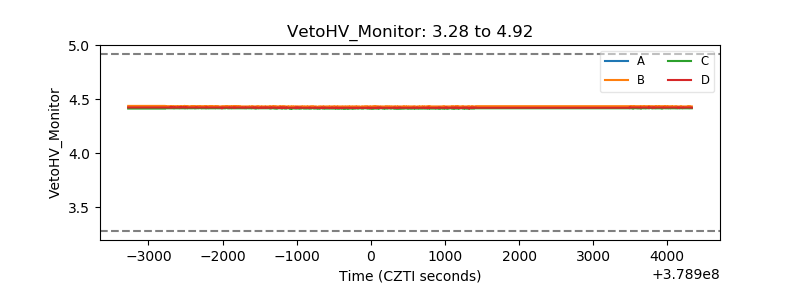 |
| Veto LLD | 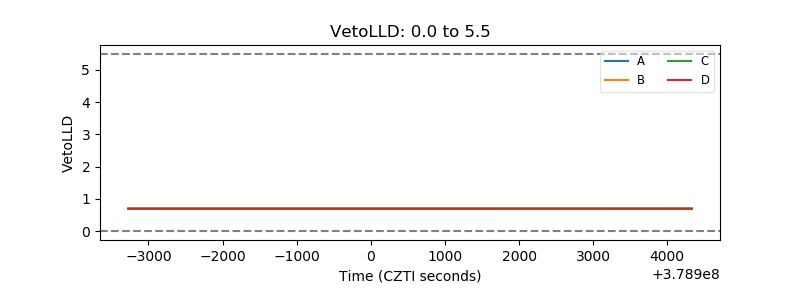 |
| Alpha Counter | 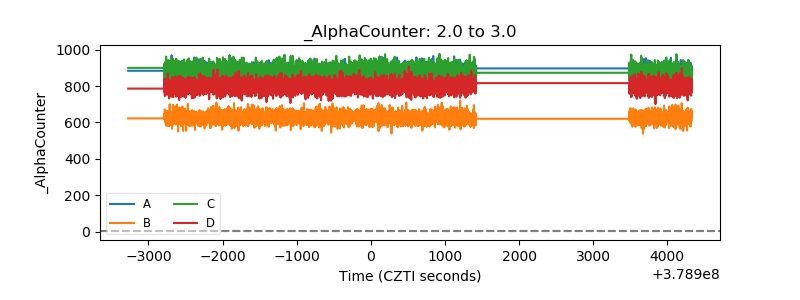 |
| _CPM_Rate | 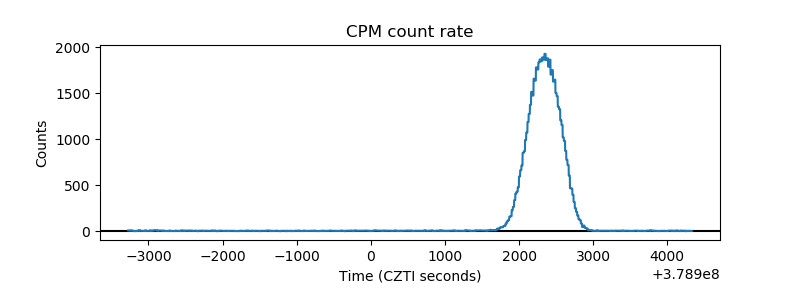 |
| CZT Counter | 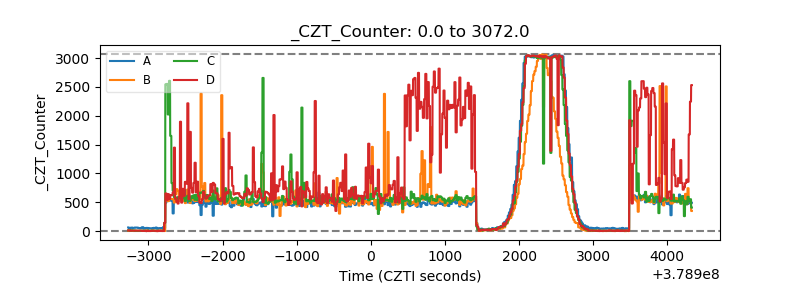 |
| +2.5 Volts monitor |  |
| +5 Volts monitor |  |
| _ROLL_ROT | 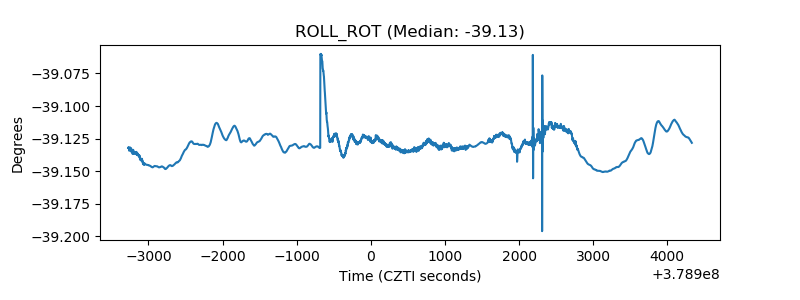 |
| _Roll_DEC | 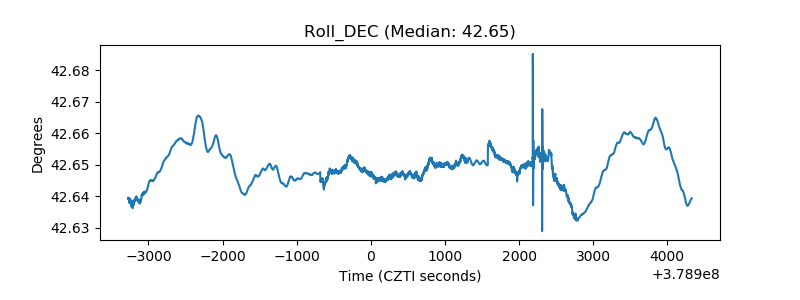 |
| _Roll_RA | 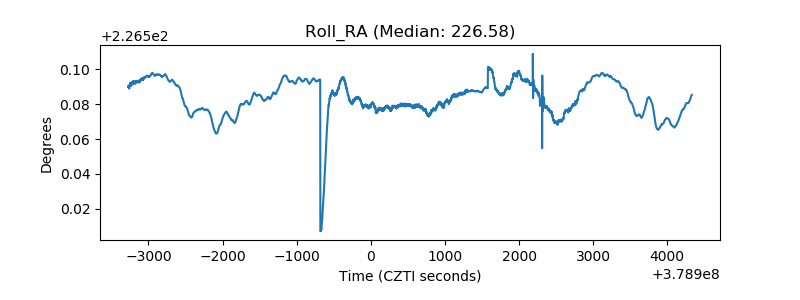 |
| Veto Counter | 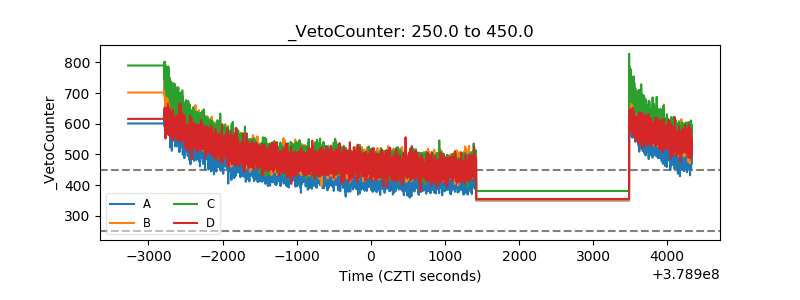 |