| Param | Original file | Final file |
|---|---|---|
| Filename | modeM0/AS1T04_090T01_9000004840_33887cztM0_level2.evt | modeM0/AS1T04_090T01_9000004840_33887cztM0_level2_quad_clean.evt |
| Size (bytes) | 500,400,000 | 66,911,040 |
| Size | 477.2 MB | 63.8 MB |
| Events in quadrant A | 2,508,879 | 443,048 |
| Events in quadrant B | 3,543,138 | 435,524 |
| Events in quadrant C | 3,021,013 | 429,555 |
| Events in quadrant D | 5,746,514 | 370,727 |
| Mode M9 | |||
|---|---|---|---|
| Quadrant | BADHDUFLAG | Total packets | Discarded packets |
| A | 0 | 27 | 0 |
| B | 0 | 27 | 0 |
| C | 0 | 27 | 0 |
| D | 0 | 28 | 0 |
| Mode M0 | |||
|---|---|---|---|
| Quadrant | BADHDUFLAG | Total packets | Discarded packets |
| A | 0 | 10197 | 3 |
| B | 0 | 13453 | 2 |
| C | 0 | 11709 | 2 |
| D | 0 | 20514 | 2 |
| Mode SS | |||
|---|---|---|---|
| Quadrant | BADHDUFLAG | Total packets | Discarded packets |
| A | 0 | 102 | 0 |
| B | 0 | 102 | 0 |
| C | 0 | 102 | 0 |
| D | 0 | 102 | 0 |
| Quadrant | Total seconds | Saturated seconds | Saturation percentage |
|---|---|---|---|
| A | 4943 | 7 | 0.141614% |
| B | 4943 | 293 | 5.927574% |
| C | 4943 | 86 | 1.739834% |
| D | 4943 | 815 | 16.487963% |
Noise dominated data is calculated using 1-second bins in cleaned event files. If a bin has >2000 counts, and if more than 50% of those come from <1% of pixels, then it is considered to be noise-dominated and hence unusable.
| Quadrant | # 1 sec bins | Bins with >0 counts | Bins with >2000 counts | High rate bins dominated by noise | Noise dominated (total time) | Noise dominated (detector-on time) | Marked lightcurve |
|---|---|---|---|---|---|---|---|
| A | 7066 | 4944 | 1 | 1 | 0.01% | 0.02% | 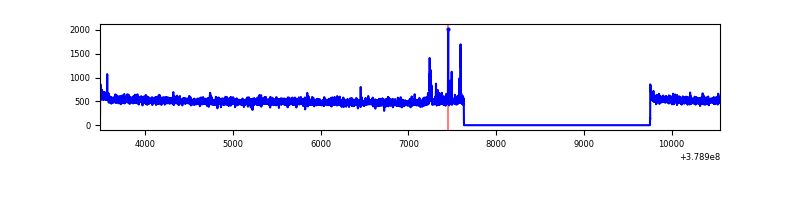 |
| B | 7066 | 4944 | 191 | 191 | 2.70% | 3.86% | 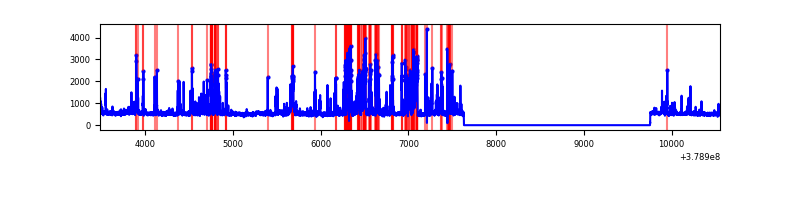 |
| C | 7066 | 4944 | 64 | 64 | 0.91% | 1.29% | 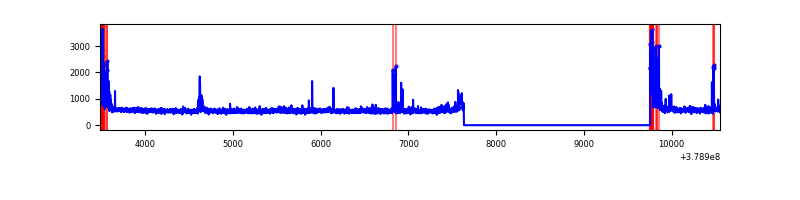 |
| D | 7066 | 4944 | 696 | 696 | 9.85% | 14.08% | 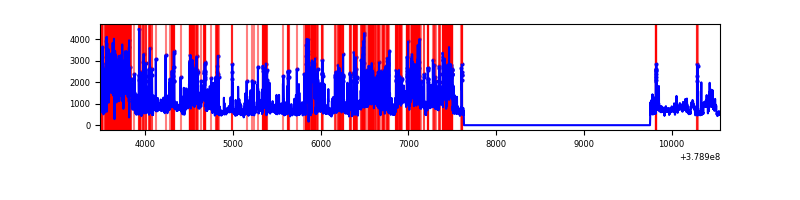 |
Top three noisy pixels from each quadrant. If the there are fewer than three noisy pixels in the level2.evt file, extra rows are filled as -1
| Pixel properties | Quadrant properties | ||||||
|---|---|---|---|---|---|---|---|
| Quadrant | DetID | PixID | Counts | Sigma | Mean | Median | Sigma |
| A | 7 | 16 | 31932 | 249.72 | 636 | 625 | 125.4 |
| A | 10 | 83 | 11150 | 83.95 | 636 | 625 | 125.4 |
| A | 13 | 6 | 8697 | 64.39 | 636 | 625 | 125.4 |
| B | 5 | 172 | 541730 | 4765.54 | 609 | 595 | 113.6 |
| B | 5 | 255 | 455217 | 4003.66 | 609 | 595 | 113.6 |
| B | 4 | 232 | 66360 | 579.16 | 609 | 595 | 113.6 |
| C | 0 | 10 | 263430 | 1892.34 | 611 | 616 | 138.9 |
| C | 15 | 214 | 215962 | 1550.56 | 611 | 616 | 138.9 |
| C | 3 | 233 | 117299 | 840.15 | 611 | 616 | 138.9 |
| D | 12 | 235 | 1965389 | 13798.1 | 581 | 566 | 142.4 |
| D | 8 | 195 | 741918 | 5206.19 | 581 | 566 | 142.4 |
| D | 2 | 250 | 320189 | 2244.57 | 581 | 566 | 142.4 |
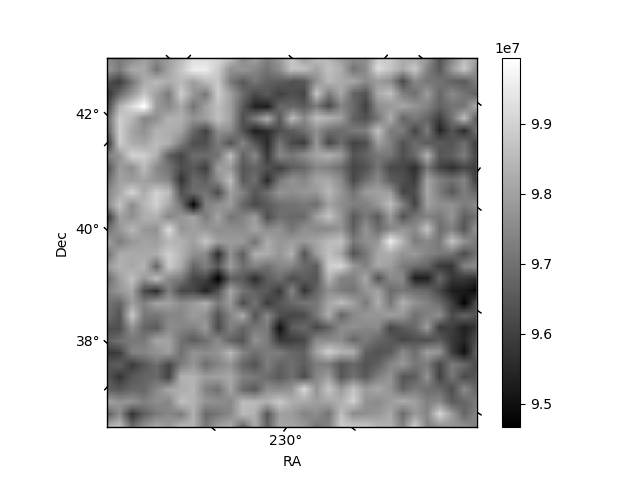
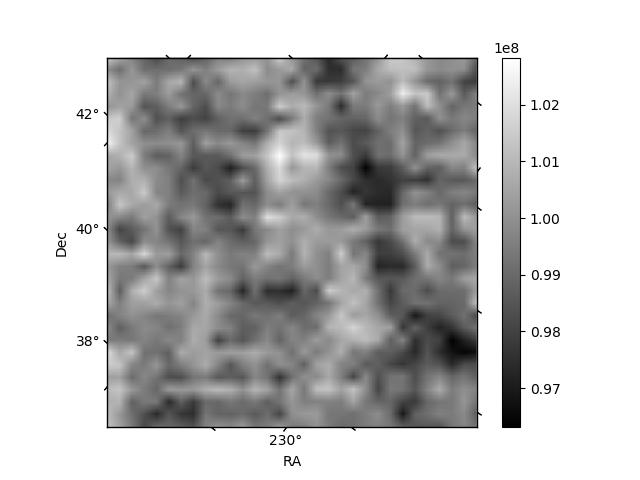
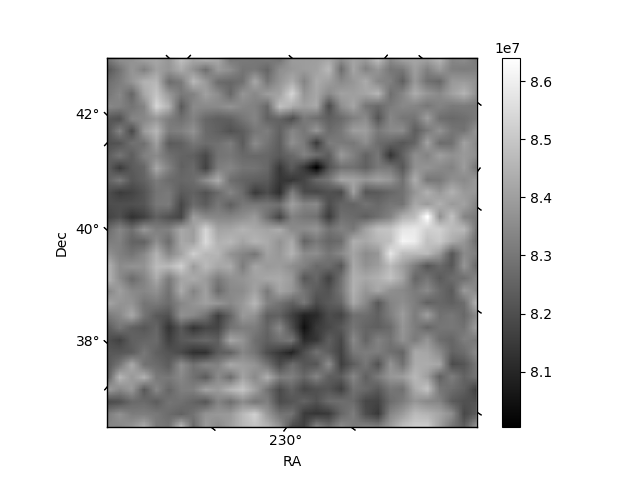
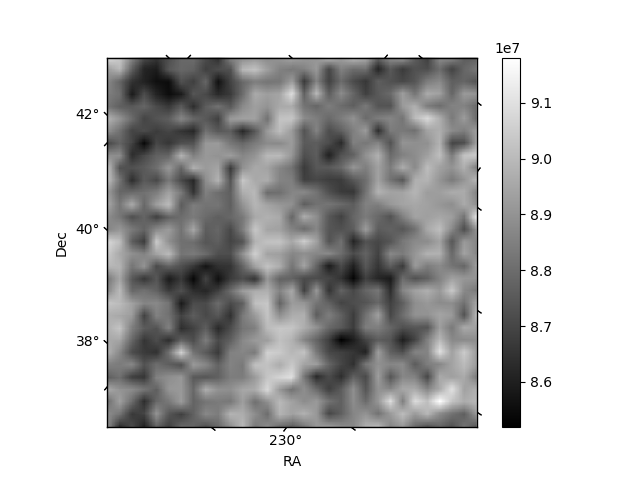
Histogram calculated using DETX and DETY for each event in the final _common_clean file
| Quadrant A | 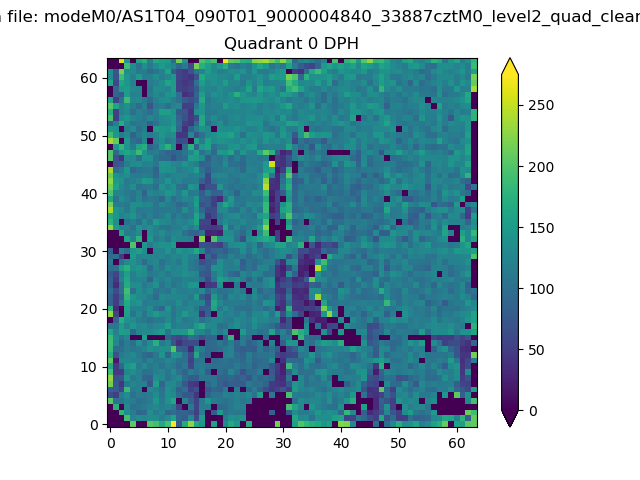 |
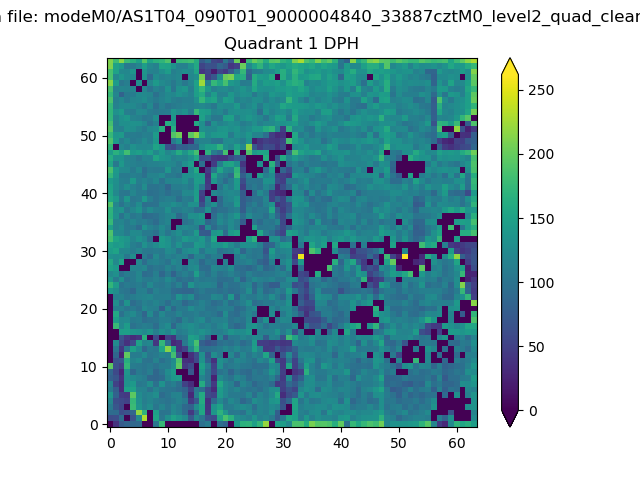 |
Quadrant B |
|---|---|---|---|
| Quadrant D | 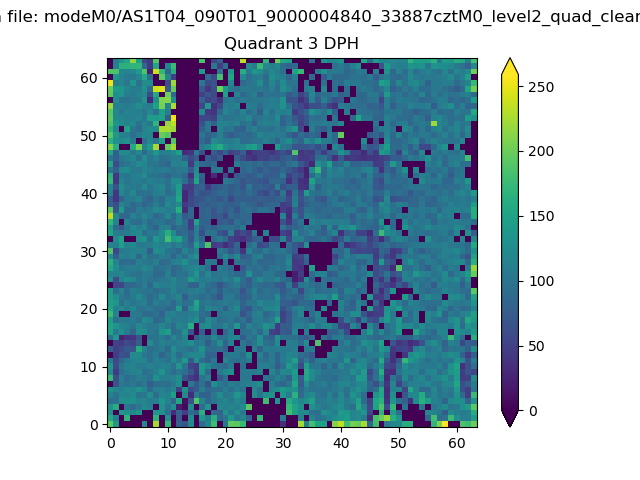 |
 |
Quadrant C |
| Plot type | Count rate plots | Images |
|---|---|---|
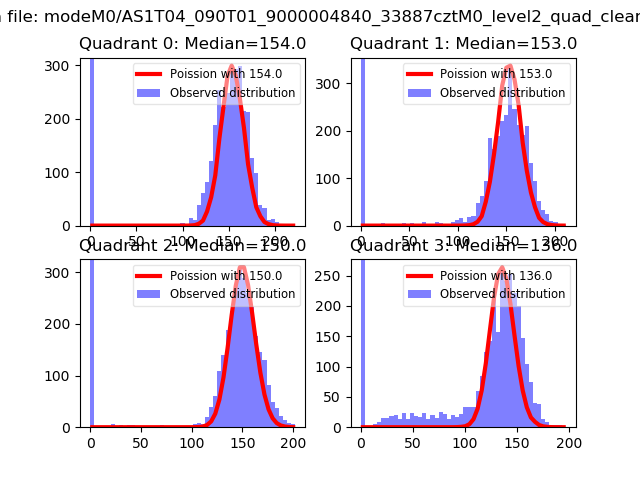
| Comparison with Poisson distribution Blue bars denote a histogram of data divided into 1 sec bins. Red curve is a Poisson curve with rate = median count rate of data. |
 |
 |
| Quadrant-wise count rates Data is divided into 100 sec bins |
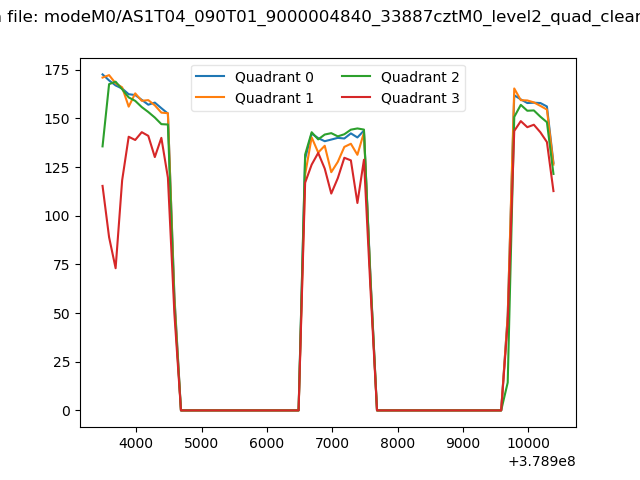 |
|
| Module-wise count rates for Quadrant A Data is divided into 100 sec bins |
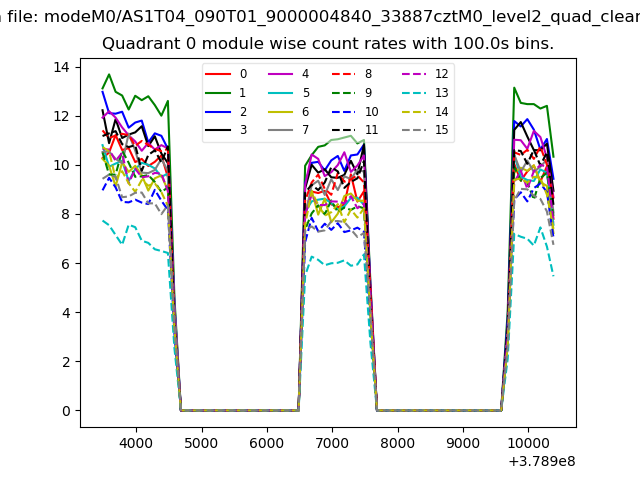 |
 |
| Module-wise count rates for Quadrant B Data is divided into 100 sec bins |
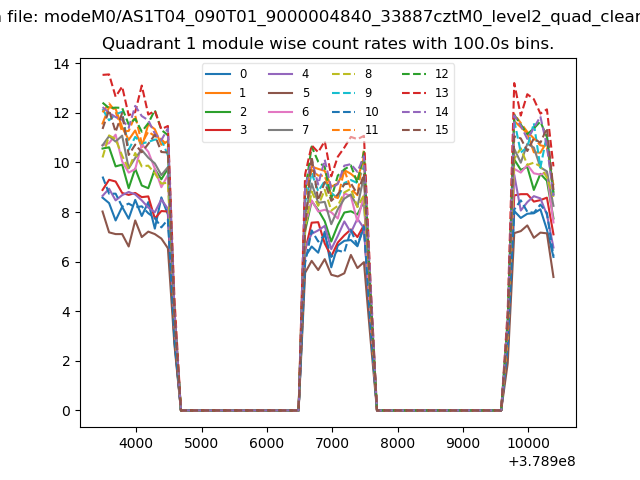 |
 |
| Module-wise count rates for Quadrant C Data is divided into 100 sec bins |
 |
 |
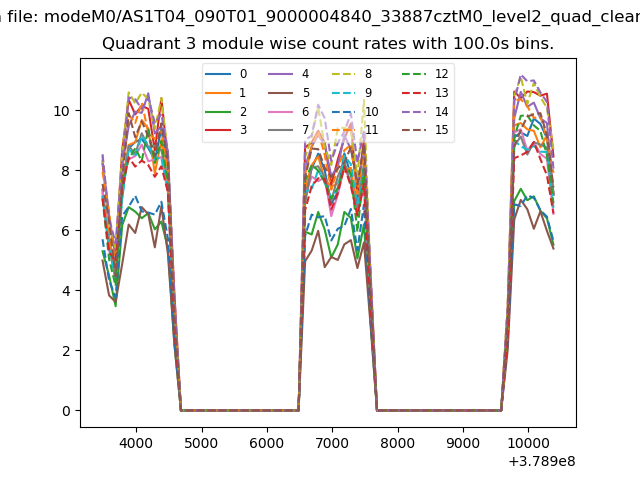
| Module-wise count rates for Quadrant D Data is divided into 100 sec bins |
 |
 |
| Parameter | Plot |
|---|---|
| CZT HV Monitor | 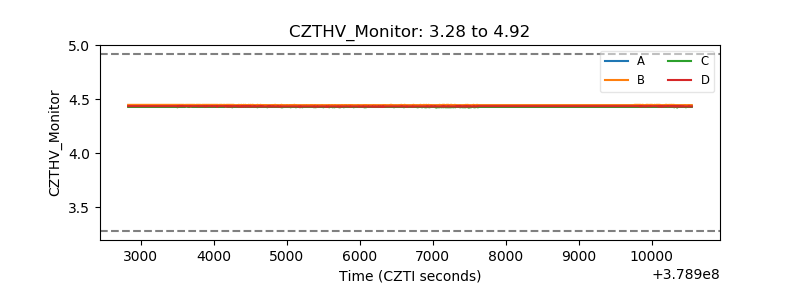 |
| D_VDD | 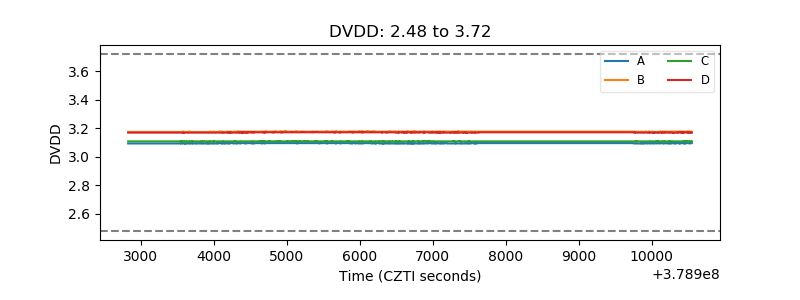 |
| Temperature 1 | 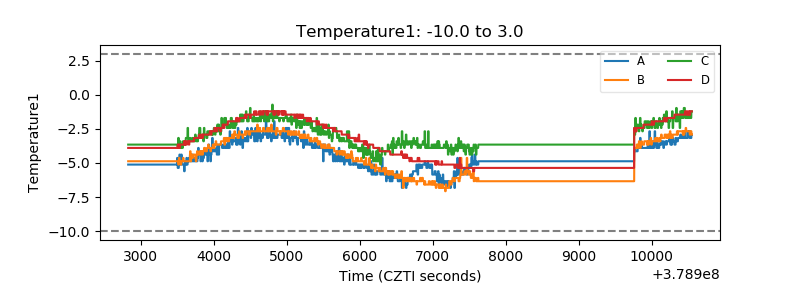 |
| Veto HV Monitor | 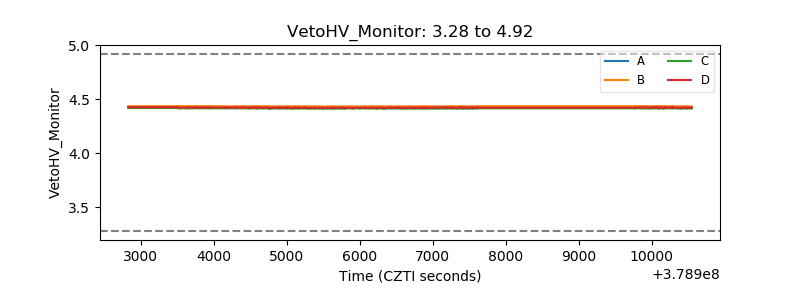 |
| Veto LLD | 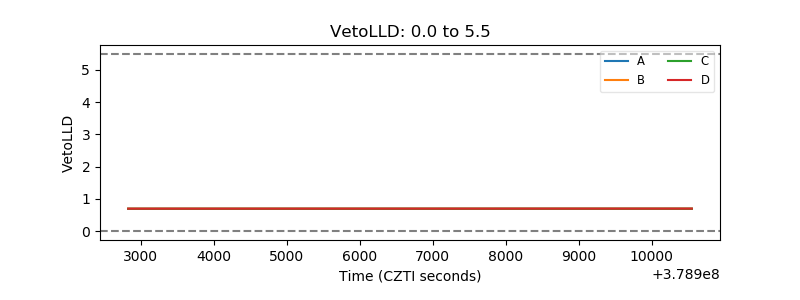 |
| Alpha Counter |  |
| _CPM_Rate | 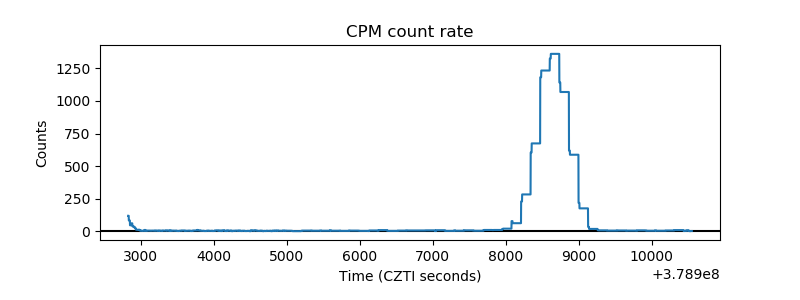 |
| CZT Counter |  |
| +2.5 Volts monitor |  |
| +5 Volts monitor |  |
| _ROLL_ROT | 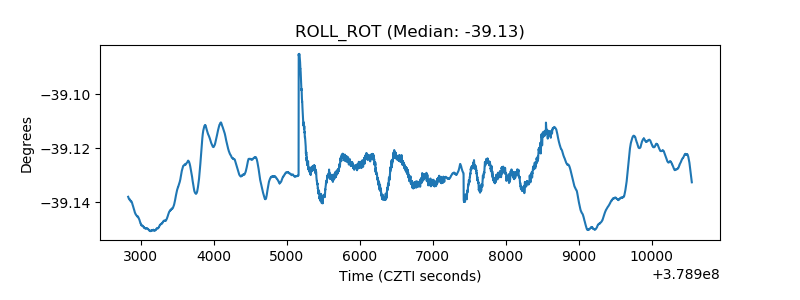 |
| _Roll_DEC | 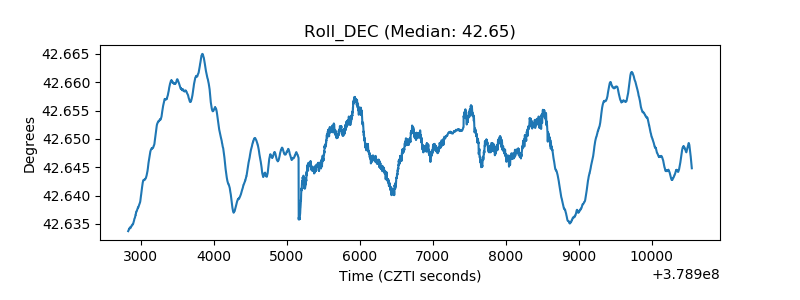 |
| _Roll_RA |  |
| Veto Counter | 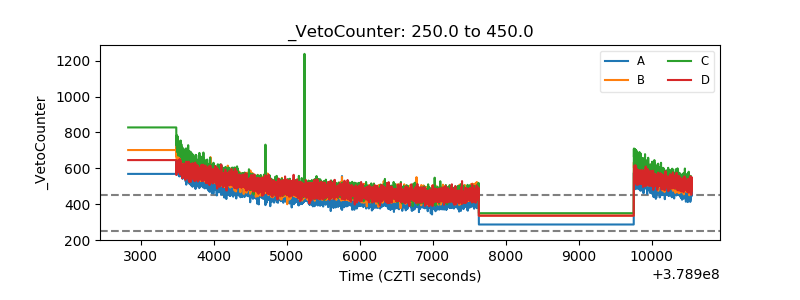 |