| Param | Original file | Final file |
|---|---|---|
| Filename | modeM0/AS1T04_090T01_9000004840_33890cztM0_level2.evt | modeM0/AS1T04_090T01_9000004840_33890cztM0_level2_quad_clean.evt |
| Size (bytes) | 485,501,760 | 59,008,320 |
| Size | 463.0 MB | 56.3 MB |
| Events in quadrant A | 2,476,106 | 362,948 |
| Events in quadrant B | 3,012,771 | 362,085 |
| Events in quadrant C | 3,188,786 | 359,765 |
| Events in quadrant D | 5,661,725 | 325,948 |
| Mode M9 | |||
|---|---|---|---|
| Quadrant | BADHDUFLAG | Total packets | Discarded packets |
| A | 0 | 27 | 0 |
| B | 0 | 27 | 0 |
| C | 0 | 27 | 0 |
| D | 0 | 28 | 0 |
| Mode M0 | |||
|---|---|---|---|
| Quadrant | BADHDUFLAG | Total packets | Discarded packets |
| A | 0 | 10844 | 3 |
| B | 0 | 12354 | 2 |
| C | 0 | 12544 | 2 |
| D | 0 | 20664 | 2 |
| Mode SS | |||
|---|---|---|---|
| Quadrant | BADHDUFLAG | Total packets | Discarded packets |
| A | 0 | 108 | 0 |
| B | 0 | 108 | 0 |
| C | 0 | 108 | 0 |
| D | 0 | 108 | 0 |
| Quadrant | Total seconds | Saturated seconds | Saturation percentage |
|---|---|---|---|
| A | 5370 | 4 | 0.074488% |
| B | 5370 | 97 | 1.806331% |
| C | 5370 | 160 | 2.979516% |
| D | 5370 | 789 | 14.692737% |
Noise dominated data is calculated using 1-second bins in cleaned event files. If a bin has >2000 counts, and if more than 50% of those come from <1% of pixels, then it is considered to be noise-dominated and hence unusable.
| Quadrant | # 1 sec bins | Bins with >0 counts | Bins with >2000 counts | High rate bins dominated by noise | Noise dominated (total time) | Noise dominated (detector-on time) | Marked lightcurve |
|---|---|---|---|---|---|---|---|
| A | 7012 | 5371 | 1 | 1 | 0.01% | 0.02% | 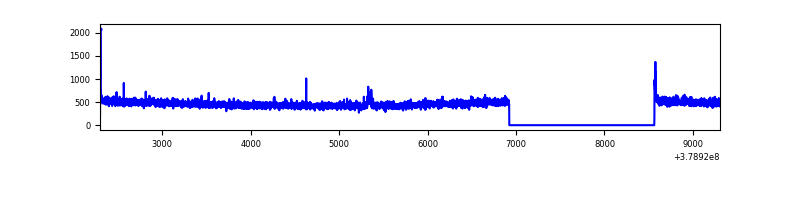 |
| B | 7012 | 5371 | 59 | 59 | 0.84% | 1.10% | 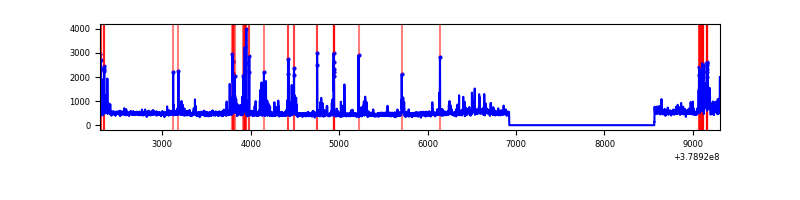 |
| C | 7012 | 5371 | 112 | 112 | 1.60% | 2.09% | 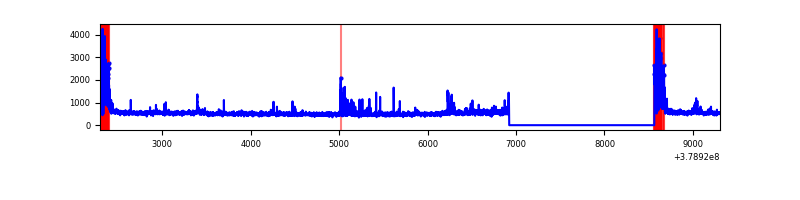 |
| D | 7012 | 5371 | 636 | 636 | 9.07% | 11.84% | 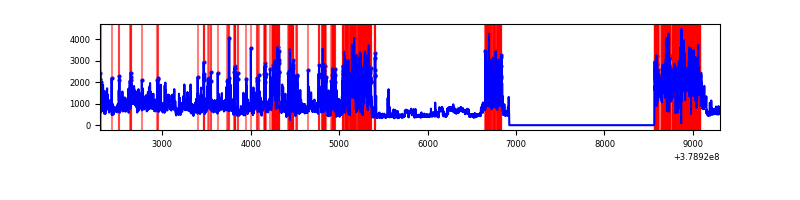 |
Top three noisy pixels from each quadrant. If the there are fewer than three noisy pixels in the level2.evt file, extra rows are filled as -1
| Pixel properties | Quadrant properties | ||||||
|---|---|---|---|---|---|---|---|
| Quadrant | DetID | PixID | Counts | Sigma | Mean | Median | Sigma |
| A | 13 | 6 | 13652 | 102.62 | 630 | 617 | 127.0 |
| A | 10 | 83 | 12327 | 92.19 | 630 | 617 | 127.0 |
| A | 15 | 169 | 11459 | 85.35 | 630 | 617 | 127.0 |
| B | 5 | 172 | 267977 | 2249.53 | 622 | 608 | 118.9 |
| B | 5 | 255 | 119198 | 997.77 | 622 | 608 | 118.9 |
| B | 5 | 207 | 47280 | 392.68 | 622 | 608 | 118.9 |
| C | 0 | 10 | 488627 | 3507.78 | 601 | 605 | 139.1 |
| C | 15 | 214 | 230692 | 1653.81 | 601 | 605 | 139.1 |
| C | 3 | 233 | 64053 | 456.05 | 601 | 605 | 139.1 |
| D | 12 | 235 | 1243459 | 8666.27 | 578 | 561 | 143.4 |
| D | 8 | 195 | 1222417 | 8519.56 | 578 | 561 | 143.4 |
| D | 2 | 250 | 427667 | 2978.05 | 578 | 561 | 143.4 |
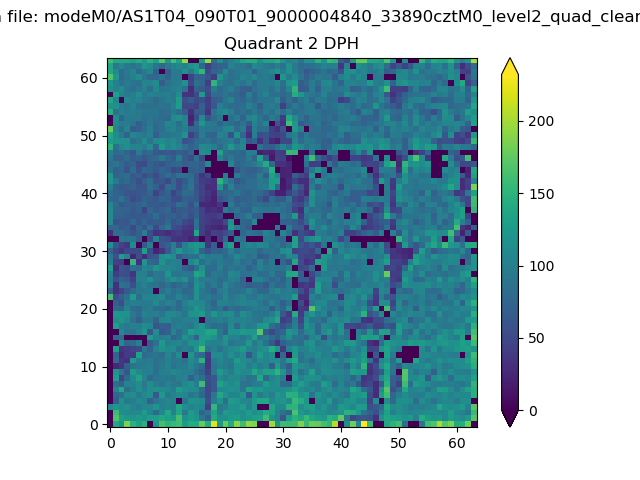
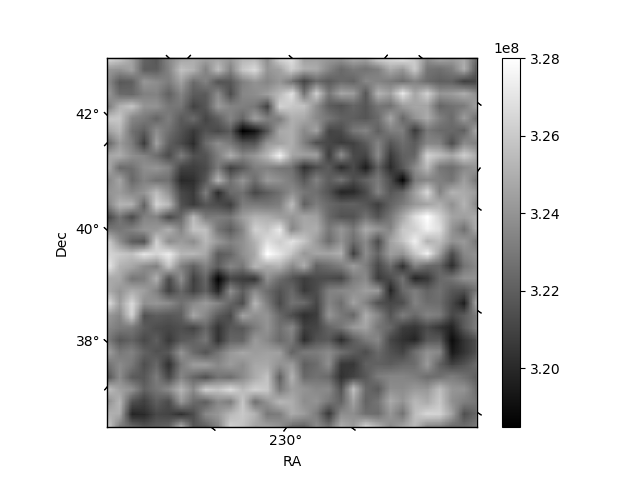
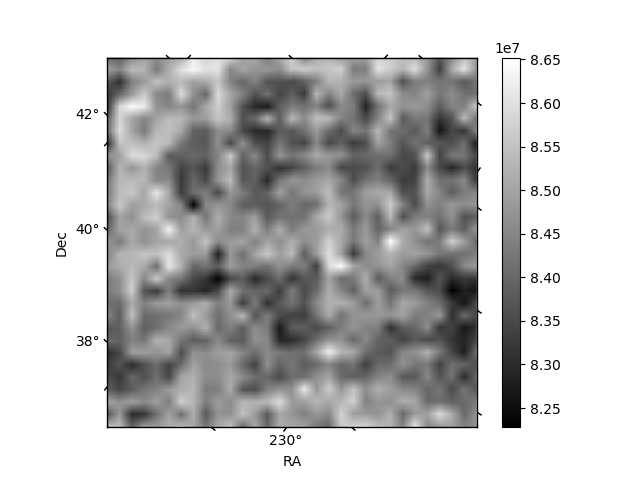
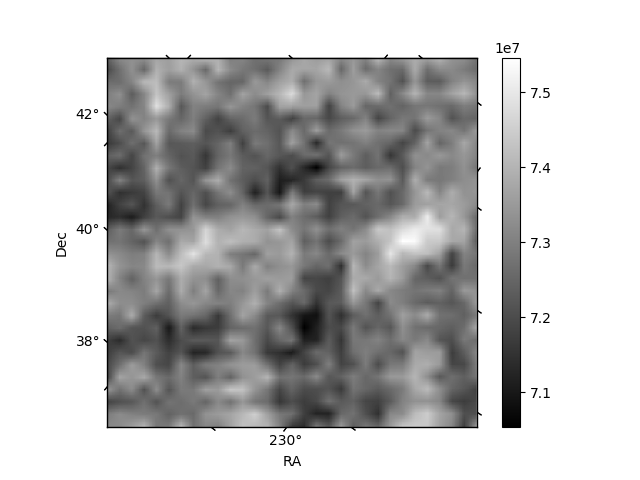
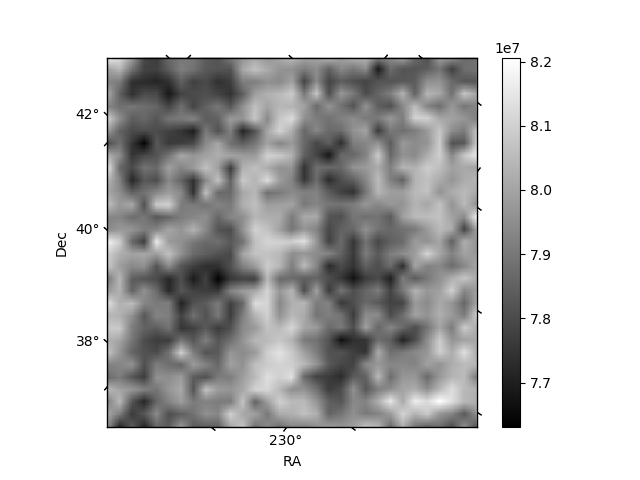
Histogram calculated using DETX and DETY for each event in the final _common_clean file
| Quadrant A | 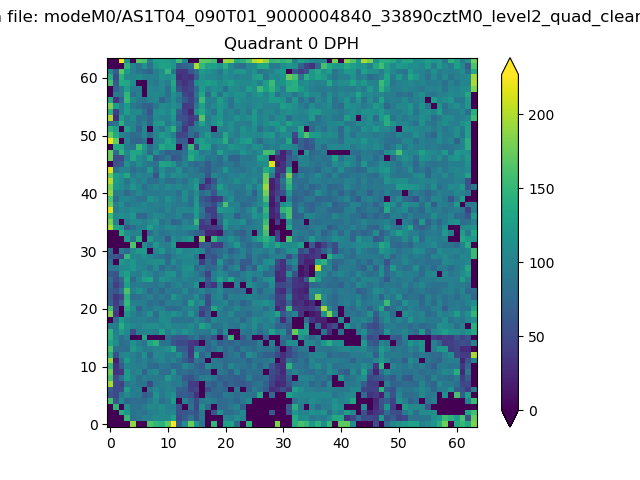 |
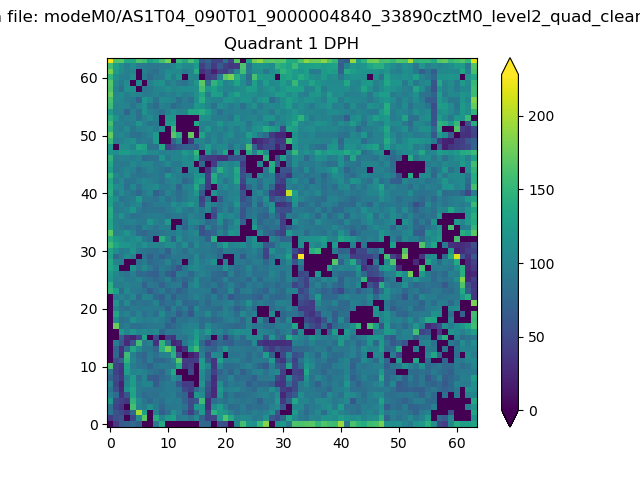 |
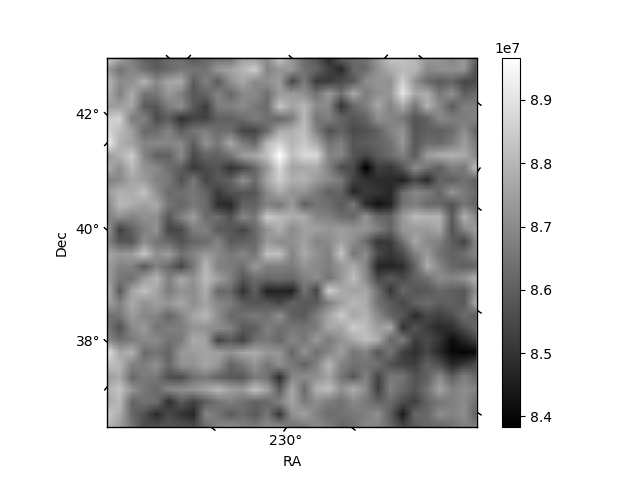
Quadrant B |
|---|---|---|---|
| Quadrant D | 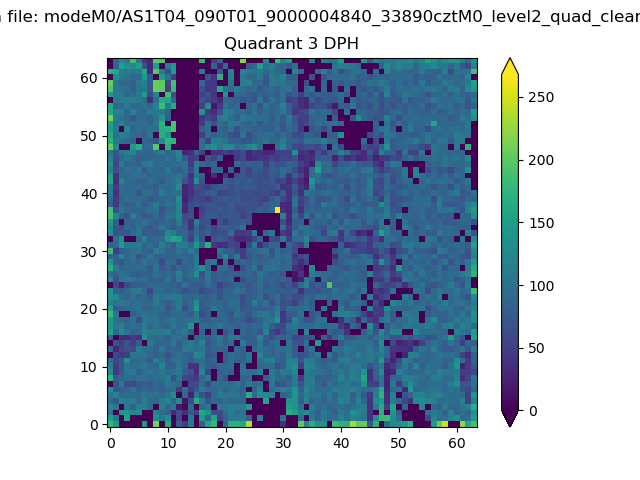 |
 |
Quadrant C |
| Plot type | Count rate plots | Images |
|---|---|---|
| Comparison with Poisson distribution Blue bars denote a histogram of data divided into 1 sec bins. Red curve is a Poisson curve with rate = median count rate of data. |
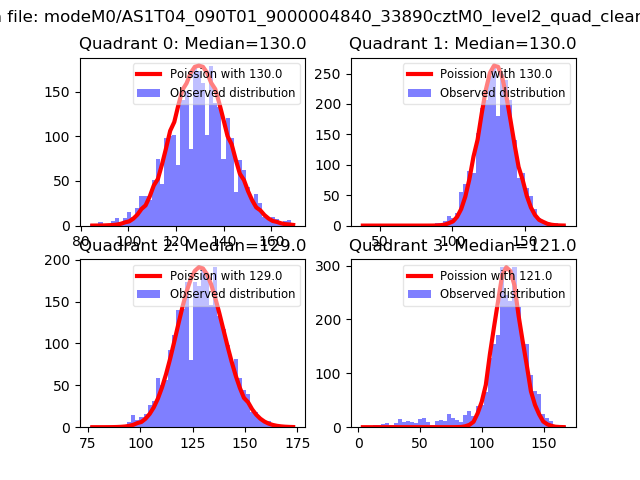 |
 |
| Quadrant-wise count rates Data is divided into 100 sec bins |
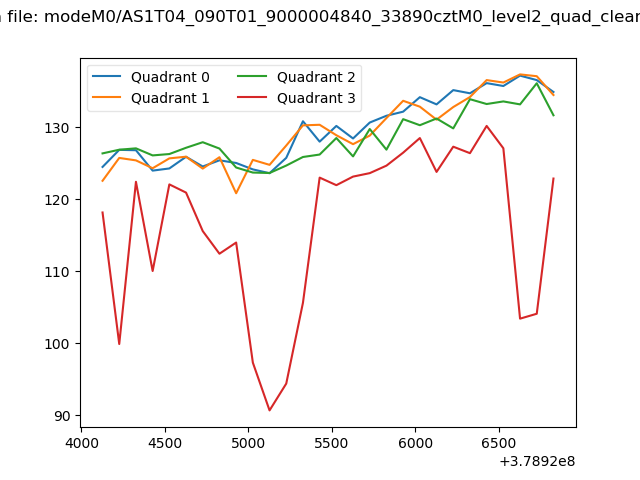 |
|
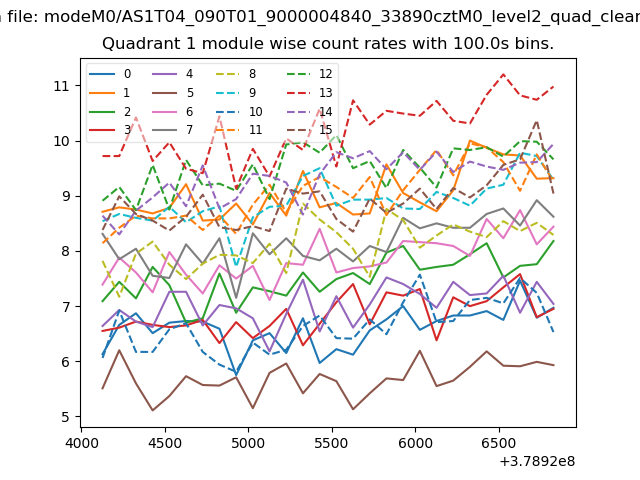
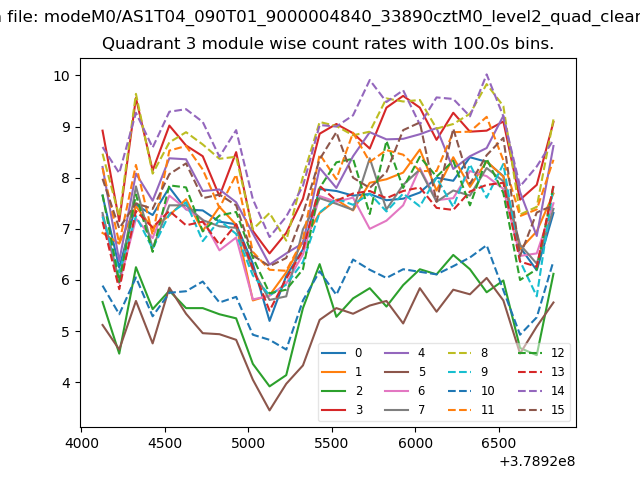
| Module-wise count rates for Quadrant A Data is divided into 100 sec bins |
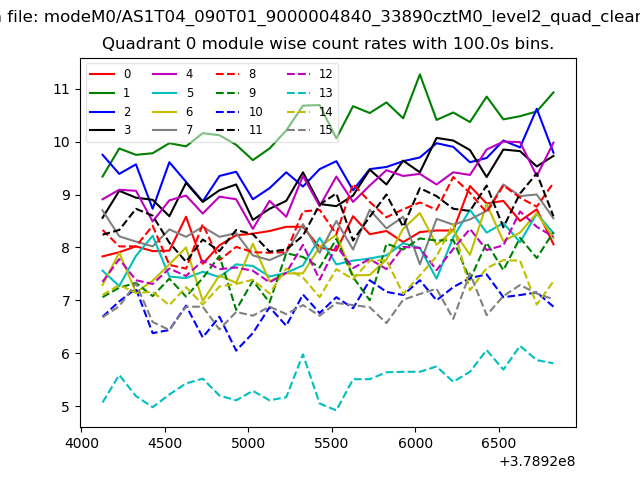 |
 |
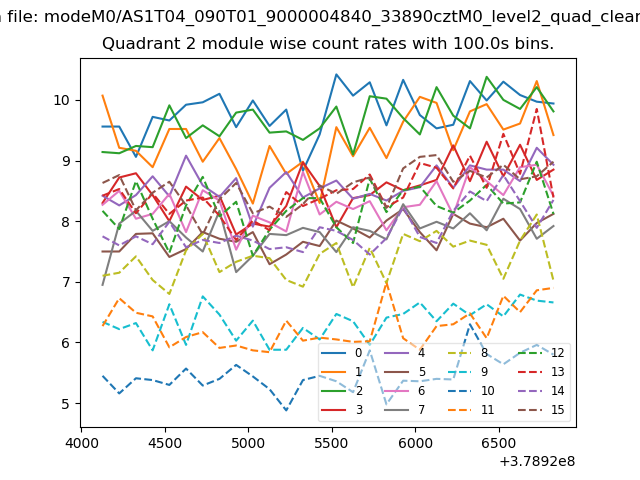
| Module-wise count rates for Quadrant B Data is divided into 100 sec bins |
 |
 |
| Module-wise count rates for Quadrant C Data is divided into 100 sec bins |
 |
 |
| Module-wise count rates for Quadrant D Data is divided into 100 sec bins |
 |
 |
| Parameter | Plot |
|---|---|
| CZT HV Monitor | 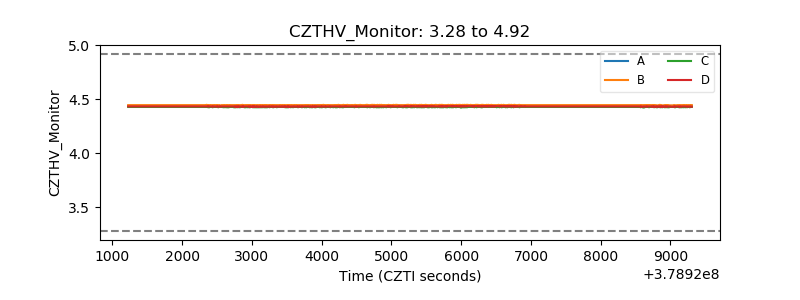 |
| D_VDD | 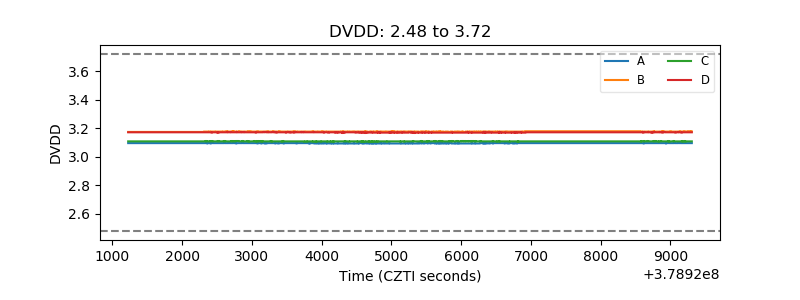 |
| Temperature 1 | 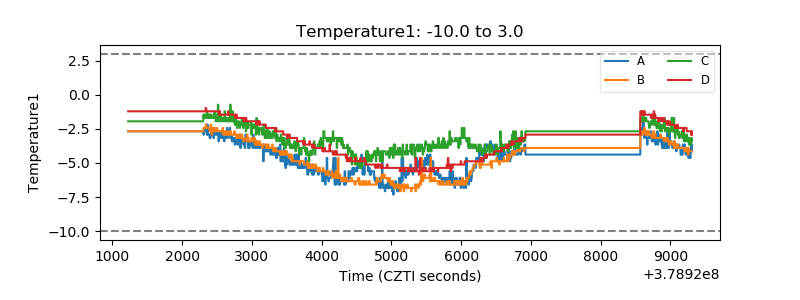 |
| Veto HV Monitor |  |
| Veto LLD | 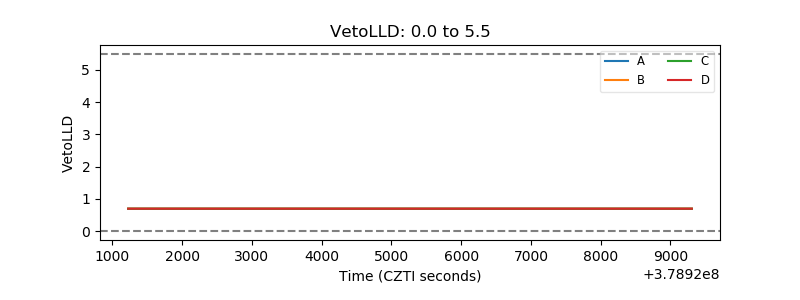 |
| Alpha Counter | 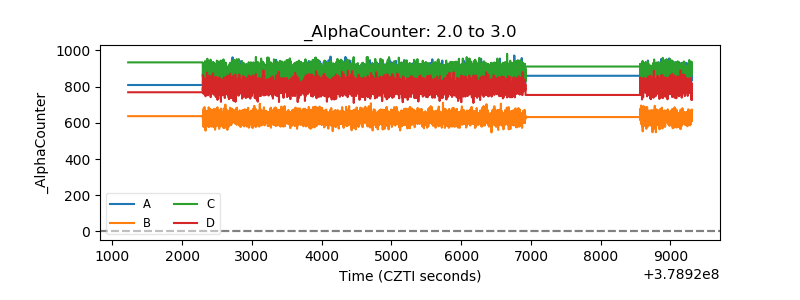 |
| _CPM_Rate | 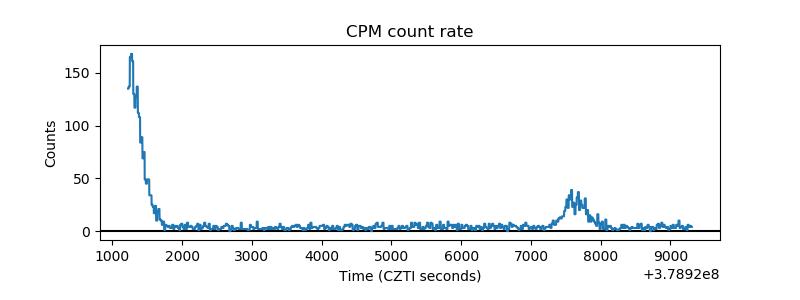 |
| CZT Counter | 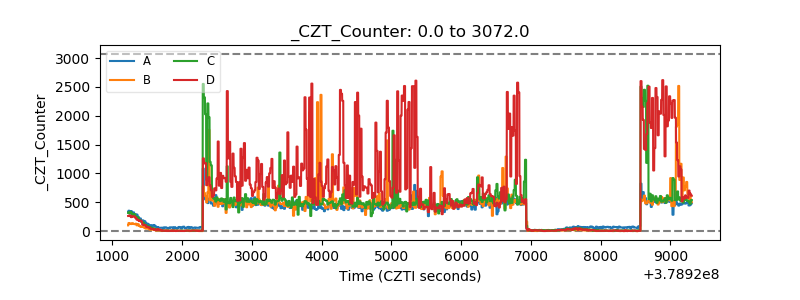 |
| +2.5 Volts monitor |  |
| +5 Volts monitor |  |
| _ROLL_ROT | 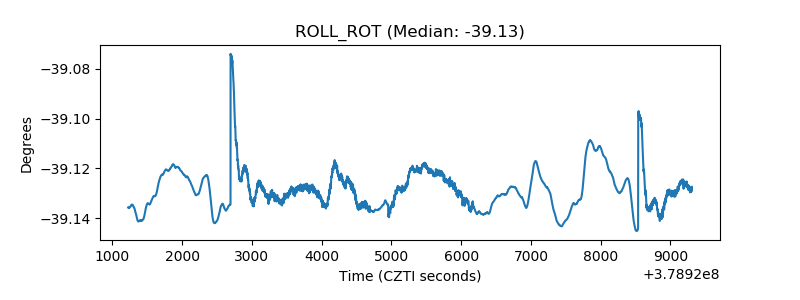 |
| _Roll_DEC | 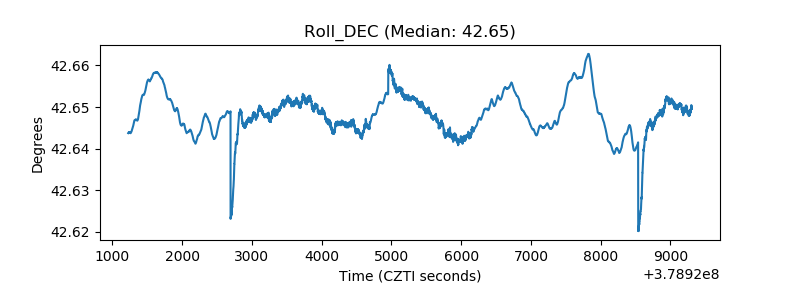 |
| _Roll_RA | 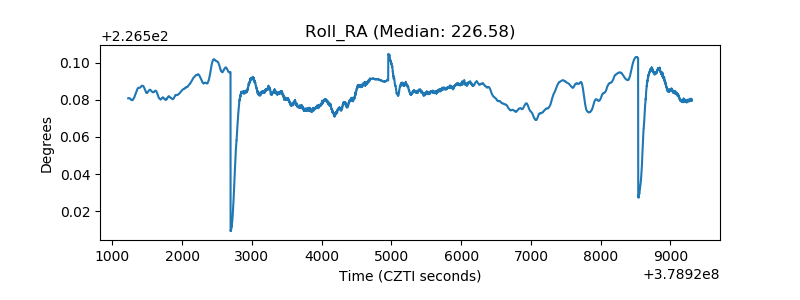 |
| Veto Counter | 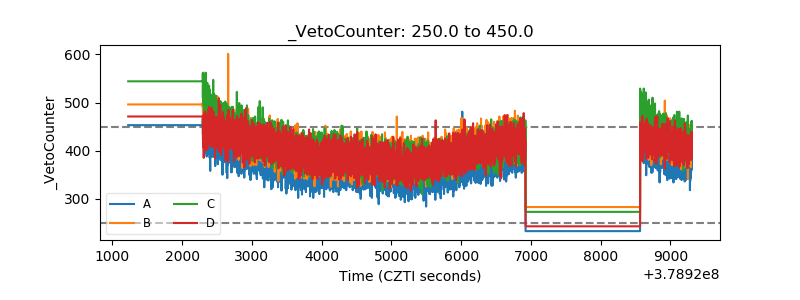 |