| Param | Original file | Final file |
|---|---|---|
| Filename | modeM0/AS1T04_090T01_9000004840_33891cztM0_level2.evt | modeM0/AS1T04_090T01_9000004840_33891cztM0_level2_quad_clean.evt |
| Size (bytes) | 613,232,640 | 69,523,200 |
| Size | 584.8 MB | 66.3 MB |
| Events in quadrant A | 3,333,058 | 445,811 |
| Events in quadrant B | 3,600,296 | 434,976 |
| Events in quadrant C | 3,406,367 | 443,549 |
| Events in quadrant D | 7,836,648 | 372,119 |
| Mode M9 | |||
|---|---|---|---|
| Quadrant | BADHDUFLAG | Total packets | Discarded packets |
| A | 0 | 27 | 0 |
| B | 0 | 27 | 0 |
| C | 0 | 27 | 0 |
| D | 0 | 28 | 0 |
| Mode M0 | |||
|---|---|---|---|
| Quadrant | BADHDUFLAG | Total packets | Discarded packets |
| A | 0 | 13797 | 3 |
| B | 0 | 14432 | 2 |
| C | 0 | 13524 | 2 |
| D | 0 | 27448 | 2 |
| Mode SS | |||
|---|---|---|---|
| Quadrant | BADHDUFLAG | Total packets | Discarded packets |
| A | 0 | 118 | 0 |
| B | 0 | 118 | 0 |
| C | 0 | 118 | 0 |
| D | 0 | 118 | 0 |
| Quadrant | Total seconds | Saturated seconds | Saturation percentage |
|---|---|---|---|
| A | 5842 | 345 | 5.905512% |
| B | 5842 | 220 | 3.765834% |
| C | 5842 | 146 | 2.499144% |
| D | 5842 | 1573 | 26.925710% |
Noise dominated data is calculated using 1-second bins in cleaned event files. If a bin has >2000 counts, and if more than 50% of those come from <1% of pixels, then it is considered to be noise-dominated and hence unusable.
| Quadrant | # 1 sec bins | Bins with >0 counts | Bins with >2000 counts | High rate bins dominated by noise | Noise dominated (total time) | Noise dominated (detector-on time) | Marked lightcurve |
|---|---|---|---|---|---|---|---|
| A | 7215 | 5843 | 263 | 263 | 3.65% | 4.50% | 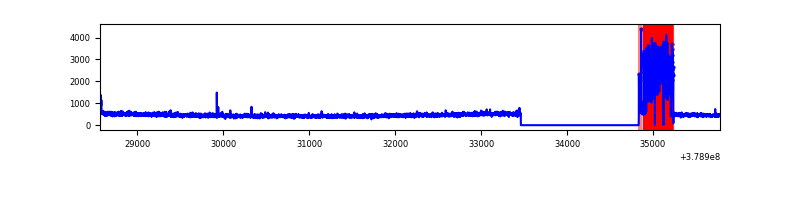 |
| B | 7215 | 5843 | 152 | 152 | 2.11% | 2.60% | 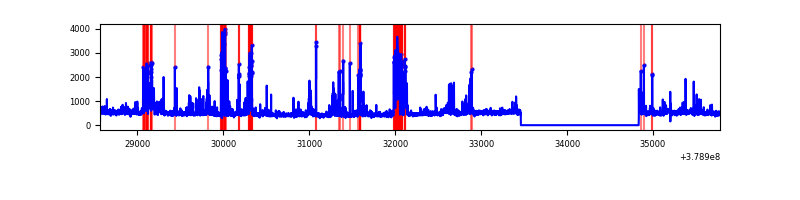 |
| C | 7215 | 5843 | 96 | 96 | 1.33% | 1.64% | 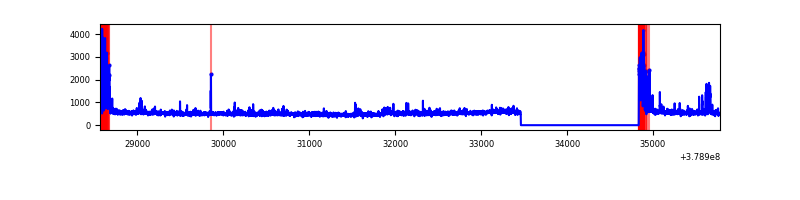 |
| D | 7215 | 5843 | 1388 | 1388 | 19.24% | 23.75% | 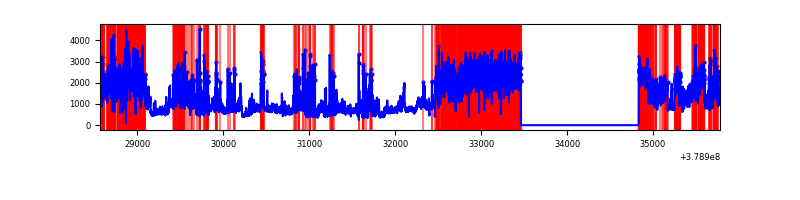 |
Top three noisy pixels from each quadrant. If the there are fewer than three noisy pixels in the level2.evt file, extra rows are filled as -1
| Pixel properties | Quadrant properties | ||||||
|---|---|---|---|---|---|---|---|
| Quadrant | DetID | PixID | Counts | Sigma | Mean | Median | Sigma |
| A | 15 | 169 | 789296 | 6031.91 | 650 | 637 | 130.7 |
| A | 13 | 6 | 17207 | 126.73 | 650 | 637 | 130.7 |
| A | 10 | 83 | 11746 | 84.97 | 650 | 637 | 130.7 |
| B | 5 | 172 | 644545 | 5004.04 | 666 | 649 | 128.7 |
| B | 5 | 207 | 67498 | 519.52 | 666 | 649 | 128.7 |
| B | 4 | 232 | 53242 | 408.73 | 666 | 649 | 128.7 |
| C | 0 | 10 | 446632 | 2916.99 | 654 | 658 | 152.9 |
| C | 15 | 214 | 253347 | 1652.76 | 654 | 658 | 152.9 |
| C | 3 | 233 | 115484 | 751.04 | 654 | 658 | 152.9 |
| D | 1 | 52 | 2221766 | 15039.75 | 595 | 577 | 147.7 |
| D | 8 | 195 | 1490893 | 10090.98 | 595 | 577 | 147.7 |
| D | 12 | 235 | 978361 | 6620.61 | 595 | 577 | 147.7 |
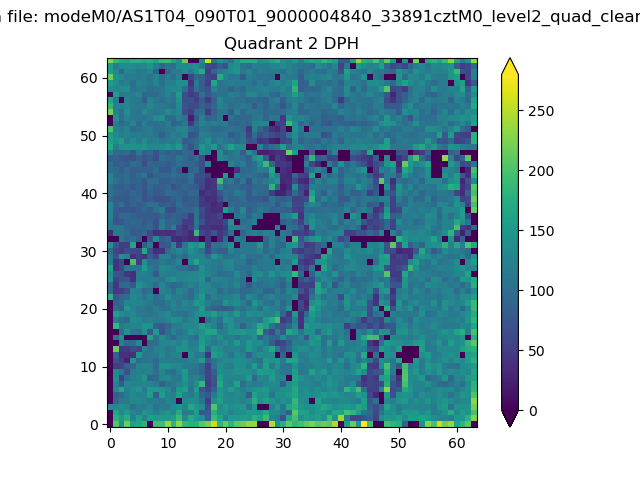
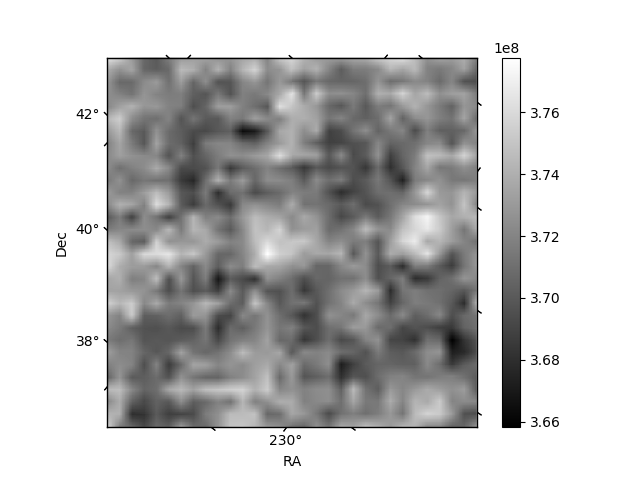
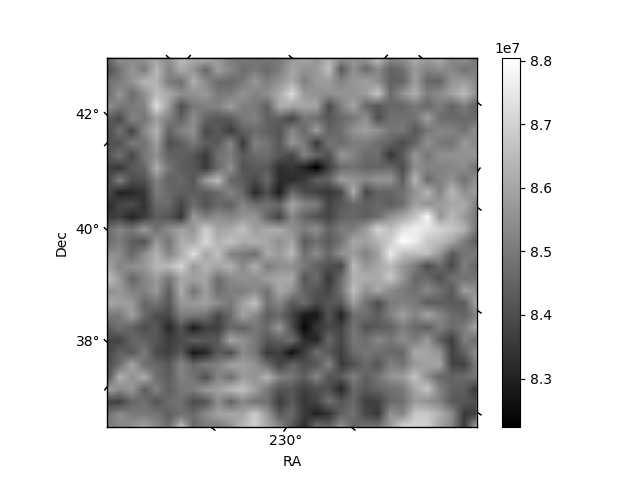
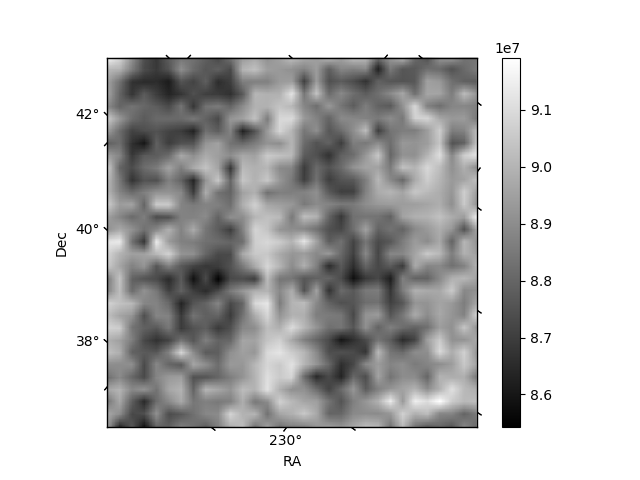
Histogram calculated using DETX and DETY for each event in the final _common_clean file
| Quadrant A | 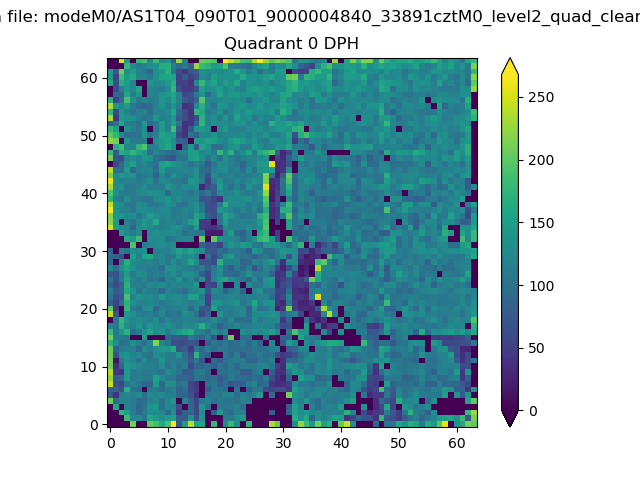 |
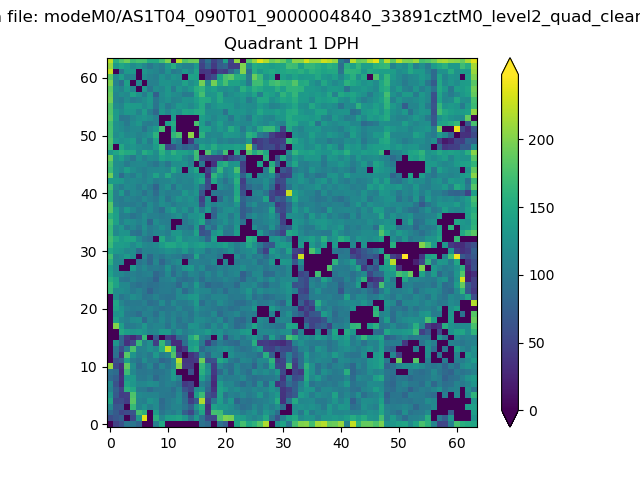 |
Quadrant B |
|---|---|---|---|
| Quadrant D | 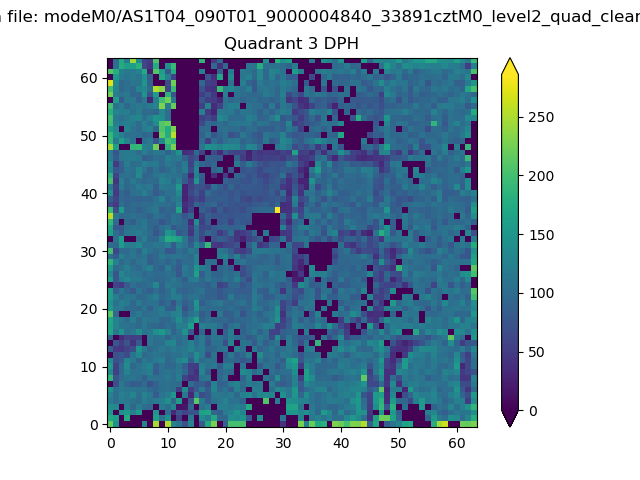 |
 |
Quadrant C |
| Plot type | Count rate plots | Images |
|---|---|---|
| Comparison with Poisson distribution Blue bars denote a histogram of data divided into 1 sec bins. Red curve is a Poisson curve with rate = median count rate of data. |
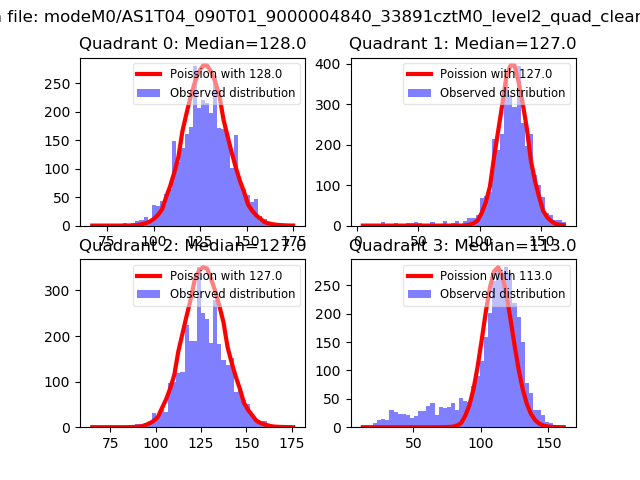 |
 |
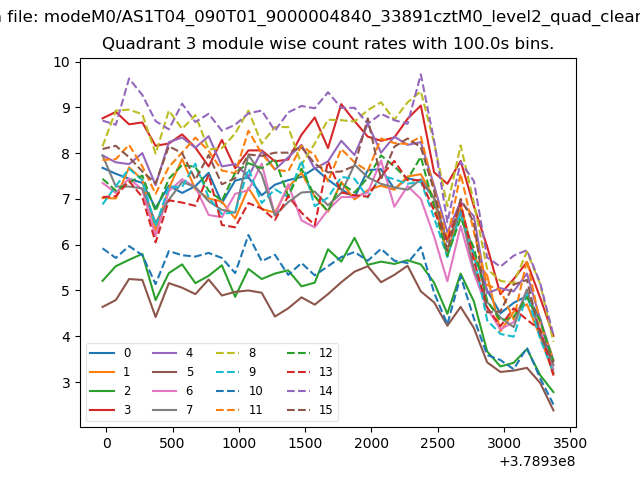
| Quadrant-wise count rates Data is divided into 100 sec bins |
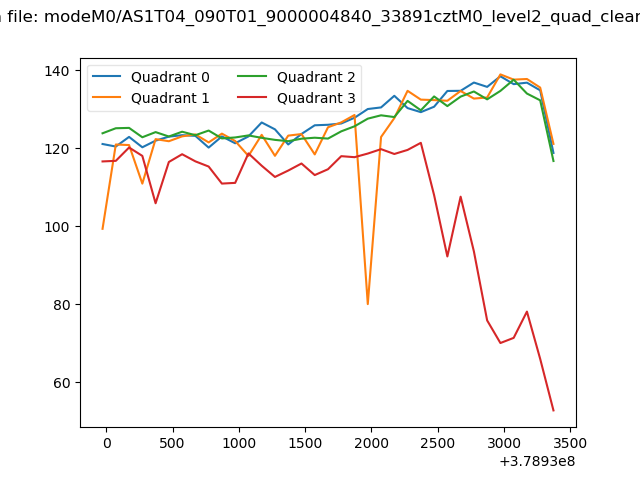 |
|
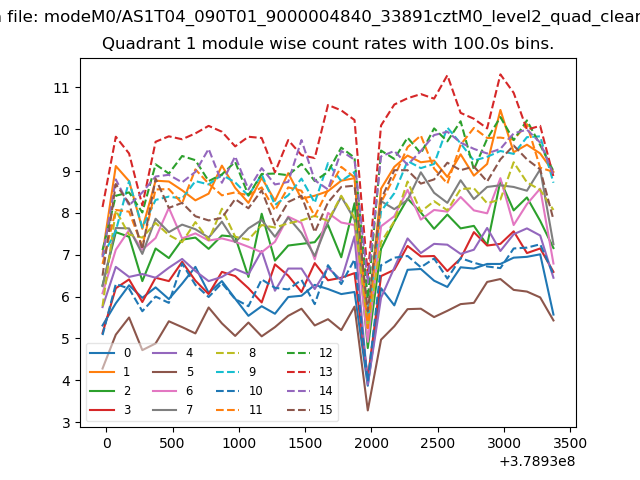
| Module-wise count rates for Quadrant A Data is divided into 100 sec bins |
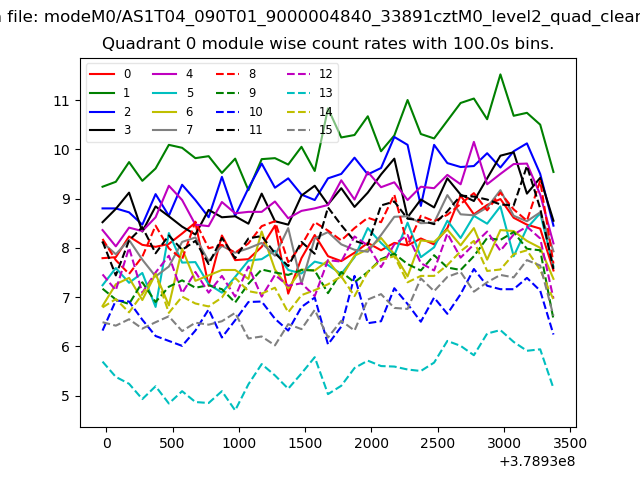 |
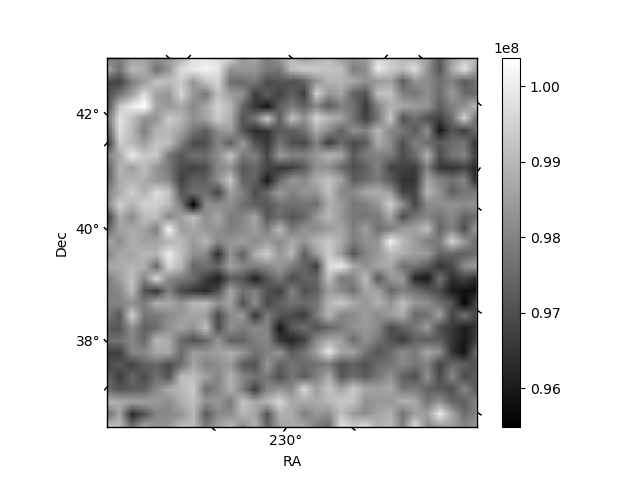 |
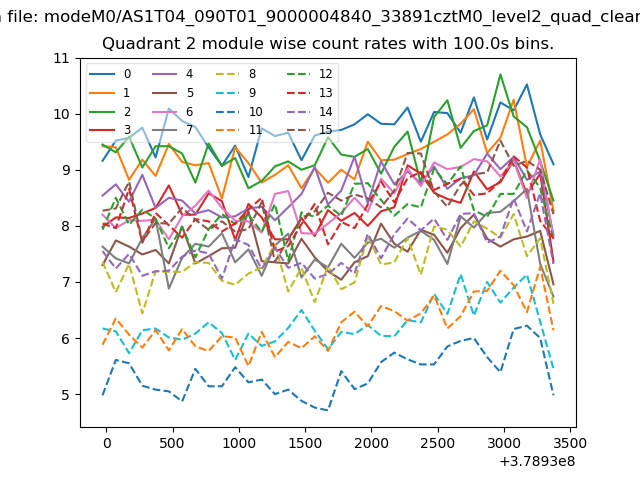
| Module-wise count rates for Quadrant B Data is divided into 100 sec bins |
 |
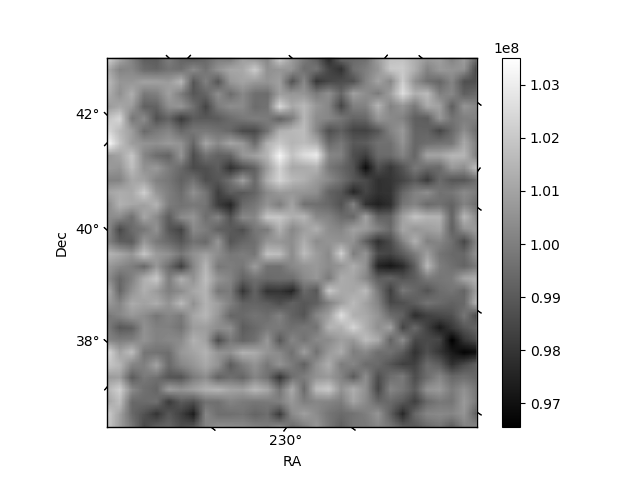 |
| Module-wise count rates for Quadrant C Data is divided into 100 sec bins |
 |
 |
| Module-wise count rates for Quadrant D Data is divided into 100 sec bins |
 |
 |
| Parameter | Plot |
|---|---|
| CZT HV Monitor | 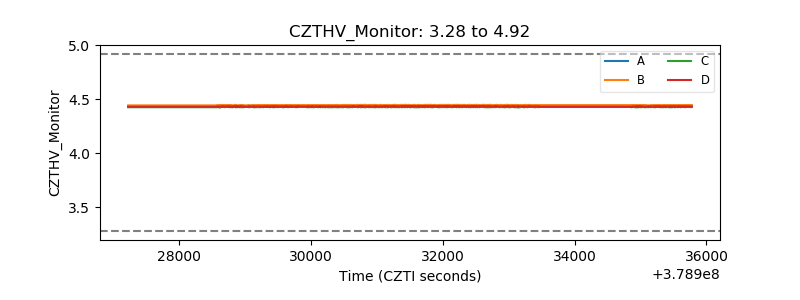 |
| D_VDD | 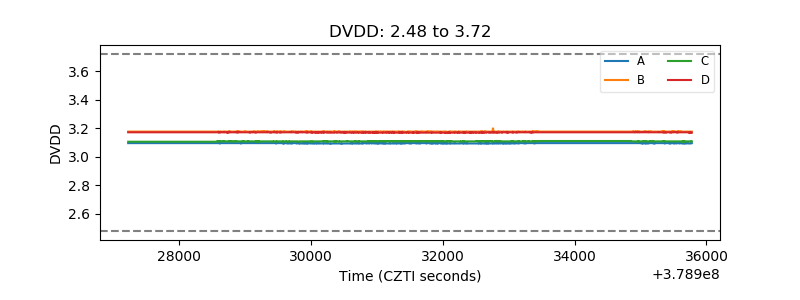 |
| Temperature 1 | 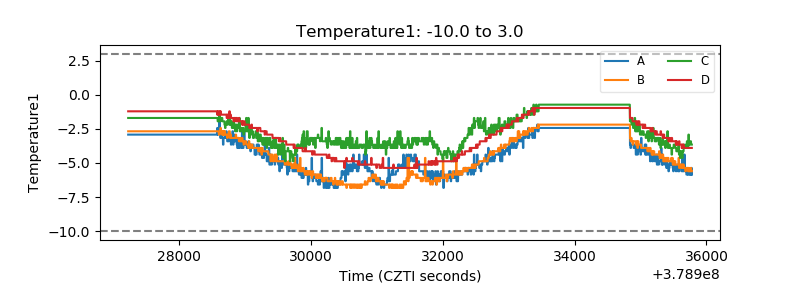 |
| Veto HV Monitor | 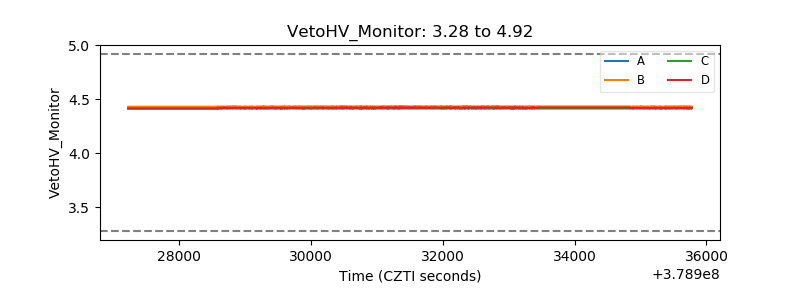 |
| Veto LLD | 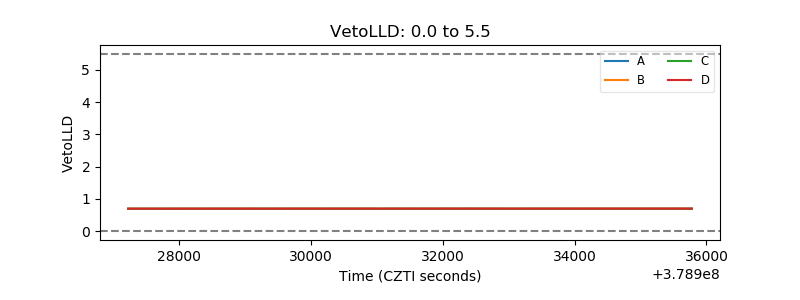 |
| Alpha Counter | 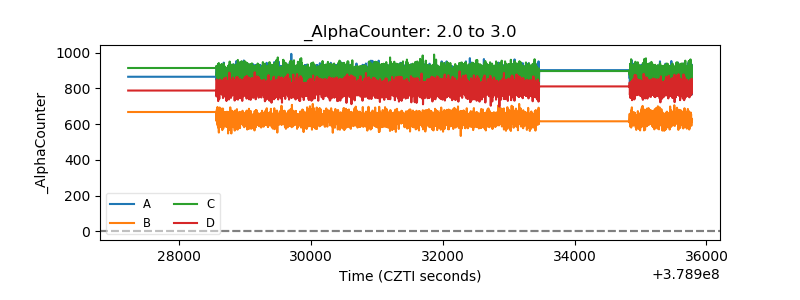 |
| _CPM_Rate | 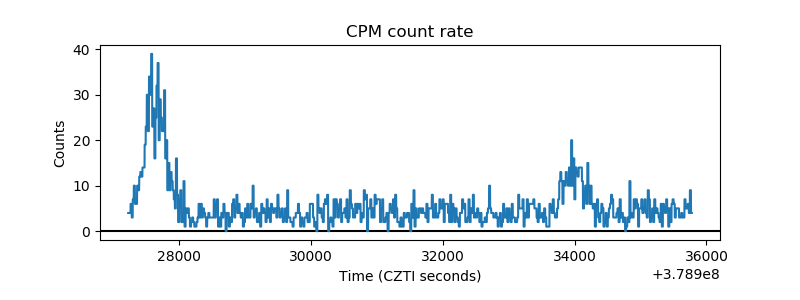 |
| CZT Counter | 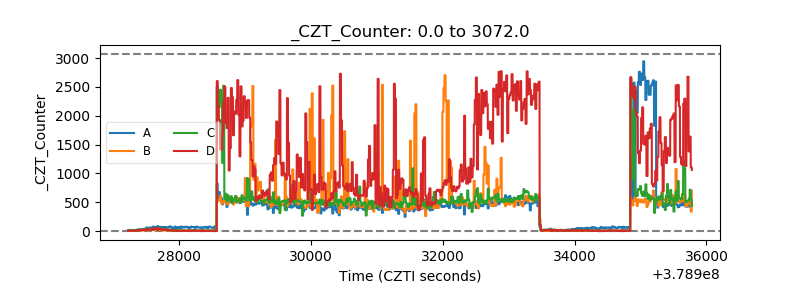 |
| +2.5 Volts monitor |  |
| +5 Volts monitor |  |
| _ROLL_ROT |  |
| _Roll_DEC | 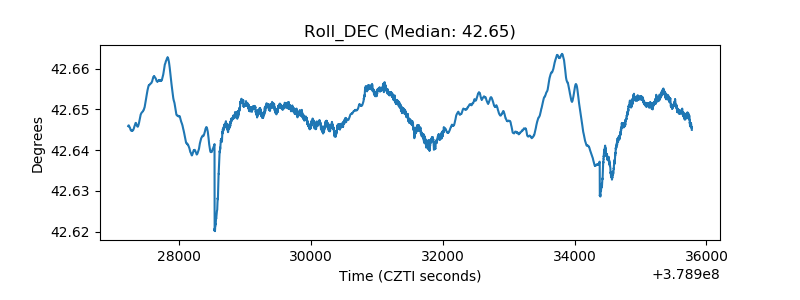 |
| _Roll_RA | 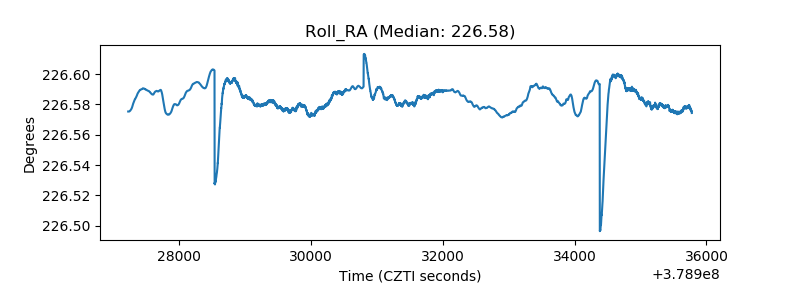 |
| Veto Counter | 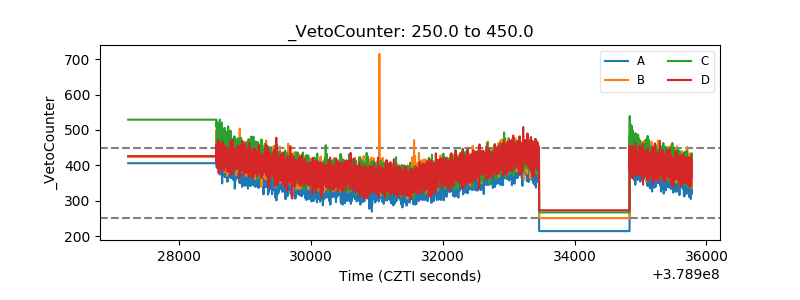 |